Machine Learning by Stanford University WEEK2 のまとめ
Octave,MATLABの環境セットアップ
省略 講義のスライド参照
多変量線形回帰
複数の特徴量
複数の変数による線形回帰は、多変量線形回帰と呼ばれる。
多変量線形回帰で用いられる変数の意味は以下の通り。
添字jはベクトルの要素番号、iは何番目のトレーニングセットか、というインデックスを表す。

仮説関数h(x)は以下のように定義できる。

この式は、ベクトルを用いて以下のように表す事ができる。

多変量線形回帰に対する最急降下法
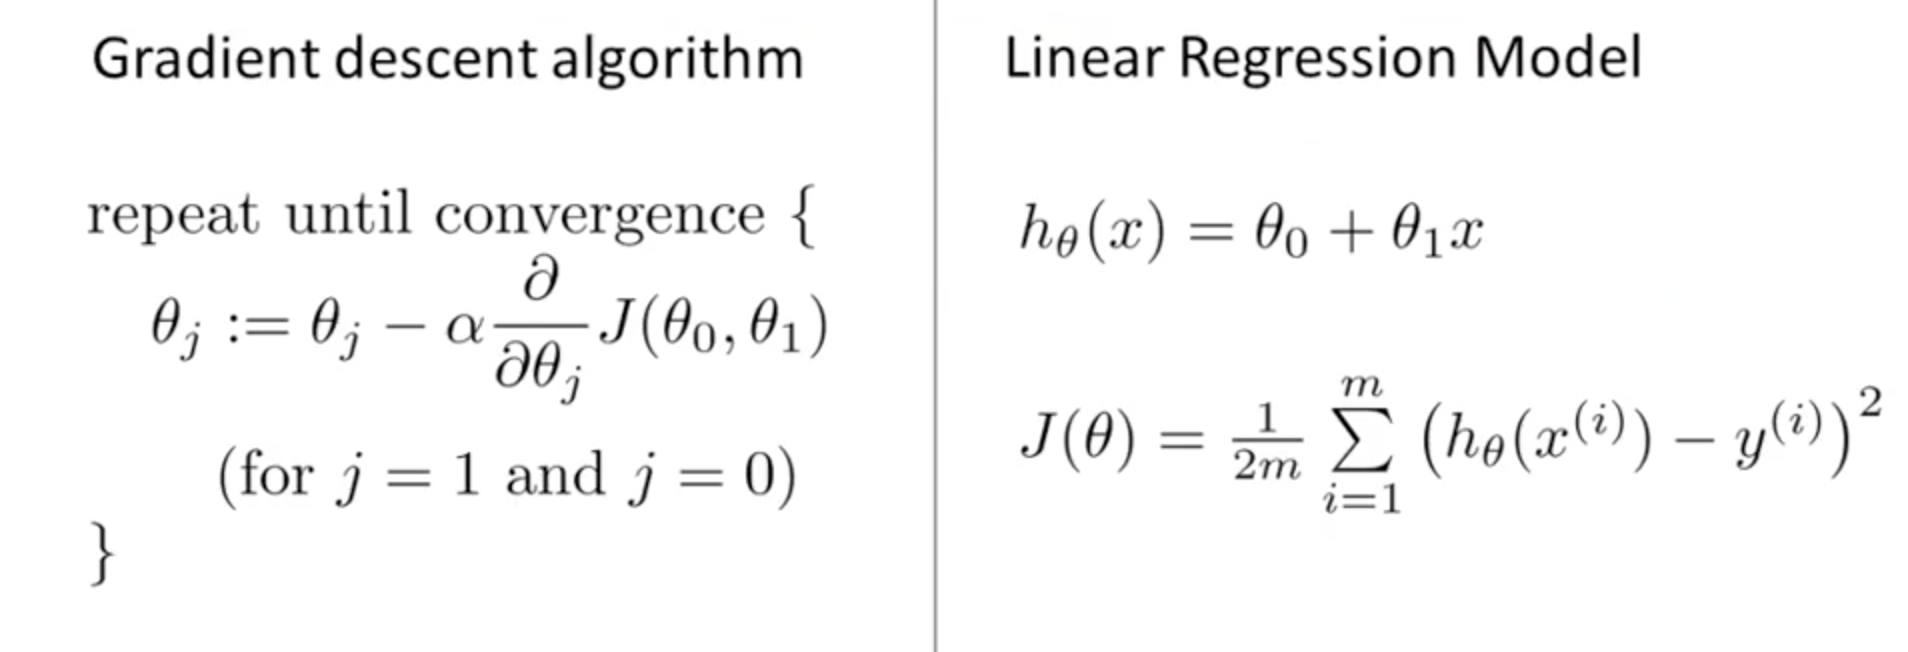
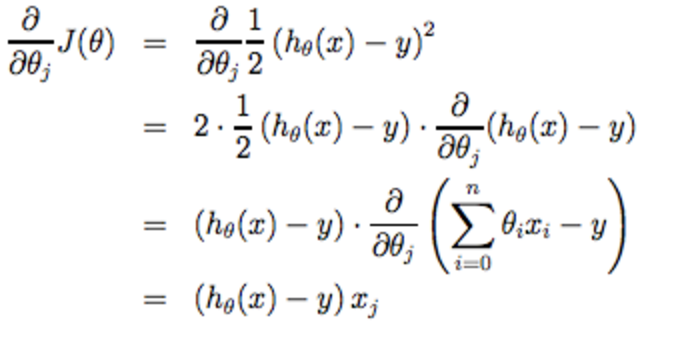
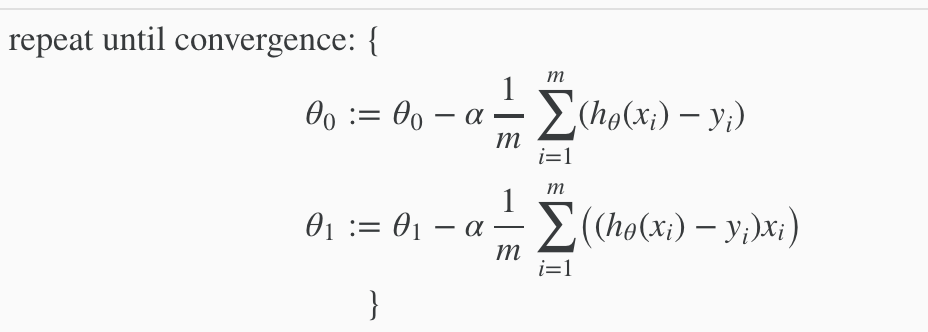
単変量線形回帰の最急降下法の復習
多変量線形回帰の最急降下法
上記の単変量線形回帰の式に習い、多変量線形回帰の場合以下のようになる。
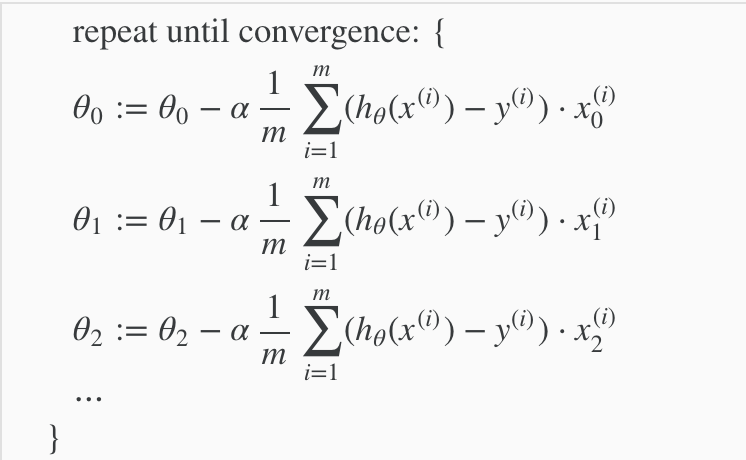
θ、xをベクトルとすると、上記は以下になる。

多変量線形回帰の最急降下法実践1 〜フィーチャースケーリング〜
各変数のスケールが極端に異なると、最急降下法の計算に非常に多くの時間がかかってしまう。
したがって、全ての変数にある値を乗算、除算して
-1 <= x(i) <= 1
または
-0.5 <= x(i) <= 0.5 となるよう
スケールを合わせることをフィーチャースケーリングという。
-0.5 <= x(i) <= 0.5となるようなフィーチャースケーリングの具体的な式は以下。
μiは平均値、siは値の範囲=max-minである。
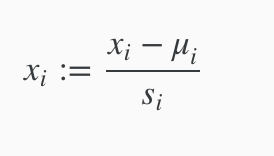
例えば、家の価格xi が 100-2000の間で与えられており、平均値が1000の場合、-0.5 <= x(i) <= 0.5 となるようなフィーチャースケーリングは以下の式でできる。

多変量線形回帰の最急降下法実践2 〜 学習率 〜
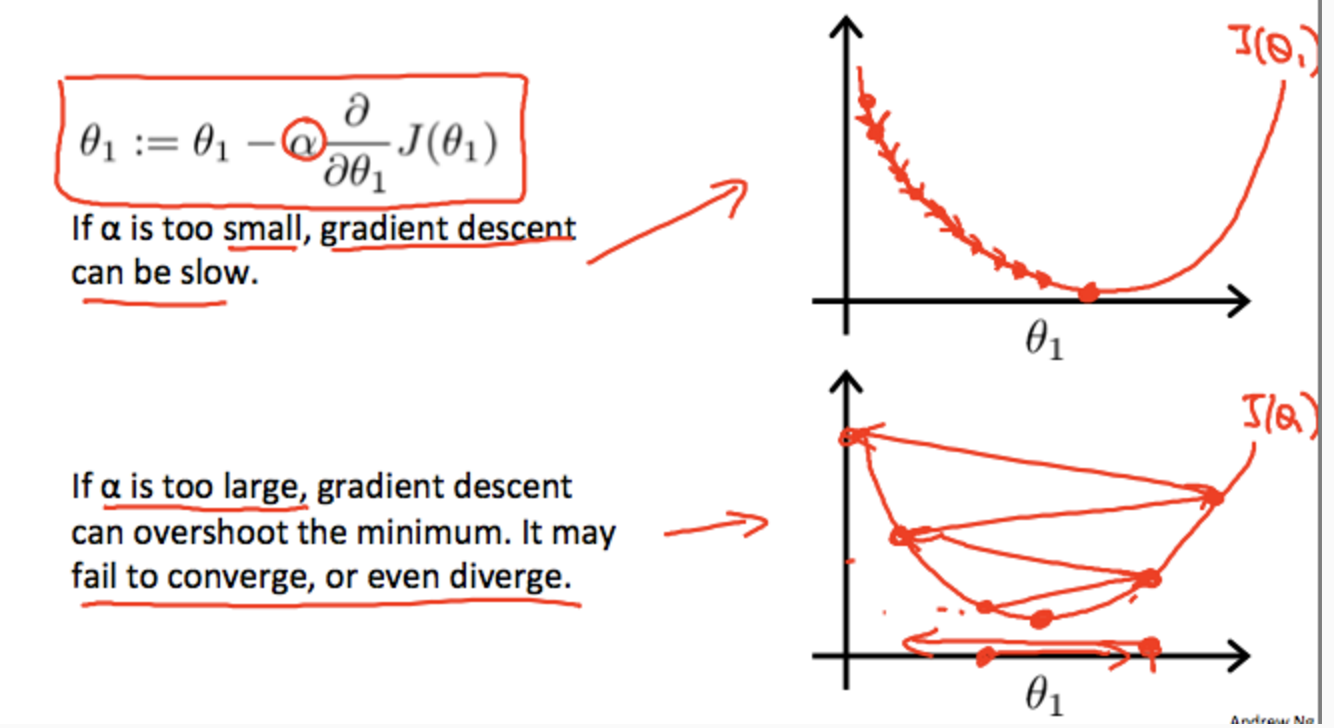
学習率の復習
学習率が適当な値に設定されているか?の判断
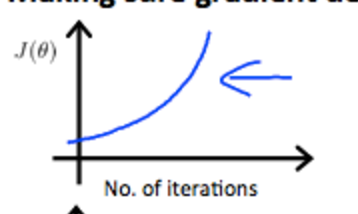
x軸に学習回数、 y軸にコスト関数J(θ)を取ってグラフを書いた際、以下のようなグラフになれば、学習とともにJ(θ)が0に近似しており、適当な値に学習率が設定されていると言える。
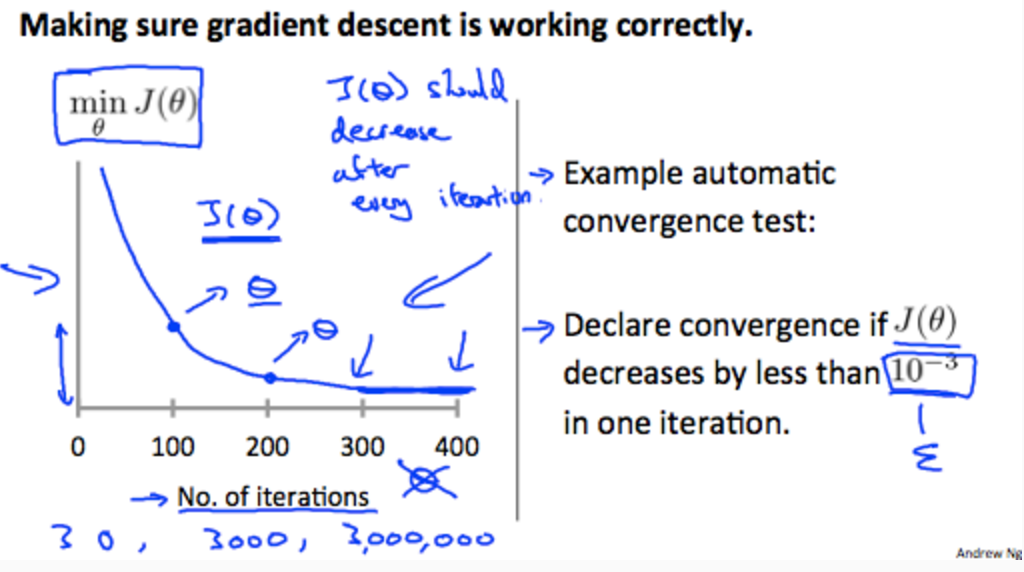
学習率が小さすぎると学習回数とJ(θ)のグラフ勾配が緩くなり学習に非常に時間がかかる事となる。
多項式回帰
- 多項式回帰は、多変量線形回帰の考え方を元に複雑な非線形の問題を解く事ができる。
線形の式

に置き換えられ、前項までの多変量線形回帰に対する最急降下法の考えを当てはめてθを求めることができる。
この際、x1,x2,x3のスケールが異なってくるので、フィーチャースケーリングが必要になってくる。
変数の統計的計算
正規方程式
ここまではθを求めるのに最急降下法を用いてきた。
この項では、θを求める別の方法、正規方程式を学ぶ。
正規方程式は、最急降下法と異なり一度でθの値を求める方法。
θは以下で求められる。

XT は Xの転置行列 (XTX)-1 は XTXの逆行列。
ex)
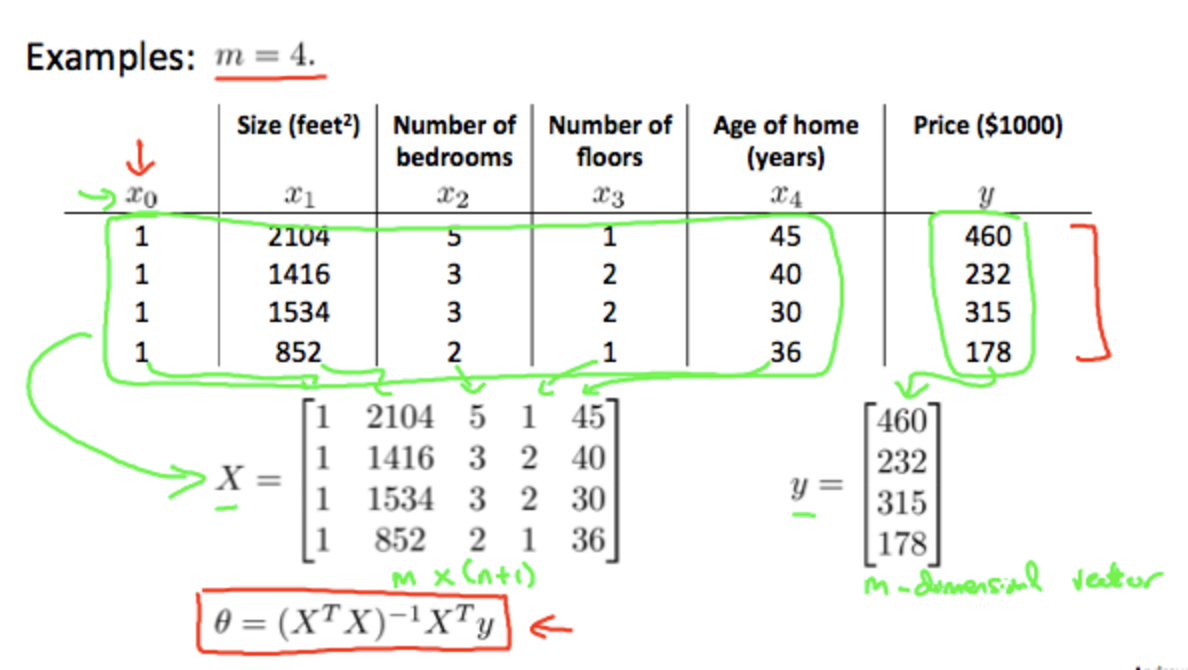
正規方程式の計算量は、n**3のオーダー(逆行列の計算に時間がかかる)なので、nが大きいと正規方程式には非常に時間がかかる。経験上nが10000位までは、現代のコンピュータであれば計算に時間もかからず一度でθの値を求められるので、最急降下法の代替案になり得る。
正規方程式と非可逆(逆行列を持たない)性
- もし、正規方程式のXTXが特異行列(逆行列を持たない行列)だったとしても、octaveで'pinv'関数を使えばθの値を求められる。'inv'関数では求められないので注意。
- また、XTXが特異行列なのは以下のようなケースが考えられる
- 変数の中に相関のある変数がある → 一方を変数から削除すれば良い
- 変数と比較して学習データが少なすぎる
Octave/Matlab Tutrial
Octaveの基礎
比較演算子
- ==
- ~=
- &&
- ||
- xor
行列の計算
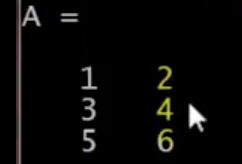
A = [1 2 ; 3 4 ; 5 6 ;]
v = 1:0.1:2
→1から2まで0.1刻みの数値で構成される1×11の行列
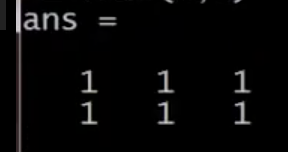
ones(2,3)
rand(3,4) 3×4の乱数
→
randn(1,3) 3×4の正規分布

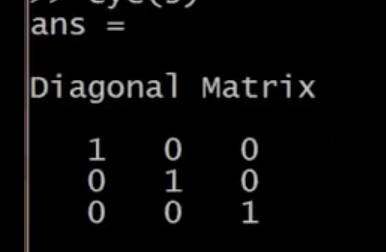
eye(3) 3*3の単位行列
size(A) Aが行列の場合にAのサイズを出力
ex)出力結果 3 2 (sizeの結果は1×2の行列になる)
size(A,1) Aの1次元目のサイズ
ex) 出力結果 3
size(A, 2) Aの2次元目のサイズ
ex) 出力結果 2
v = [ 1 2 3 4 ] %ベクトル
length(v)
→ 4
A = [1 2; 3 4; 5 6]
A(3,2)
→ 6
A(2,:)
→ 3 4
A(: ,2)
→
2
4
6
A' → Aの転置行列
pinv(A) → Aの逆行列
ベクトル演算のテクニック
Octave チュートリアル
Basic Operations
%% Change Octave prompt
PS1('>> ');
%% Change working directory in windows example:
cd 'c:/path/to/desired/directory name'
%% Note that it uses normal slashes and does not use escape characters for the empty spaces.

%% elementary operations
5+6
3-2
5*8
1/2
2^6
1 == 2 % false
1 ~= 2 % true.  note, not "!="
1 && 0
1 || 0
xor(1,0)


%% variable assignment
a = 3; % semicolon suppresses output
b = 'hi';
c = 3>=1;

% Displaying them:
a = pi
disp(a)
disp(sprintf('2 decimals: %0.2f', a))
disp(sprintf('6 decimals: %0.6f', a))
format long
a
format short
a


%%  vectors and matrices
A = [1 2; 3 4; 5 6]

v = [1 2 3]
v = [1; 2; 3]
v = 1:0.1:2   % from 1 to 2, with stepsize of 0.1. Useful for plot axes
v = 1:6       % from 1 to 6, assumes stepsize of 1 (row vector)

C = 2*ones(2,3) % same as C = [2 2 2; 2 2 2]
w = ones(1,3)   % 1x3 vector of ones
w = zeros(1,3)
w = rand(1,3) % drawn from a uniform distribution
w = randn(1,3)% drawn from a normal distribution (mean=0, var=1)
w = -6 + sqrt(10)*(randn(1,10000));  % (mean = -6, var = 10) - note: add the semicolon
hist(w)    % plot histogram using 10 bins (default)
hist(w,50) % plot histogram using 50 bins
% note: if hist() crashes, try "graphics_toolkit('gnu_plot')"

I = eye(4)   % 4x4 identity matrix

% help function
help eye
help rand
help help
Moving Data Around
%% dimensions
sz = size(A) % 1x2 matrix: [(number of rows) (number of columns)]
size(A,1) % number of rows
size(A,2) % number of cols
length(v) % size of longest dimension


%% loading data
pwd   % show current directory (current path)
cd 'C:\Users\ang\Octave files'  % change directory
ls    % list files in current directory
load q1y.dat   % alternatively, load('q1y.dat')
load q1x.dat
who   % list variables in workspace
whos  % list variables in workspace (detailed view)
clear q1y      % clear command without any args clears all vars
v = q1x(1:10); % first 10 elements of q1x (counts down the columns)
save hello.mat v;  % save variable v into file hello.mat
save hello.txt v -ascii; % save as ascii
% fopen, fread, fprintf, fscanf also work  [[not needed in class]]

%% indexing
A(3,2)  % indexing is (row,col)
A(2,:)  % get the 2nd row.
        % ":" means every element along that dimension
A(:,2)  % get the 2nd col
A([1 3],:) % print all  the elements of rows 1 and 3

A(:,2) = [10; 11; 12]     % change second column
A = [A, [100; 101; 102]]; % append column vec
A(:) % Select all elements as a column vector.

% Putting data together
A = [1 2; 3 4; 5 6]
B = [11 12; 13 14; 15 16] % same dims as A
C = [A B]  % concatenating A and B matrices side by side
C = [A, B] % concatenating A and B matrices side by side
C = [A; B] % Concatenating A and B top and bottom
Conputing on Data
%% initialize variables
A = [1 2;3 4;5 6]
B = [11 12;13 14;15 16]
C = [1 1;2 2]
v = [1;2;3]

%% matrix operations
A * C  % matrix multiplication
A .* B % element-wise multiplication
% A .* C  or A * B gives error - wrong dimensions
A .^ 2 % element-wise square of each element in A
1./v   % element-wise reciprocal
log(v)  % functions like this operate element-wise on vecs or matrices
exp(v)
abs(v)

-v  % -1*v

v + ones(length(v), 1)
% v + 1  % same

A'  % matrix transpose

%% misc useful functions

% max  (or min)
a = [1 15 2 0.5]
val = max(a)
[val,ind] = max(a) % val -  maximum element of the vector a and index - index value where maximum occur
val = max(A) % if A is matrix, returns max from each column

% compare values in a matrix & find
a < 3 % checks which values in a are less than 3
find(a < 3) % gives location of elements less than 3
A = magic(3) % generates a magic matrix - not much used in ML algorithms
[r,c] = find(A>=7)  % row, column indices for values matching comparison

% sum, prod
sum(a)
prod(a)
floor(a) % or ceil(a)
max(rand(3),rand(3))
max(A,[],1) -  maximum along columns(defaults to columns - max(A,[]))
max(A,[],2) - maximum along rows
A = magic(9)
sum(A,1)
sum(A,2)
sum(sum( A .* eye(9) ))
sum(sum( A .* flipud(eye(9)) ))


% Matrix inverse (pseudo-inverse)
pinv(A)        % inv(A'*A)*A'
Plotting Data
%% plotting
t = [0:0.01:0.98];
y1 = sin(2*pi*4*t);
plot(t,y1);
y2 = cos(2*pi*4*t);
hold on;  % "hold off" to turn off
plot(t,y2,'r');
xlabel('time');
ylabel('value');
legend('sin','cos');
title('my plot');
print -dpng 'myPlot.png'
close;           % or,  "close all" to close all figs
figure(1); plot(t, y1);
figure(2); plot(t, y2);
figure(2), clf;  % can specify the figure number
subplot(1,2,1);  % Divide plot into 1x2 grid, access 1st element
plot(t,y1);
subplot(1,2,2);  % Divide plot into 1x2 grid, access 2nd element
plot(t,y2);
axis([0.5 1 -1 1]);  % change axis scale

%% display a matrix (or image)
figure;
imagesc(magic(15)), colorbar, colormap gray;
% comma-chaining function calls.
a=1,b=2,c=3
a=1;b=2;c=3;
Control statements: for, while, if statements
v = zeros(10,1);
for i=1:10,
    v(i) = 2^i;
end;
% Can also use "break" and "continue" inside for and while loops to control execution.

i = 1;
while i <= 5,
  v(i) = 100;
  i = i+1;
end

i = 1;
while true,
  v(i) = 999;
  i = i+1;
  if i == 6,
    break;
  end;
end

if v(1)==1,
  disp('The value is one!');
elseif v(1)==2,
  disp('The value is two!');
else
  disp('The value is not one or two!');
end
Functions
function y = squareThisNumber(x)

y = x^2;
