背景
コロナで在宅勤務が続いているため、都会で手狭な家に住んでいるのが苦しくなってきました。週に数日や月に数日しか出社しないなら、通勤に片道2時間ぐらいかかる田舎で暮らすことも現実的かも。(定期代がフルに支給されない)新幹線通勤までも視野に入れれば結構遠くに住めるかも?
でもどの地域を狙うのといいのか?
しばらく前に「東工大の一限に間に合う範囲の地図を作ってみました」というのが話題になってました。
同じような地図を作ってみたいと思い、会社の最寄り駅に平日朝9時に到着するための乗車時間を地図にマッピングしてみました。
手順
- 日本全国の駅名と緯度経度を取得
- 各駅から最寄り駅までの経路を検索し所要時間を取得
- 各駅の位置と所要時間を地図にプロット
これらをできるだけオープンソースのツールか、フリーミアムのサービスの無料枠でなんとかしたい。
今回は駅情報取得について。
経路検索サービスの検討
今回一番ネックになりそうなのが経路検索のところ。hideki@鉄分多め さんの「Google Directions APIで乗り換え案内情報を取ろうとしたが。。。?」ノートを参考に検討。
Google Mapsの路線検索が使えないのは残念。
有料路線検索サービス提供業者の中で、駅すぱあと、ジョルダン、Navitimeは無料枠や無料APIの用意があるようです。
今回はユーザー登録後すぐにアクセスキーを送ってきてくれた「駅すぱあとWebサービス フリープラン」を利用することにします。
駅情報取得
Pythonを利用。外部ライブラリとしてrequestとpandasを使います。
import requests
import pandas as pd

# security tokens are defined in secret.py file
# ekispert_token = ""
from secret import ekispert_token

ekispert_endpoint = 'http://api.ekispert.jp'
eki = '/v1/json/station'

from collections import MutableMapping
def flatten(d, parent_key='', sep='_'):
    """
    flatten dictionary
    https://stackoverflow.com/questions/6027558/flatten-nested-dictionaries-compressing-keys
    """
    items = []
    for k, v in d.items():
        new_key = parent_key + sep + k if parent_key else k
        if isinstance(v, MutableMapping):
            items.extend(flatten(v, new_key, sep=sep).items())
        else:
            items.append((new_key, v))
    return dict(items)

offset = 1
# print("offset: {}".format(offset))
payload = {'key': ekispert_token,
           'offset': offset,
           'limit': 100,
           'gcs': 'wgs84'}
r = requests.get(ekispert_endpoint+eki, params=payload)
result_all = r.json()
offset += 100
n_max = int(result_all['ResultSet']['max'])
# print("Max: {}".format(n_max))

while offset <= n_max:
    #print("offset: {}".format(offset))
    payload = {'key': ekispert_token,
               'offset': offset,
               'limit': 100,
               'gcs': 'wgs84'}
    r = requests.get(ekispert_endpoint+eki, params=payload)
    result_all['ResultSet']['Point'].extend(r.json()['ResultSet']['Point'])
    offset += 100

stations_flat = [flatten(result) for result in result_all['ResultSet']['Point']]
df = pd.DataFrame(stations_flat)

df['GeoPoint_longi_d'] = df['GeoPoint_longi_d'].apply(float)
df['GeoPoint_lati_d'] = df['GeoPoint_lati_d'].apply(float)

fname = "ekispert_stations_" + result_all['ResultSet']['engineVersion'] + ".pkl"
df.to_pickle(fname)
一部補足説明
offset = 1
# print("offset: {}".format(offset))
payload = {'key': ekispert_token,
           'offset': offset,
           'limit': 100,
           'gcs': 'wgs84'}
r = requests.get(ekispert_endpoint+eki, params=payload)
result_all = r.json()
offset += 100
n_max = int(result_all['ResultSet']['max'])
# print("Max: {}".format(n_max))
とりあえず一度駅情報を100件分取得。'gcs'を'wgs84'としているのは、地図へのプロットをmapboxのサービスを利用するつもりなので。
2020年1月11日時点では全部で9,274件分のデータが存在するらしい。
while offset <= n_max:
    #print("offset: {}".format(offset))
    payload = {'key': ekispert_token,
               'offset': offset,
               'limit': 100,
               'gcs': 'wgs84'}
    r = requests.get(ekispert_endpoint+eki, params=payload)
    result_all['ResultSet']['Point'].extend(r.json()['ResultSet']['Point'])
    offset += 100
残りデータをオフセットしながら取得。駅の情報はr.json()['ResultSet']['Point']にリスト形式で存在するので、最初に取得したresult_all['ResultSet']['Point']のリストに追加(extend)していく。
stations_flat = [flatten(result) for result in result_all['ResultSet']['Point']]
駅情報は入れ子構造の辞書形式になっている。扱いづらいので、flatten関数にかけて単純な辞書形式に変換しておく。
flatten前
{'Station': {'code': '26242',
  'Name': '相生(兵庫県)',
  'Type': 'train',
  'Yomi': 'あいおい'},
 'Prefecture': {'code': '28', 'Name': '兵庫県'},
 'GeoPoint': {'longi': '134.28.26.46',
  'lati': '34.49.5.91',
  'longi_d': '134.474019',
  'lati_d': '34.818309',
  'gcs': 'wgs84'}}
flatten後
{'Station_code': '26242',
 'Station_Name': '相生(兵庫県)',
 'Station_Type': 'train',
 'Station_Yomi': 'あいおい',
 'Prefecture_code': '28',
 'Prefecture_Name': '兵庫県',
 'GeoPoint_longi': '134.28.26.46',
 'GeoPoint_lati': '34.49.5.91',
 'GeoPoint_longi_d': '134.474019',
 'GeoPoint_lati_d': '34.818309',
 'GeoPoint_gcs': 'wgs84'}
df = pd.DataFrame(stations_flat)
df['GeoPoint_longi_d'] = df['GeoPoint_longi_d'].apply(float)
df['GeoPoint_lati_d'] = df['GeoPoint_lati_d'].apply(float)
Pandas.DataFrameオブジェクトを作成し、緯度経度情報を文字列からfloatに変換。
fname = "ekispert_stations_" + result_all['ResultSet']['engineVersion'] + ".pkl"
df.to_pickle(fname)
バージョン名をつけてpickle形式で保存。
分析
せっかくなので全国の駅情報をちょっと覗いてみる。
df = pd.read_pickle("ekispert_stations_202101_02a.pkl")
先程保存したファイルからpandas.DataFrameを読み戻す。
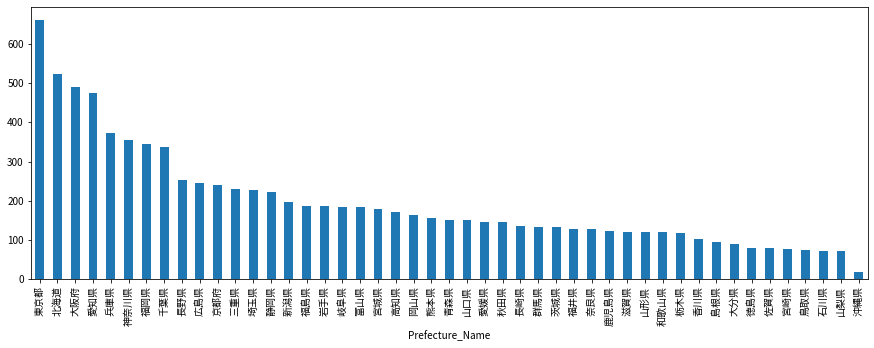
df[df['Station_Type']=='train'].groupby('Prefecture_Name').count()['Station_code'].sort_values(ascending=False).plot(kind='bar', figsize=(15,5))
鉄道の駅の数を都道府県別に並べてみた。当然東京・大阪・愛知の大都市圏が多いですね。そんな中北海道も面積が大きいからか駅数が多い。(でも人は少ないだろうから経営は大変だろうなぁ)
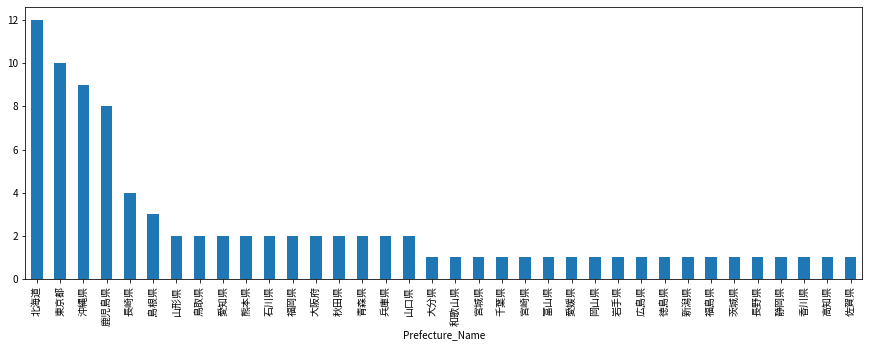
df[df['Station_Type']=='plane'].groupby('Prefecture_Name').count()['Station_code'].sort_values(ascending=False).plot(kind='bar', figsize=(15,5))
空港の数でみると、北海道が多いのは納得。東京が10個もあるのかと一瞬驚きますが、大島や三宅島なども東京都だからですね。
pt = df.groupby(['Prefecture_Name', 'Station_Type']).count()['Station_code'].unstack(fill_value=0).stack()
pt[pt==0].index
逆に空港がゼロの県はこれら。
MultiIndex([( '三重県', 'plane'),
            ( '京都府', 'plane'),
            ( '埼玉県', 'plane'),
            ( '奈良県', 'plane'),
            ( '山梨県', 'plane'),
            ( '岐阜県', 'plane'),
            ( '栃木県', 'plane'),
            ( '滋賀県', 'plane'),
            ('神奈川県', 'plane'),
            ( '福井県', 'plane'),
            ( '群馬県', 'plane')],
           names=['Prefecture_Name', 'Station_Type'])
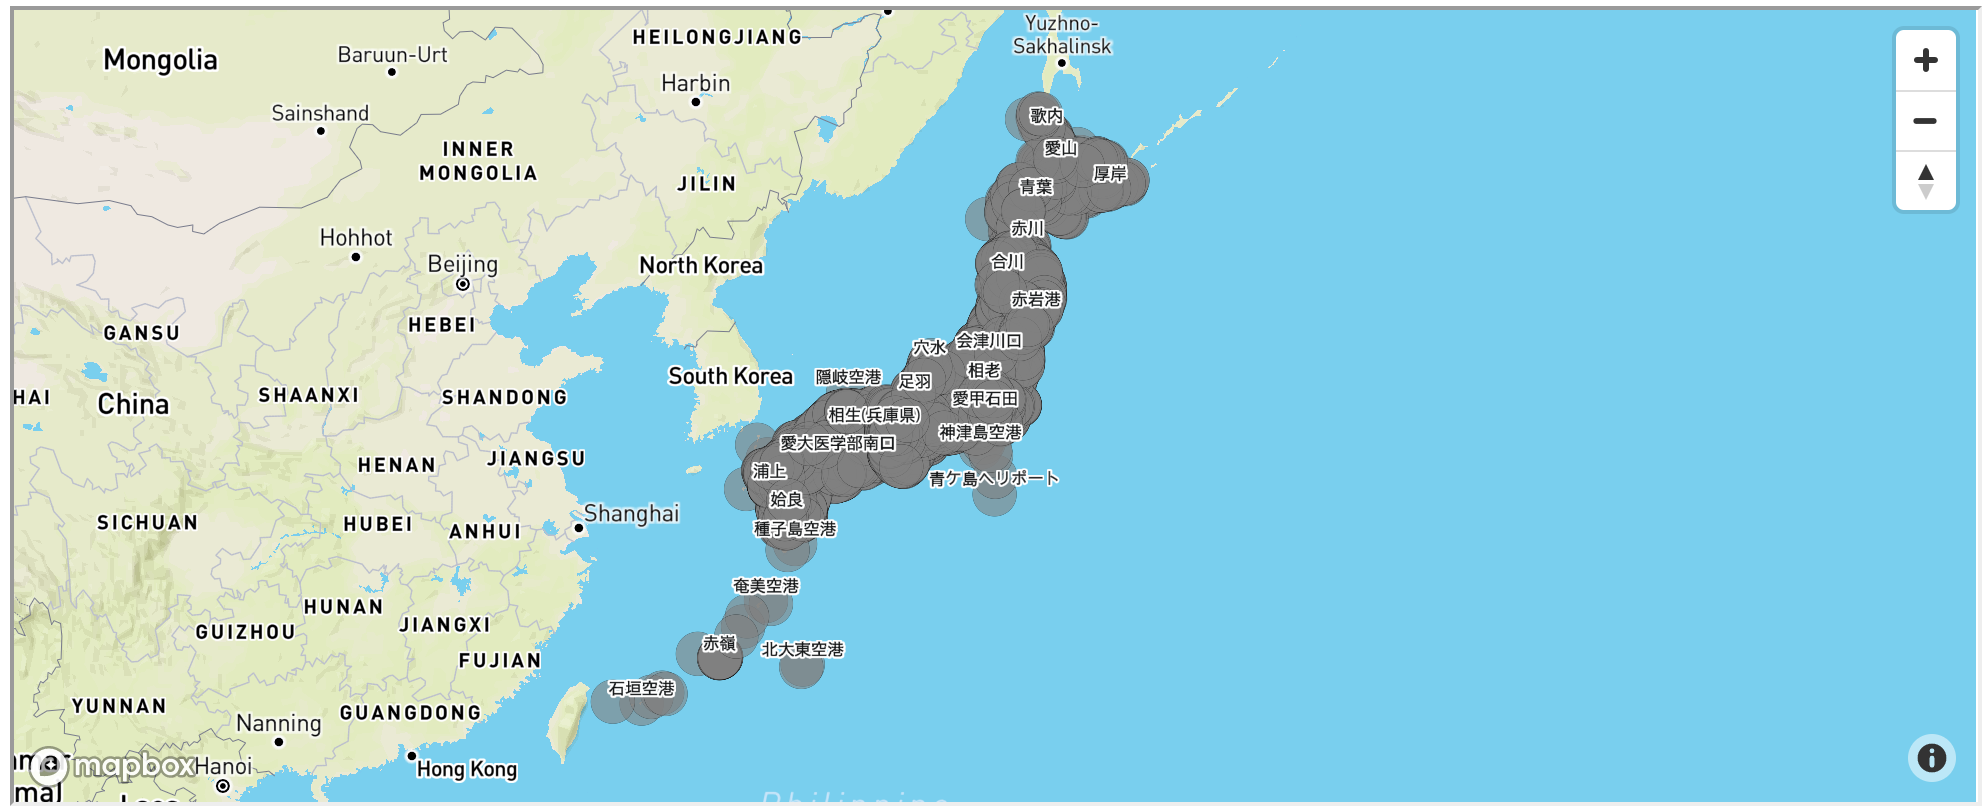
全駅をmapboxを使って地図上にプロットしてみる。
from mapboxgl.utils import df_to_geojson, create_color_stops
from mapboxgl.viz import CircleViz
# security tokens are defined in secret.py file
# mapbox_token = ""
from secret import mapbox_token
points = df_to_geojson(df,
                      properties=['Station_code', 'Station_Name', 'Station_Type', 'Station_Yomi', 'Prefecture_code', 'Prefecture_Name'],
                      lat='GeoPoint_lati_d',
                      lon='GeoPoint_longi_d',
                      precision=6)
map_center = df[df['Station_Name']=='日本橋(東京都)'].to_dict('records')[0]
viz = CircleViz(points,
                access_token=mapbox_token,
                height='400px',
                radius=10,
                stroke_color='black',
                opacity=0.6,
                label_property='Station_Name',
                center=(map_center['GeoPoint_longi_d'],map_center['GeoPoint_lati_d']),
                style='mapbox://styles/mapbox/outdoors-v11',
                zoom=3,
                )
viz.create_html("all_stations.html")
viz.show()
mapboxgl-jupyterを使うとたったこれだけのコードでぐりぐりできるマップが作れちゃいます。
こちらにHTML置いておいたのでぐりぐりしてみてください。
Powered by 駅すぱあとWebサービス


