※stackoverflowより意訳
matplotlibでグラフを書くときに各軸のスケールを揃えたいことがあると思います.2次元グラフの場合は以下のように設定すればいいです.
import matplotlib.pyplot as plt
fig = plt.figure()
ax = add_subplot(111)
ax.set_aspect('equal')
しかし,3次元プロットだとそうはいかないんです.実際にやってみましょう.
from mpl_toolkits.mplot3d import Axes3D
import matplotlib.pyplot as plt
import numpy as np

fig = plt.figure()
ax = fig.add_subplot(111,projection='3d')
ax.set_aspect('equal')

X = np.random.rand(100)*10+5
Y = np.random.rand(100)*5+2.5
Z = np.random.rand(100)*50+25

ax.scatter(X,Y,Z)
plt.show()
実行結果はこんな感じ
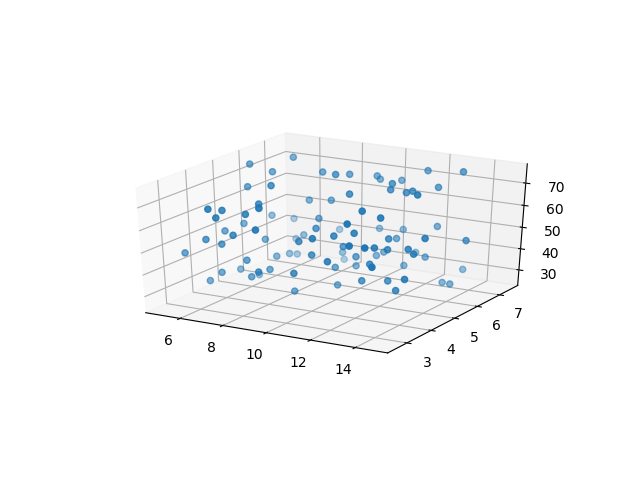
自動的にスケーリングされてしまいます.
これを避けるためには,plt.show()をする前に次のような処理を追加するといいです.
max_range = np.array([X.max()-X.min(), Y.max()-Y.min(), Z.max()-Z.min()]).max() * 0.5

mid_x = (X.max()+X.min()) * 0.5
mid_y = (Y.max()+Y.min()) * 0.5
mid_z = (Z.max()+Z.min()) * 0.5
ax.set_xlim(mid_x - max_range, mid_x + max_range)
ax.set_ylim(mid_y - max_range, mid_y + max_range)
ax.set_zlim(mid_z - max_range, mid_z + max_range)
要するに,各軸でど真ん中の値を求めた後,各軸を同じ幅で表示すればいいです.実行結果はこうなります.
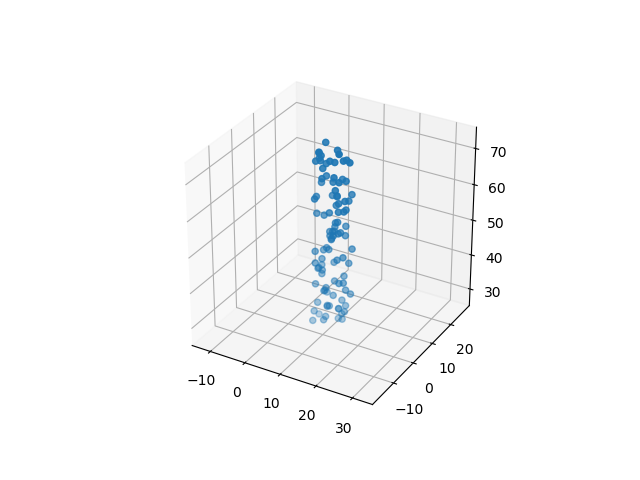
無事にできました.実行前と実行後じゃ印象が大違いですね...グラフはちゃんとスケールまで見ないとダメですね(脱線).
追記(2018年10月12日)
mid_x,mid_y,mid_zを求める式を修正しました.参照元のstackoverflowは間違えたままなのでご注意ください.
さらに追記(2019年5月24日)
mid_x,mid_y,mid_zを求める式を再修正しました.参照元のstackoverflowは正しいです.ネットに嘘を流してしまい大変申し訳ありませんでした.