import math
import numpy as np
import matplotlib.pyplot as plt

n = np.arange(5, 10, 0.1)
y = [nn*np.log(nn) for nn in n]
plt.plot(n,y,label="n*log(n)")
y = n
plt.plot(n,y,label="n")
y = [np.log(nn)**2 for nn in n]
plt.plot(n,y,label="log(n)**2")
y = n**(1/2)
plt.plot(n,y,label="n**(1/2)")
y = [np.log(nn) for nn in n]
plt.plot(n,y,label="log(n)")
plt.legend()
plt.show()

n = np.arange(1,6,1)
y = [math.factorial(nn) for nn in n]
plt.plot(n,y,label="n!")
y = 2**n
plt.plot(n,y,label="2**n")
y = n**2
plt.plot(n,y,label="n**2")
y = n*(n**(1/2))
plt.plot(n,y,label="n*(n**(1/2)")
y = [np.log(nn) for nn in n]
plt.plot(n,y,label="log(n)")
plt.legend()
plt.show()

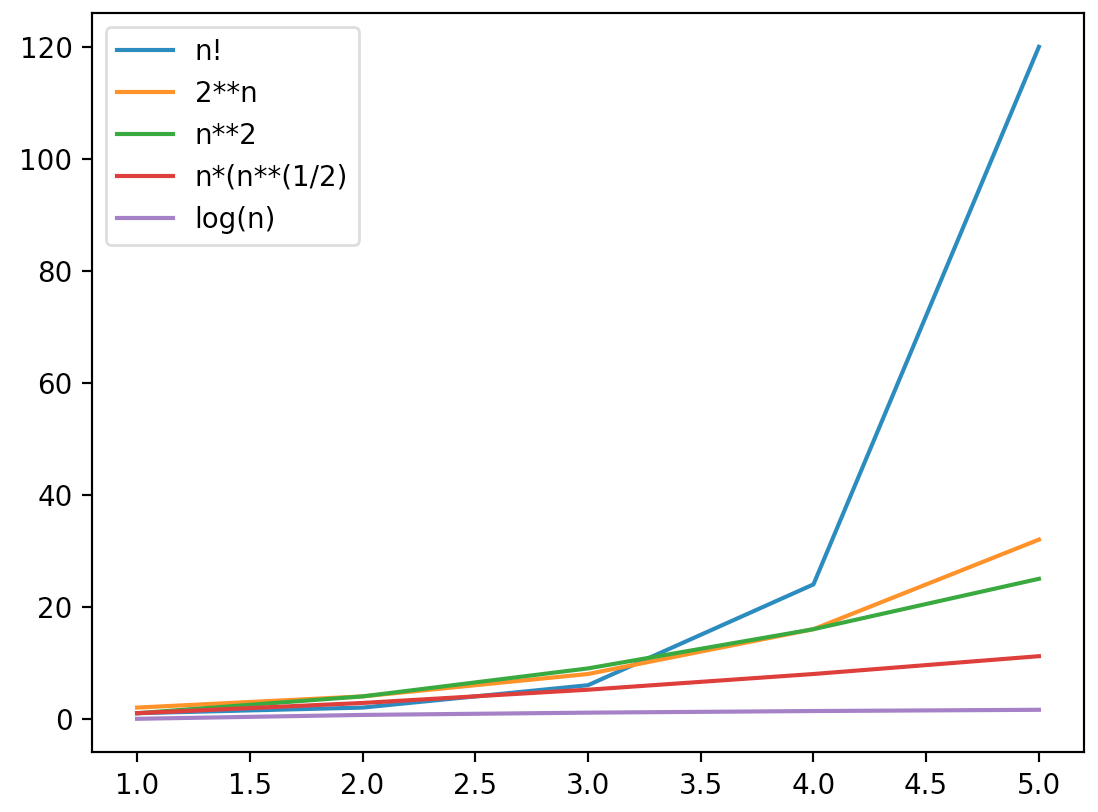
log(n) < n^(1/2) < log(n)^2 < n < n*log(n) < n*(n^(1/2)) < n^2 < 2^n < n!
# Refs.
* [matplotlib](https://qiita.com/namitop/items/31326293c92522cf11c1)
* [base of a log](https://qiita.com/shiozaki/items/eb8226c3144ab6d46b4d)
* [np.log](https://stackoverflow.com/questions/11656767/how-to-take-the-log-of-all-elements-of-a-list)
* [label](http://bicycle1885.hatenablog.com/entry/2014/02/14/023734)
* [legend](http://paper.hatenadiary.jp/entry/2017/05/02/152223#%E3%82%B0%E3%83%A9%E3%83%95%E3%81%AE%E6%9E%A0%E5%A4%96%E3%81%AB%E8%A1%A8%E7%A4%BA%E3%81%99%E3%82%8B)