import math
import numpy as np
import matplotlib.pyplot as plt
import sys
n = int(sys.argv[1])
def getp(p1,p2):
z=complex(p2[0]-p1[0],p2[1]-p1[1])
zr=complex(1/2,-3**(1/2)/2)
z=z*zr
p=[z.real+p1[0],z.imag+p1[1]]
return p
ir=10
ip1=[0,0]
ip2=[ir,0]
ip3=[ir/2,ir/2*(3**(1/2))]
def gps(n):
if n==0:
return [ip1,ip2,ip3]
else:
points=gps(n-1)
points.append(ip1)
i=0
ls=[]
#print(points)
while(1):
p1=points[i]
p2=points[i+1]
p11=[p1[0]+(p2[0]-p1[0])/3,p1[1]+(p2[1]-p1[1])/3]
p12=[p1[0]+(p2[0]-p1[0])/3*2,p1[1]+(p2[1]-p1[1])/3*2]
p=getp(p11,p12)
ls.append(p1)
ls.append(p11)
ls.append(p)
ls.append(p12)
i=i+1
if len(points)-1<i+1:
break
return ls
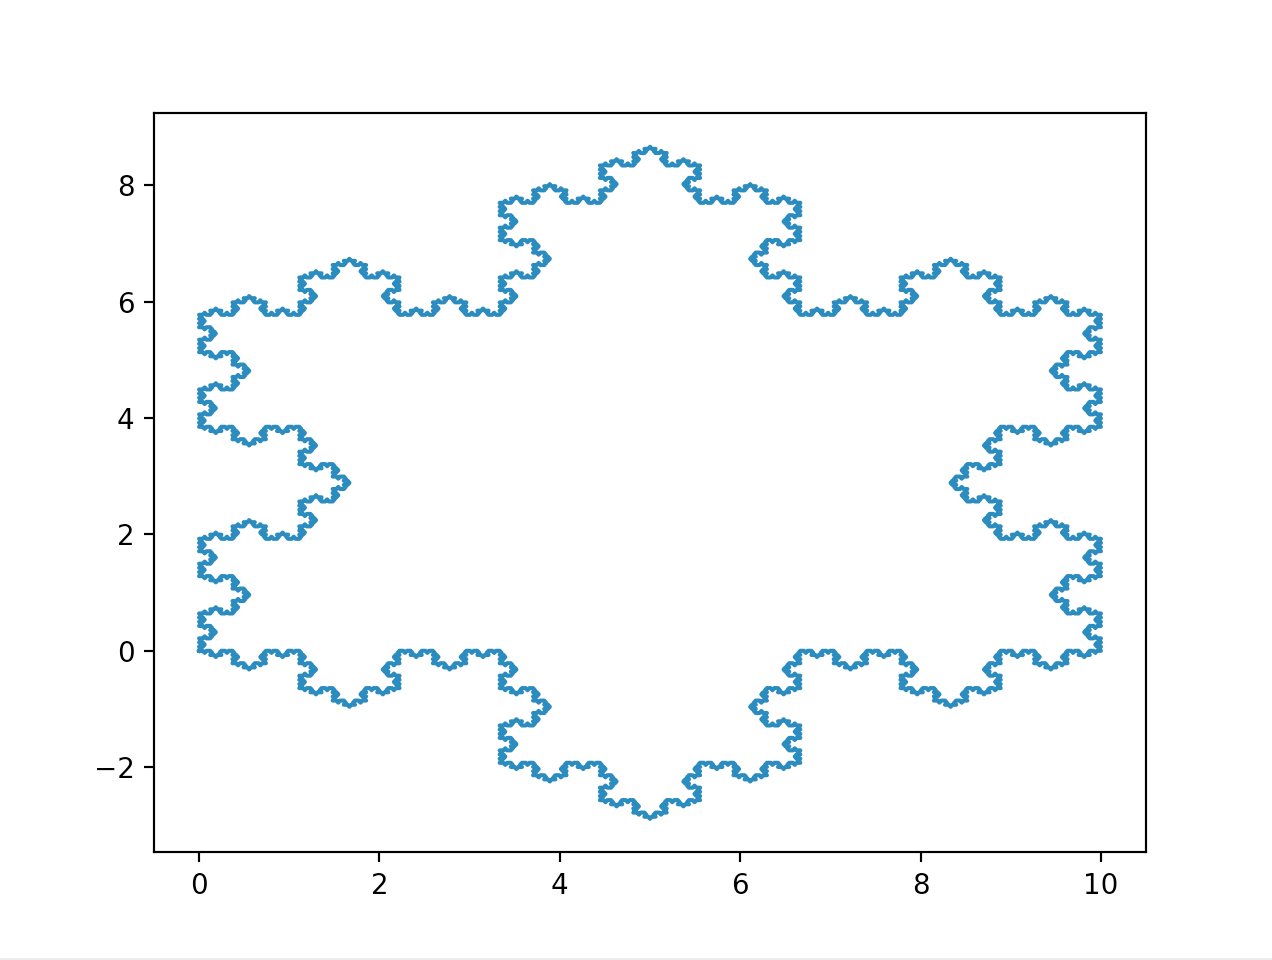
ps = gps(n)
print(ps)
ll = []
for p in ps:
ll.append(p[0])
ll.append(ps[0][0])
hl = []
for p in ps:
hl.append(p[1])
hl.append(ps[0][1])
left = np.array(ll)
height = np.array(hl)
plt.plot(left, height)
plt.show()