Rでデータ操作と言えばTidyverseですが、RでQuantsと言えばQuantmodでしたが、最近の人はtidyquantなのでしょうか?
時系列操作というジャンルではtsibbleも便利なので難しいところですね。
今回はtidyquantを使って単純なストラテジーのバックテスト例を書いてみいます。
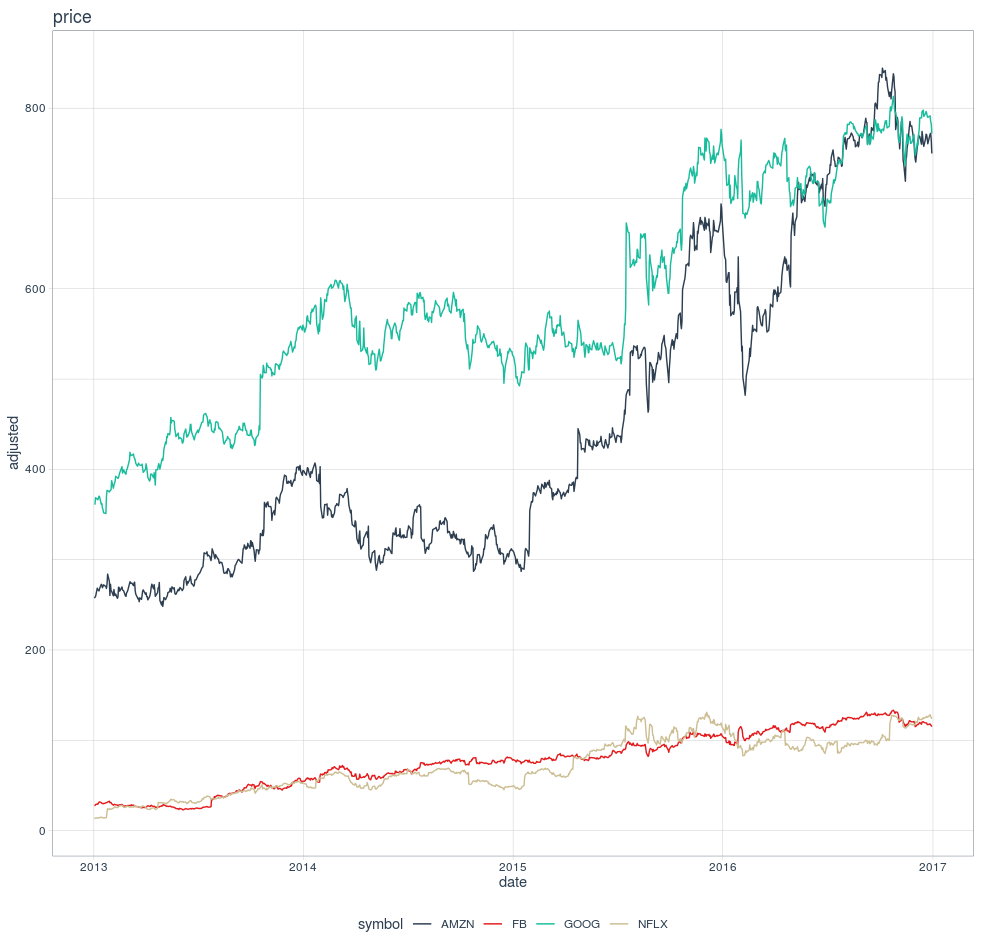
ライブラリを読み込んで組み込みデータを確認します。
require(tidyquant)
data(FANG)

FANG %>% select(symbol, date, adjusted) %>%
  ggplot(aes(x = date, y = adjusted, colour = symbol)) +
  geom_line() +
  theme_tq() +
  scale_color_tq()+
  labs(title = "price")
EMA(20)を計算します。
term1 <- FANG %>% group_by(symbol) %>%
  tq_mutate(select = adjusted,
            mutate_fun = EMA, n = 20,
            col_rename = "ema")
リターン計算に使うROCを計算します。
term2 <- term1 %>% tq_mutate(select = adjusted,
                             mutate_fun = ROC,
                             col_rename = "roc")
シグナルとリターンを計算します。シグナルの発生から発注にはラグが発生するので注意が必要です。buy next bar at market;ということです。
term3 <- term2 %>% mutate(sig = lag(if_else(adjusted > ema, 1, -1)),
                          ret = roc * sig)
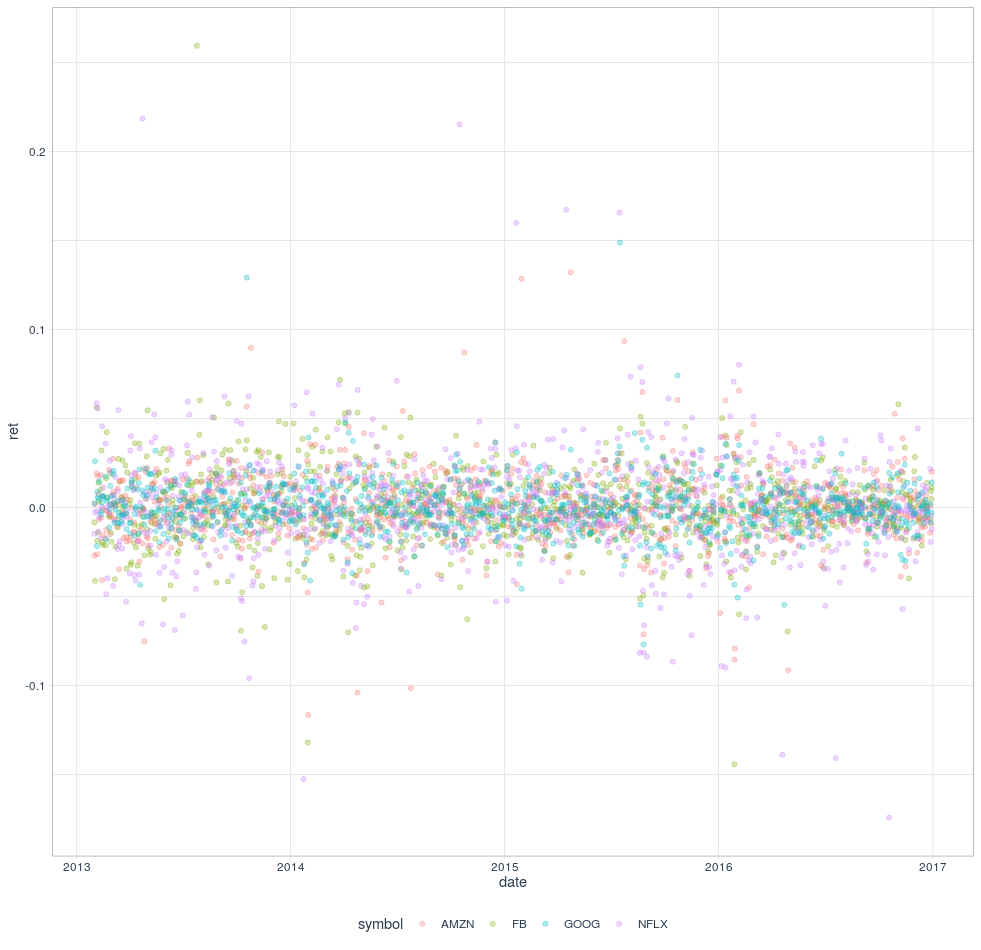
リターンの推移を確認します。
term3 %>% select(symbol, date, ret) %>% drop_na %>%
  ggplot(aes(x=date, y=ret, colour = symbol)) +
  geom_line() +
  theme_tq()
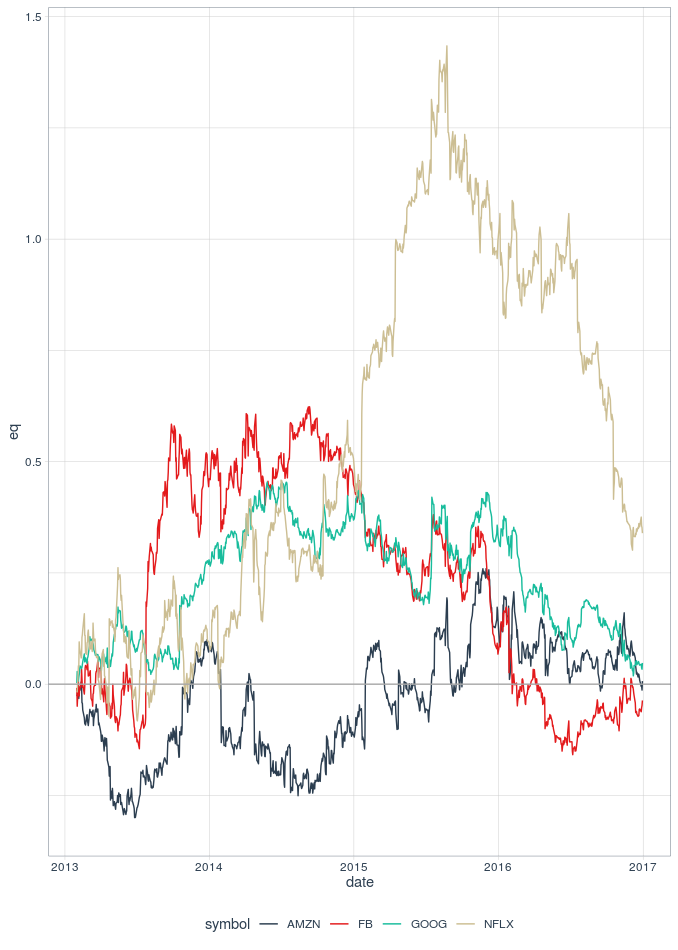
累積リターンを可視化します。
term3 %>% drop_na %>% mutate(eq = cumsum(ret)) %>%
  select(symbol, date, eq) %>%
  ggplot(aes(x = date,y = eq, colour = symbol)) +
  geom_line()+
  theme_tq()+
  scale_color_tq()+
  geom_hline(colour = "darkgray", yintercept = 0)
もっと複雑なストラテジーも簡単にテストできます。
コスト計算やポートフォリオリターンについての分析も必要です気が向いたらそれらについても記事を書きます。


