以前、部屋の温度・湿度・気圧を測定して、そのままだったので、ログの保持と表示部分を実装しようかと。(備忘録です)
https://qiita.com/_saki_kawa_/items/7961c82b150a01920d72
スプレッドシートの作成
まず、新規に記録用のスプレッドを作成。
ダミーのデータを適当に入力(シート名を「yyyymm」にしておく)

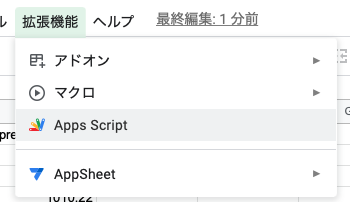
GAS関連
表示用テンプレート
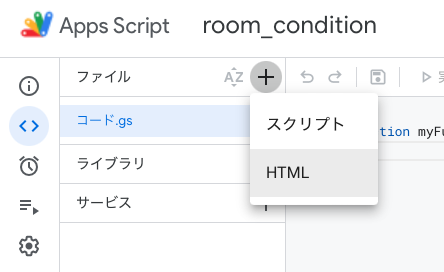
view.html
<!DOCTYPE html>
<html>
  <head>
    <base target="_top">
    <title><?= title ?></title>
    <link rel="stylesheet" href="//maxcdn.bootstrapcdn.com/bootstrap/3.3.6/css/bootstrap.min.css" />
    <link rel="stylesheet" href="//cdnjs.cloudflare.com/ajax/libs/morris.js/0.5.1/morris.css">
  </head>
  <body>
    <section class="content">
    <div class="box box-header">
      <h4><?= title ?></h4>
      <div class="form-inline">
      <form action='<?= script_url ?>'>
        <select name='year' class="form-control">
        <? getSelectYears(year).forEach(function(option) { ?>
          <option value="<?= option.value ?>" <? if (option.selected) { ?>selected="1" <?}?>><?= option.label ?></option>
        <? }); ?>
        </select>
        <select name='month' class="form-control">
          <? getSelectMonths(month).forEach(function(option) { ?>
            <option value="<?= option.value ?>" <? if (option.selected) { ?>selected="1" <?}?>><?= option.label ?></option>
          <? }); ?>
        </select>
        <button type="submit" class="btn btn-sm btn-info">検索</button>
      </form>
      </div>
    </div>
    <div class="box box-body">
      <? if (data===undefined) { ?>
      <div class="alert alert-danger" role="alert">not found</div>
      <? }else{ ?>
      <div id="chart1" class="col-md-12" style="height: 200px; margin-top: 20px;"></div>
      <div id="chart2" class="col-md-12" style="height: 200px; margin-top: 10px;"></div>
      <div id="chart3" class="col-md-12" style="height: 200px; margin-top: 10px;"></div>
      <? }?>
    </div>
  </section>

  <script src="//ajax.googleapis.com/ajax/libs/jquery/1.11.1/jquery.min.js"></script>
  <script src="//maxcdn.bootstrapcdn.com/bootstrap/3.3.6/js/bootstrap.min.js"></script>
  <script src="//cdnjs.cloudflare.com/ajax/libs/raphael/2.1.0/raphael-min.js"></script>
  <script src="//cdnjs.cloudflare.com/ajax/libs/morris.js/0.5.1/morris.min.js"></script>
  <script type="text/javascript">
  $(function(){
    var datalist = JSON.parse(<?= data ?>);

    new Morris.Line({
      element: 'chart1',
      data: datalist,
      xkey: 'datetime',
      ykeys: ['temp'],
      labels: ['気温'],
      lineColors: ['#ff5b57'],
      lineWidth : 2,
      pointSize : 3,
      ymax : 30,
      ymin : 10,
      smooth : true,
      hideHover : true,
    });

    new Morris.Line({
      element: 'chart2',
      data: datalist,
      xkey: 'datetime',
      ykeys: ['hum'],
      labels: ['湿度'],
      lineColors: ['#00acac'],
      lineWidth : 2,
      pointSize : 3,
      ymax : 80,
      ymin : 20,
      smooth : true,
      hideHover : true,
    });

    new Morris.Line({
      element: 'chart3',
      data: datalist,
      xkey: 'datetime',
      ykeys: ['pressure'],
      labels: ['気圧'],
      lineWidth : 2,
      pointSize : 3,
      ymax : 1030,
      ymin : 970,
      smooth : true,
      hideHover : true,
    });

  });
  </script>
  </body>
</html>
同じ要領でgasも作成する
共通処理
common.gs
function getSheetId() {
  return '作成したスプレッドシートのID';
}

function getBook() {
  var id = getSheetId();
  var spreadsheet = SpreadsheetApp.openById(id);
  spreadsheet.setSpreadsheetTimeZone('Asia/Tokyo');
  return spreadsheet;
}
ログ表示用のスクリプト
get.gs
function doGet(e) {
  let [year, month] = getNowYearMonth();

  if (e?.parameter?.year!==undefined ){
    year = e.parameter.year;
  }
  if (e?.parameter?.month!==undefined ){
    month = e.parameter.month;
  }

  const template = HtmlService.createTemplateFromFile('view');

  template.title = '状態' + year + '年' + month + '月';
  template.data = getData(year+month);
  template.year = year;
  template.month = month;
  template.script_url = ScriptApp.getService().getUrl();

  return template.evaluate();
}

function getNowYearMonth(){
  const now   = new Date();
  const year = Utilities.formatDate(now, "JST", "yyyy");
  const month = Utilities.formatDate(now, "JST", "MM");

  return [year, month];
}

function getData(sheet_name) {
  try {
    const spreadsheet = getBook();
    const sheet = spreadsheet.getSheetByName(sheet_name);
    const data = sheet.getDataRange().getValues();

    const json = toJson(data);
    return json;

  } catch (e) {
    Logger.log(e);
    return undefined;
  }
}

function toJson(data) {
  const json = [];

  for (let i = 1; i < data.length; i++) {
    const item={};
    const dateString = Utilities.formatDate(new Date(data[i][0]) , 'Asia/Tokyo' , 'yyyy-MM-dd HH:mm:ss');
    item[data[0][0]] = dateString;
    item[data[0][1]] = data[i][1];
    item[data[0][2]] = data[i][2];
    item[data[0][3]] = data[i][3];

    json.push(item);
  }
  return JSON.stringify(json);
}

function getSelectYears(year) {
  const now = new Date();
  var max_year  = now.getFullYear();
  var options = [];
  for (let i=2023; i<=max_year; i++){
    const item = {
      value: i,
      label: i+'年',
      selected: i==year
    };
    options.push(item);
  }
  return options;
}

function getSelectMonths(month) {
  const options = [];
  for (let i=1; i<=12; i++){
    const item = {
      value: String(i).padStart(2, '0'),
      label: i+'月',
      selected: i==month
    };
    options.push(item);
  }
  return options;
}
ログ記録用のスクリプト
post.gs
function doPost(e) {
  var res = {status: 200, message: 'success'};
  try {
    const json = JSON.parse(e.postData.getDataAsString());
    setData(json);
  } catch(e) {
    Logger.log(e);
    res['status'] = 500;
    res['message'] = ex;
  }
  const data = JSON.stringify(res);
  return ContentService.createTextOutput(data).setMimeType(ContentService.MimeType.JSON);
}

function setData(params) {
  const spreadsheet = getBook();

  for (let key in params) {
    const sheet = getSheet(spreadsheet, params[key].datetime);

    if (!findKey(sheet, params[key].datetime)){
      const row = [params[key].datetime,params[key].temp,params[key].hum,params[key].pressure];
      sheet.appendRow(row);
    }
  }
}

function getSheet(spreadsheet, d){
  const date = d.split('-');
  const sheet_name = date[0]+date[1]
  const sheet = spreadsheet.getSheetByName(sheet_name);
  if (sheet===null){
    sheet = spreadsheet.insertSheet(sheet_name);
    sheet.appendRow(['datetime','temp','hum','pressure']);
  }
  return sheet;
}

function findKey(sheet, key){
  const lastRow=sheet.getDataRange().getLastRow(); //対象となるシートの最終行を取得

  const kd = toDate(key);

  for(let i=2; i<=lastRow; i++){
    const dd = new Date(sheet.getRange(i,1).getValue());

    if(dd.getTime() === kd.getTime()){
      return true;
    }
  }
  return false;
}

function toDate (str) {
  const dt = str.split(' ')
  const dd = dt[0].split('-')
  const tt = dt[1].split(':')
  return new Date(dd[0], dd[1] - 1, dd[2], tt[0], tt[1], tt[2]);
}
権限周り
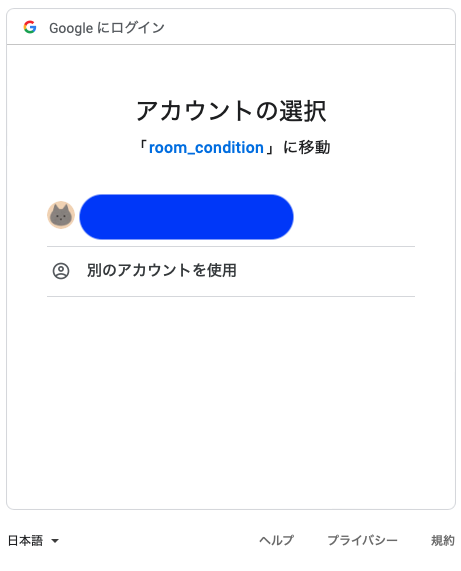
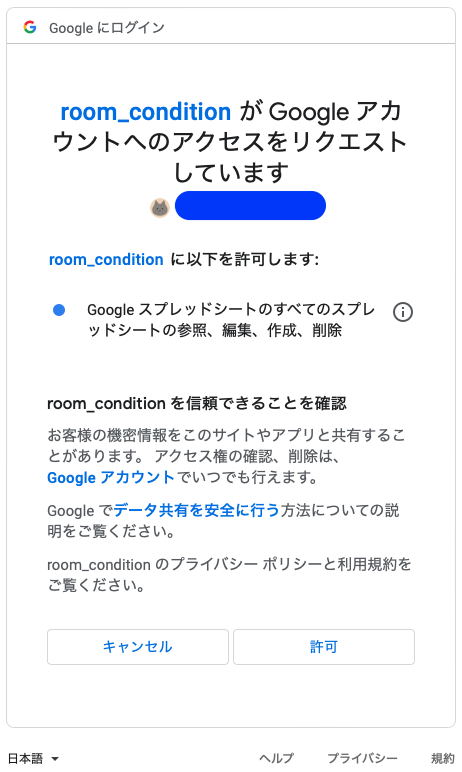
テストでスプレッドシートにアクセスしようとすると、アクセス権を聞かれます。
「権限を確認」を押して

これで、エラーはなくなるはずです。
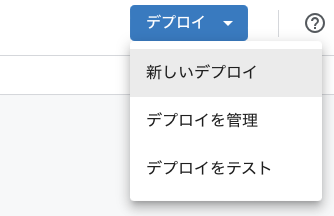
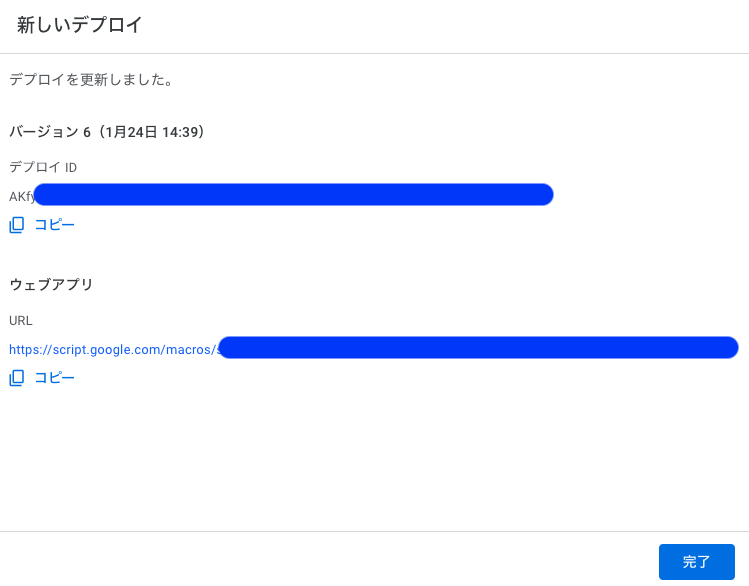
デプロイ
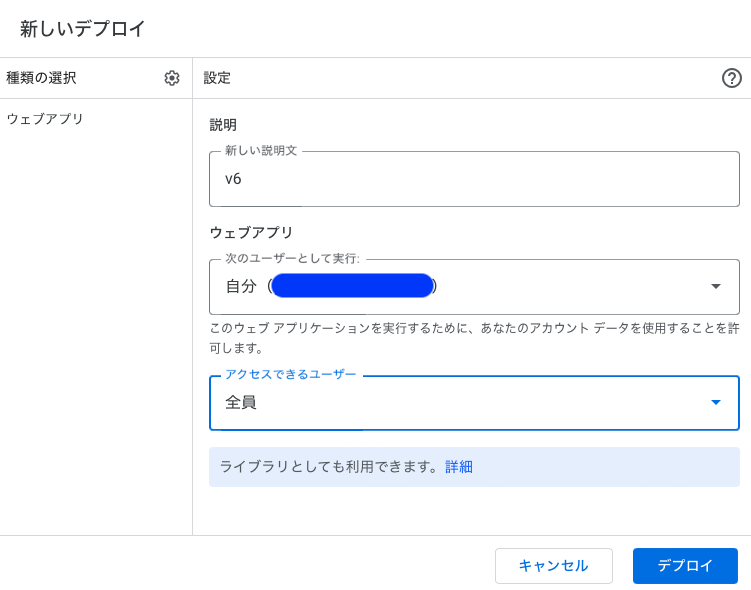
説明は、適当な文字列を
アクセスできるユーザーを「全員」に(pythonからアクセスさせるので)
webアクセス
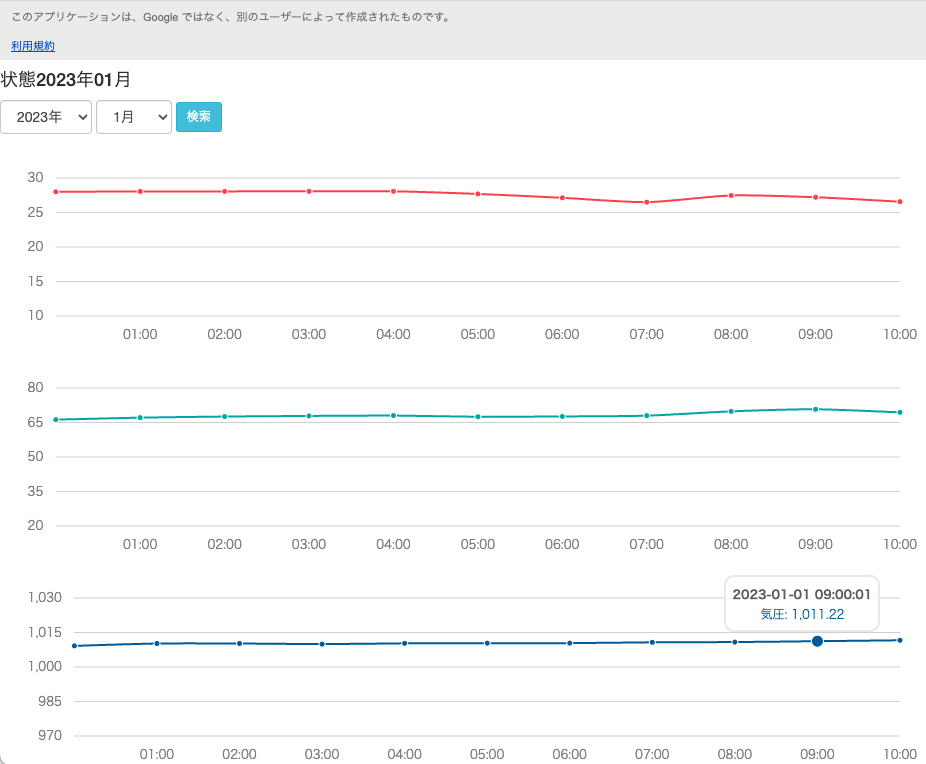
ウェブアプリのurlをコピーして、chromeでアクセスするとグラフが表示されます。
(何故かsafariでは表示できない)
python
スプレッドシートに記録
あとは、pythonからのpostです。
csvを読み込んで、gasにpostします。
postに成功した場合、csvを削除するようにしています。
post.py
import requests
import csv
import json
import os


def csv2json():

    result = []
    field = ("datetime", "temp", "hum", "pressure")

    with open("rest.log") as f:
        for line in csv.DictReader(f, field, delimiter="\t"):
            result.append(line)
    return json.dumps(result)


def main():

    json_data = csv2json()

    print(json_data)

    url = "ウェブアプリのurl"
    result = requests.post(url, json_data, headers={"Content-Type": "application/json"})

    print(result.status_code)

    if result.status_code == 200:
        json_result = json.loads(result.text)
        print(json_result)
        if json_result["status"] == 200:
            # ファイル削除
            os.remove("rest.log")

if __name__ == "__main__":
    main()
csvの形式は、タブ区切りにしています。
rest.log
2023-01-03 16:00:02	22.06	61.84	1020.38
2023-01-03 17:00:01	21.91	58.83	1020.72
2023-01-03 18:00:01	22.35	47.03	1021.18
2023-01-03 19:00:01	21.27	54.75	1022.08
2023-01-03 20:00:01	20.99	48.86	1021.99
2023-01-03 21:00:01	22.16	44.52	1021.54
