初投稿です![]()
背景
機械学習を使ってなにを行いたいのかというと、予測結果を得ることではなく、予測結果をもとになんらかの意思決定を行うということである。しかしデータサイエンティストは(現状ほとんどの場合)意思決定を行うポジションにはなく、意思決定は別の人間に委ねられる。
このとき、データサイエンティストには、意思決定者が予測結果を信用して意思決定できるように、予測結果が得られた根拠を示す必要がある。
In many applications of machine learning, users are asked to trust a model to help them make decisions. A doctor will certainly not operate on a patient simply because “the model said so.
Introduction to Local Interpretable Model-Agnostic Explanations (LIME)
やったこと
LIMEを使って、XGBoostとLightGBMの結果を可視化して解釈した。
LIMEとは
https://arxiv.org/abs/1602.04938
ある1つの予測結果を取り出して、別の解釈可能なモデル(線形モデルとか)で局所近似する。ここで得たモデルの偏回帰係数から、予測結果にどの特徴量がどの程度寄与しているのかを求めている。
こちらのページに書いてある説明がすごくわかりやすかったです。
使ったデータ
UCIで公開されていた茸のデータセット(茸のリング数や傘の色などの特徴から食用/非食用を分類している)を使った。
コード
実行したコードと簡単な説明をまとめます。
実行コード (GitHub)
##コードの中身
ライブラリ, データインポート
import os, sys, math
import numpy as np
import pandas as pd

import seaborn as sns
import matplotlib.pyplot as plt

from sklearn.preprocessing import OneHotEncoder
from sklearn.preprocessing import LabelEncoder
from sklearn.model_selection import train_test_split
from sklearn.metrics import accuracy_score

from plotting import plot_extension

import lightgbm as lgbm

### params

RAWDATA_DIR = "../data/raw"
RANDOM_STATE = 123

### read data
COLNAMES = [
   "edibility", "cap-shape", "cap-surface", "cap-color", "bruises", "odor",
   "gill-attachment", "gill-spacing", "gill-size", "gill-color",
   "stalk-shape", "stalk-root", "stalk-surface-above-ring",
   "stalk-surface-below-ring", "stalk-color-above-ring",
   "stalk-color-below-ring", "veil-type", "veil-color", "ring-number",
   "ring-type", "spore-print-color", "population", "habitat"
]
rawdata = pd.read_csv(os.path.join(RAWDATA_DIR,"agaricus-lepiota.data"), names=COLNAMES)
可視化
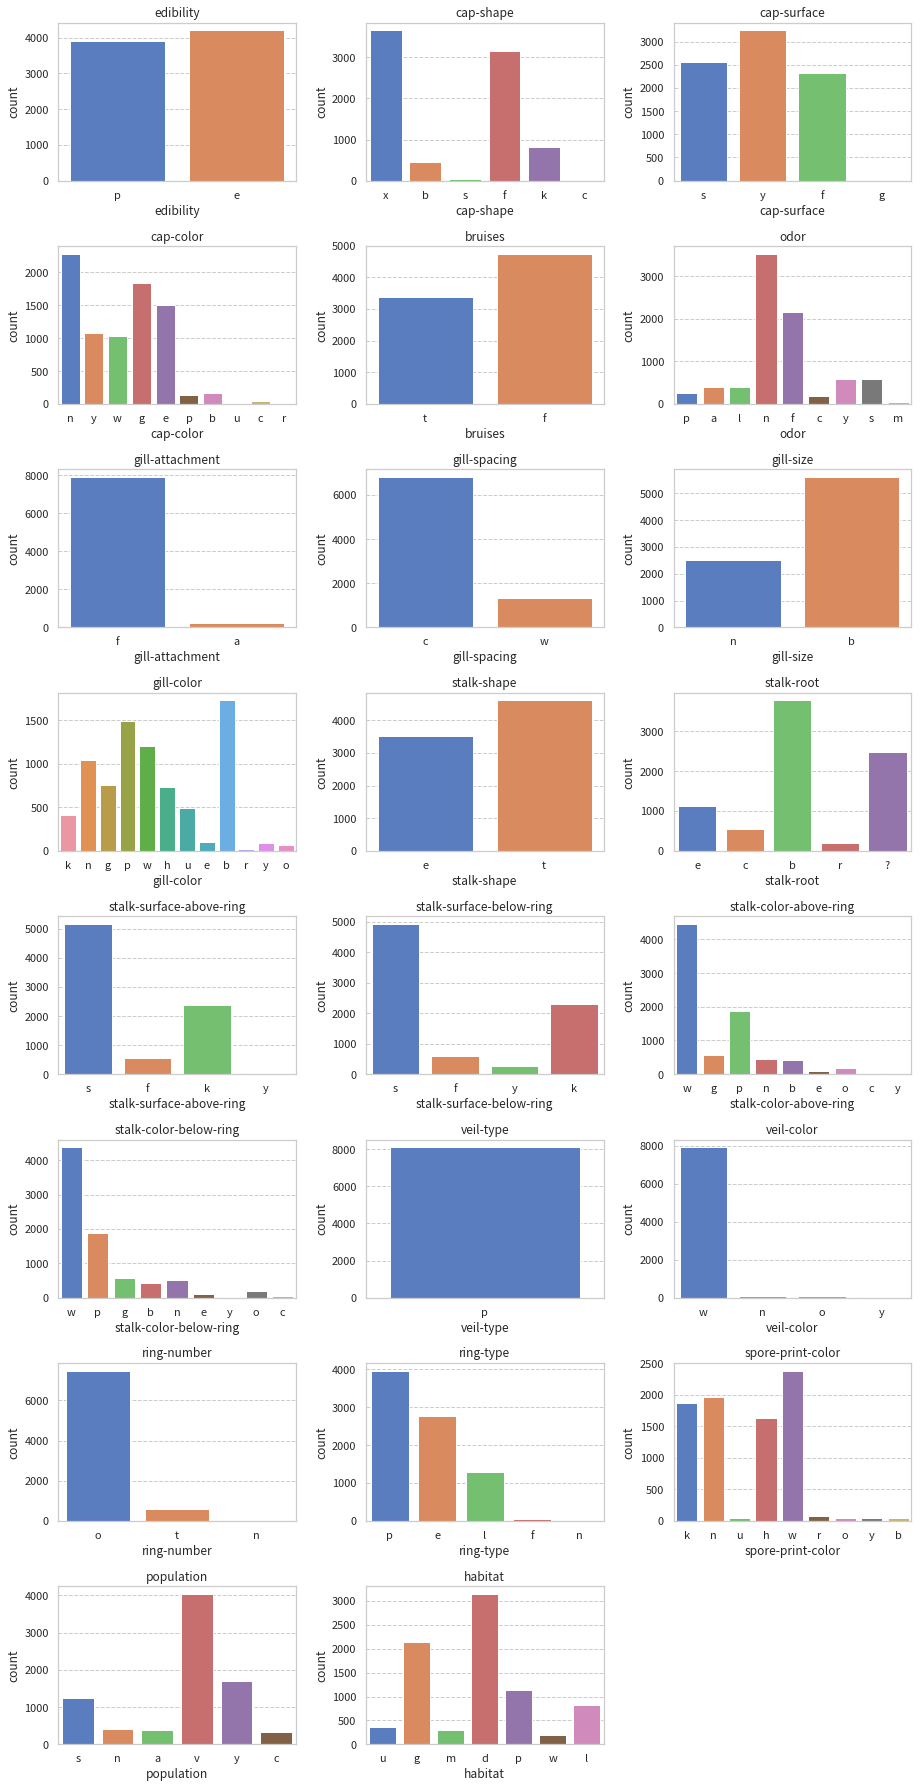
### visualize count of value each features
fig = plt.figure(figsize=(13,25))
for i, c in enumerate(rawdata.columns):
   ax = fig.add_subplot(
       math.ceil(len(rawdata.columns) / 3), 3, i + 1)
   # plot the continent on these axes
   sns.countplot(x=c, data=rawdata,  ax=ax)
   ax.set_title(c)
fig.tight_layout()
plt.show()
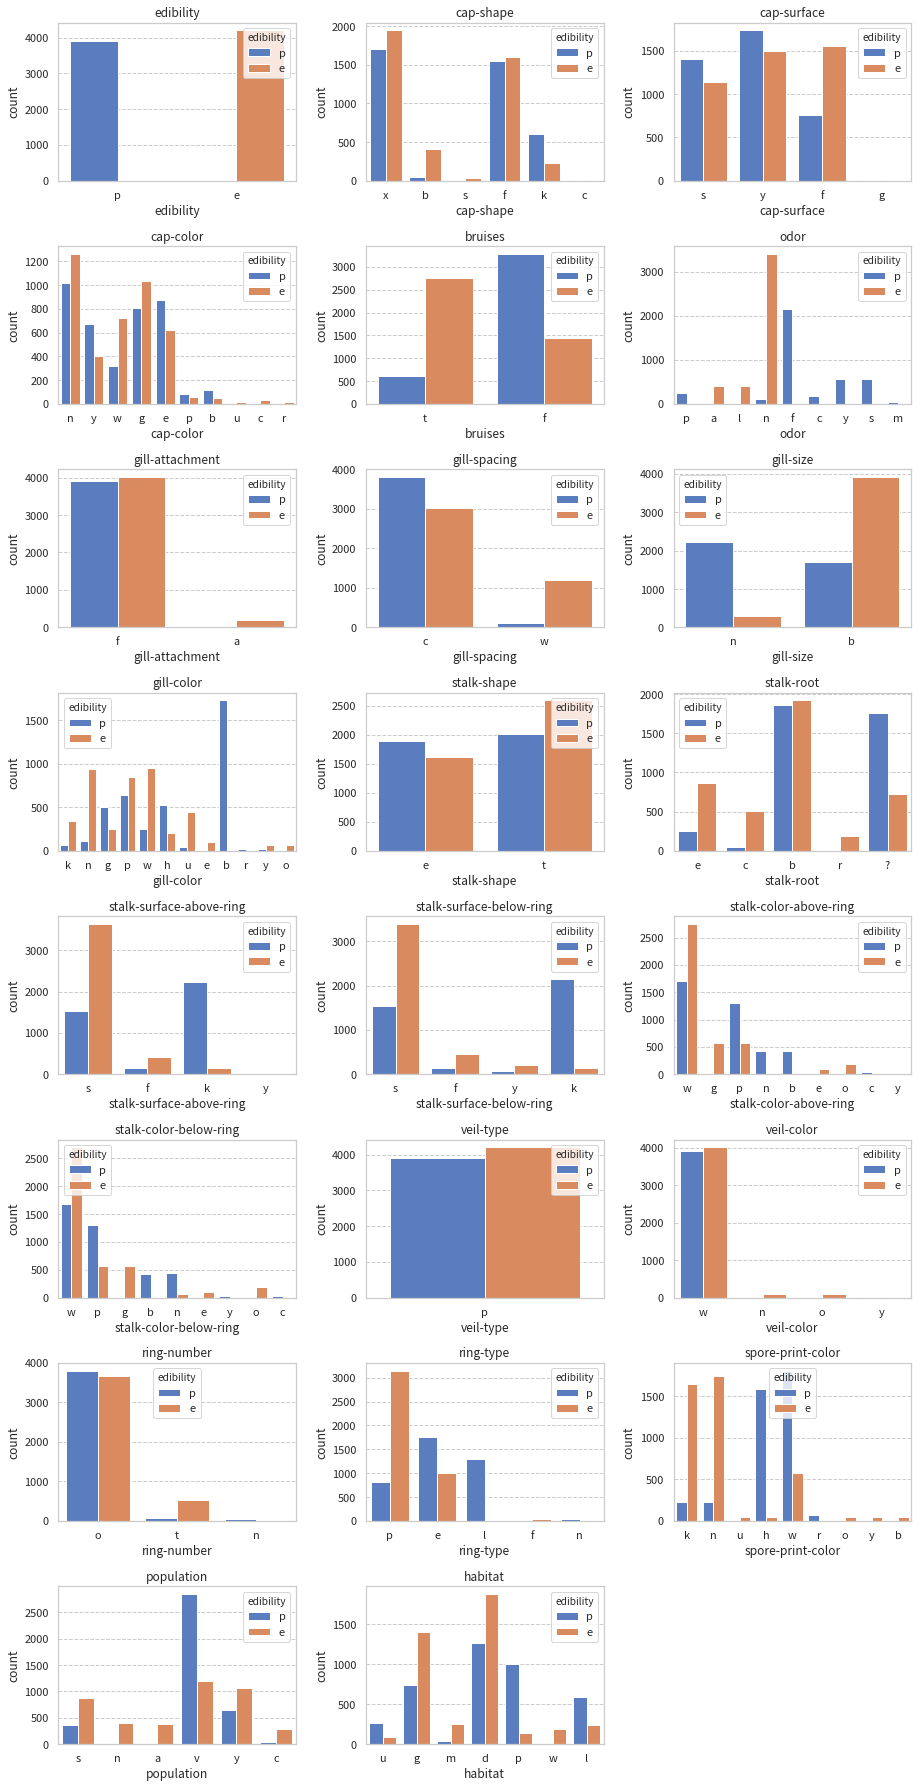
fig = plt.figure(figsize=(13,25))

for i, c in enumerate(rawdata.columns):
    ax = fig.add_subplot(
        math.ceil(len(rawdata.columns) / 3), 3, i + 1)

    # plot the continent on these axes
    sns.countplot(x=c, hue="edibility", data=rawdata, ax=ax)
    ax.set_title(c)


fig.tight_layout()
plt.show()
XGBoostで分類器を作る
X = rawdata.iloc[:, 1:]
y = rawdata.iloc[:, 0]
# train/test split
X_train, X_test, y_train, y_test = train_test_split(
   X, y, test_size=0.2, shuffle=True, random_state=RANDOM_STATE)

# label encode
mle = MultiColumnLabelEncoder()
X_train = mle.fit_transform(X_train)
X_test = mle.transform(X_test)
le = LabelEncoder()
y_train = le.fit_transform(y_train)
y_test = le.transform(y_test)

# one-hot
cat_feats = X_train.columns
X_train = pd.get_dummies(X_train, columns=cat_feats)
X_test = pd.get_dummies(X_test, columns=cat_feats)
missing_cols = set(X_train.columns) - set(X_test.columns)
for c in missing_cols:
   X_test[c] = 0
X_test = X_test[X_train.columns]

import xgboost as xgbm
from sklearn import metrics

watchlist = [(X_train.values, y_train), (X_test.values, y_test)]
xgbm_classifier = xgbm.XGBClassifier(
   objectibe='binary:logistic',
   n_estimators=10000,
   learning_rate=0.01,
   reg_lambda=0.5,
   reg_alpha=0.5,
   colsample_bytree=0.8,
   subsample=0.8,
   seed=RANDOM_STATE)
xgbm_classifier.fit(
   X_train.values,
   y_train,
   eval_metric='auc',
   early_stopping_rounds=100,
   verbose=50,
   eval_set=watchlist,
)
y_test_pred_proba = xgbm_classifier.predict_proba(
   X_test.values, ntree_limit=xgbm_classifier.best_iteration)
print('auc : {0:.6f}'.format(metrics.roc_auc_score(y_test, y_test_pred_proba[:,1])))
LIMEを使う
import lime
import lime.lime_tabular
explainer = lime.lime_tabular.LimeTabularExplainer(
   X_train.values,
   mode='classification',
   feature_names=X_train.columns,
   class_names=["edible", "poisonous"],
   verbose=True
   )
i = 15
exp = explainer.explain_instance(X_test.values[i], xgbm_classifier.predict_proba, num_features=5)
exp.show_in_notebook(show_all=False)
print(y_test_pred_proba[i], exp.score, exp.intercept)
LightGBMの分類器を作ってLIMEを使う
dtrain = lgbm.Dataset(X_train, y_train)
dtest = lgbm.Dataset(X_test, y_test, reference=dtrain)
params = {
        'objective': 'binary',
        'metric': 'auc',
        'learning_rate': 0.01,
        'reg_lambda': 0.5,
        'reg_alpha': 0.5,
        'colsample_bytree': 0.8,
        'subsample': 0.8,
        'seed': RANDOM_STATE
        }
lgbm_classifier = lgbm.train(
   params,
   dtrain,
   valid_sets=dtest,
   num_boost_round=10000,
   early_stopping_rounds=50,
   verbose_eval=50,
   )
y_test_pred_proba = lgbm_classifier.predict(
   X_test.values, ntree_limit=lgbm_classifier.best_iteration)
print('\nauc : {0:.6f}'.format(metrics.roc_auc_score(y_test, y_test_pred_proba)))

# LIME
def predict_fn(x):
   preds = lgbm_classifier.predict(x).reshape(-1, 1)
   p0 = 1 - preds
   return np.hstack((p0, preds))

explainer = lime.lime_tabular.LimeTabularExplainer(
    X_train.values,
    mode='classification',
    feature_names=X_train.columns,
    class_names=["edible", "poisonous"],
    verbose=True
    )
i = 15
exp = explainer.explain_instance(X_test.values[i], predict_fn, num_features=5)
exp.show_in_notebook(show_all=False)
print(y_test_pred_proba[i], exp.score, exp.intercept)
結果
図は、左から
- 近似した後の分類器の結果
- 各特徴量の重み
- 各特徴量の実際の値
となっている。
これらは同じサンプルを予測した結果だが、LIMEで近似したモデルの中身はずいぶん違う。現れる特徴量は似通っているが、重みが異なっている。いずれの結果にも特徴量odor_5が現れるが、その重みはそれぞれ0.56, 0.02となっている。また特徴量odor_2では、その重みはそれぞれ0.07, 0.01となっている。
あと表示する特徴量の数は、explain_instanceのnum_featuresオプションで指定することができて、今回は5にしている。
注意
いくつか気をつけないといけないと感じたこと。
- LightGBMはそのままのpredictメソッドが使えない。LIMEはsklearn準拠なので、二値分類の結果の場合だと(2,)の形で帰ってくると思っている。しかしLightGBMのpredictでは1dの結果しか帰ってこないので、
predict_fnメソッドを作って、explain_instance内で呼び出している。
# LIME
def predict_fn(x):
   preds = lgbm_classifier.predict(x).reshape(-1, 1)
   p0 = 1 - preds
   return np.hstack((p0, preds))
- 解釈可能なモデルに局所近似した結果はもとのモデルで得た結果とは異なる。どのくらい違いがあるかまで今回はあまりちゃんと見ていないが、実際に活用するときはこれをちゃんと見たほうがよい。
最後に
人は解釈できるもの理解できるものを受け入れやすい(と思う)ので、やはりこういう内容を説明することは結果を信頼してもらうという点でかなり有効だと思う。可視化のされ方もわかりやすい&話しやすい。
いくつか注意の必要な点はあるものの、活用したい。
結果の解釈という話で言うと、ちょうどkaggleで結果解釈に関する講座が始まった。大きなテーマはどの特徴量が重要か、ある予測結果に対して特徴量がどう寄与したか、各特徴量が全データの予測にどう寄与したか の3つで、eli5やpdpboxを使っている。excerciseもあってかなりよい。
これも実行した内容をGitHubにあげたので、そのうち気が向いたらまとめたい。
あとはじめてのQiitaは書くのがけっこう難しかった。時間がかかってしまった。
間違っているところがあったらコメントで指摘いただけると助かります。


