RadViz
RadVizは多変量データ(高次元データ)の可視化手法の1つである。$n$ 次元のレコード $(v_1, v_2, \cdots, v_n)$ をデータ点と呼ぶ。$n$ 個の次元をアンカーとして円周上に配置する。データ点と各アンカーがバネで結ばれているとし、バネの力が釣り合う座標にデータ点を配置する。それぞれの次元において、値が大きいとバネの力を強く、値が小さいとバネの力を弱くする。
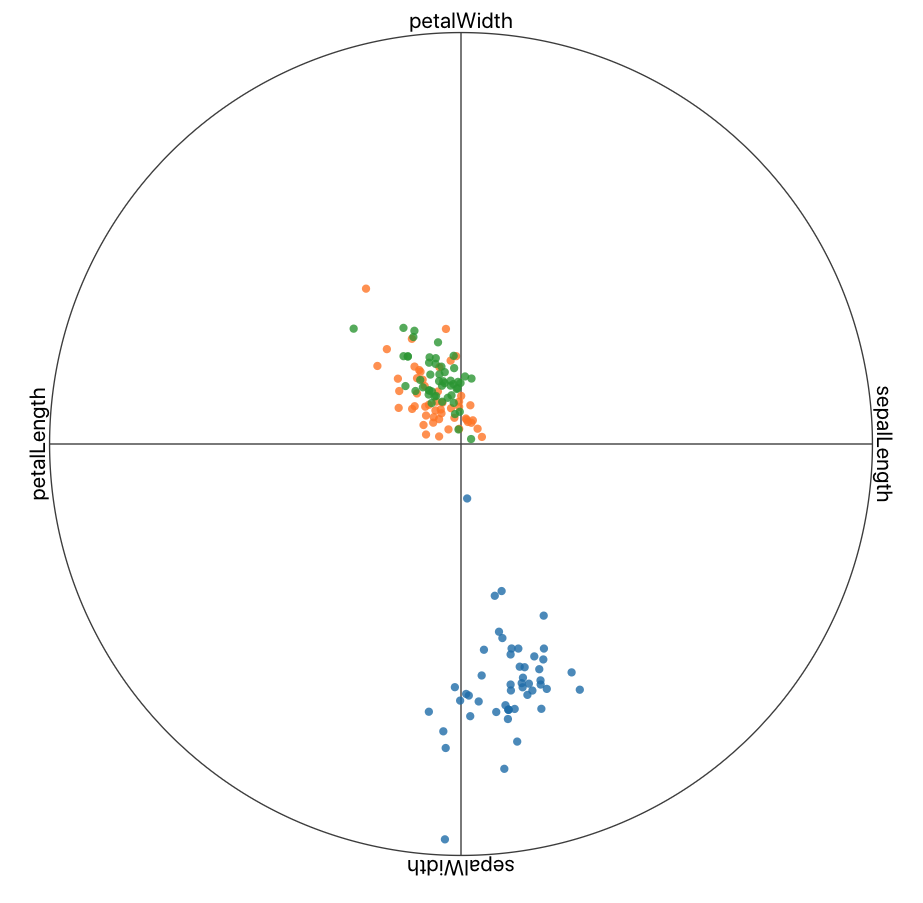
irisデータセットに適用した結果は以下の通りである。
本稿では、RadVizの座標計算方法の導出とJavaScriptでの実装を行う。
データ点の座標計算
データ点の座標 $(x_c, y_c)$ を原点からの距離 $d$ と角度 $\theta$ によって次のように表す。
x_c = d \cos \theta \\
y_c = d \sin \theta
$i$ 番目 ($i \in {1, 2, \cdots, n }$)のアンカーの座標は次のように表される。
x_i = r \cos \theta_i \\
y_i = r \sin \theta_i
円周上に等間隔にアンカーを並べる場合、$\theta_i$ は次のようになる。
\theta_i = \frac{2 \pi}{n} (i - 1)
データ点は全てのアンカーとバネで結ばれており、$i$ 番目のアンカーから伸びるバネの力の強さを $F_i$ 、データ点と $i$ 番目のアンカーのなす角度を $\phi_i$ とする。全てのバネの力が釣り合い、データ点が静止する場所において次の条件を満たす。
\sum_{i=1}^{n} F_i \cos \phi_i = 0\\
\sum_{i=1}^{n} F_i \sin \phi_i = 0
これを満たすような $d$ と $\theta$ を求めれば良い。
バネ定数を $k_i$、アンカーとデータ点の距離 $d_i$ とすると $F_i$ は次のように表される。なお、バネの自然長は0としている。
F_i = -k_i d_i
これを $x$ 成分と $y$ 成分に分解するために、 $\cos \phi_i$ と $\sin \phi_i$ を求める。
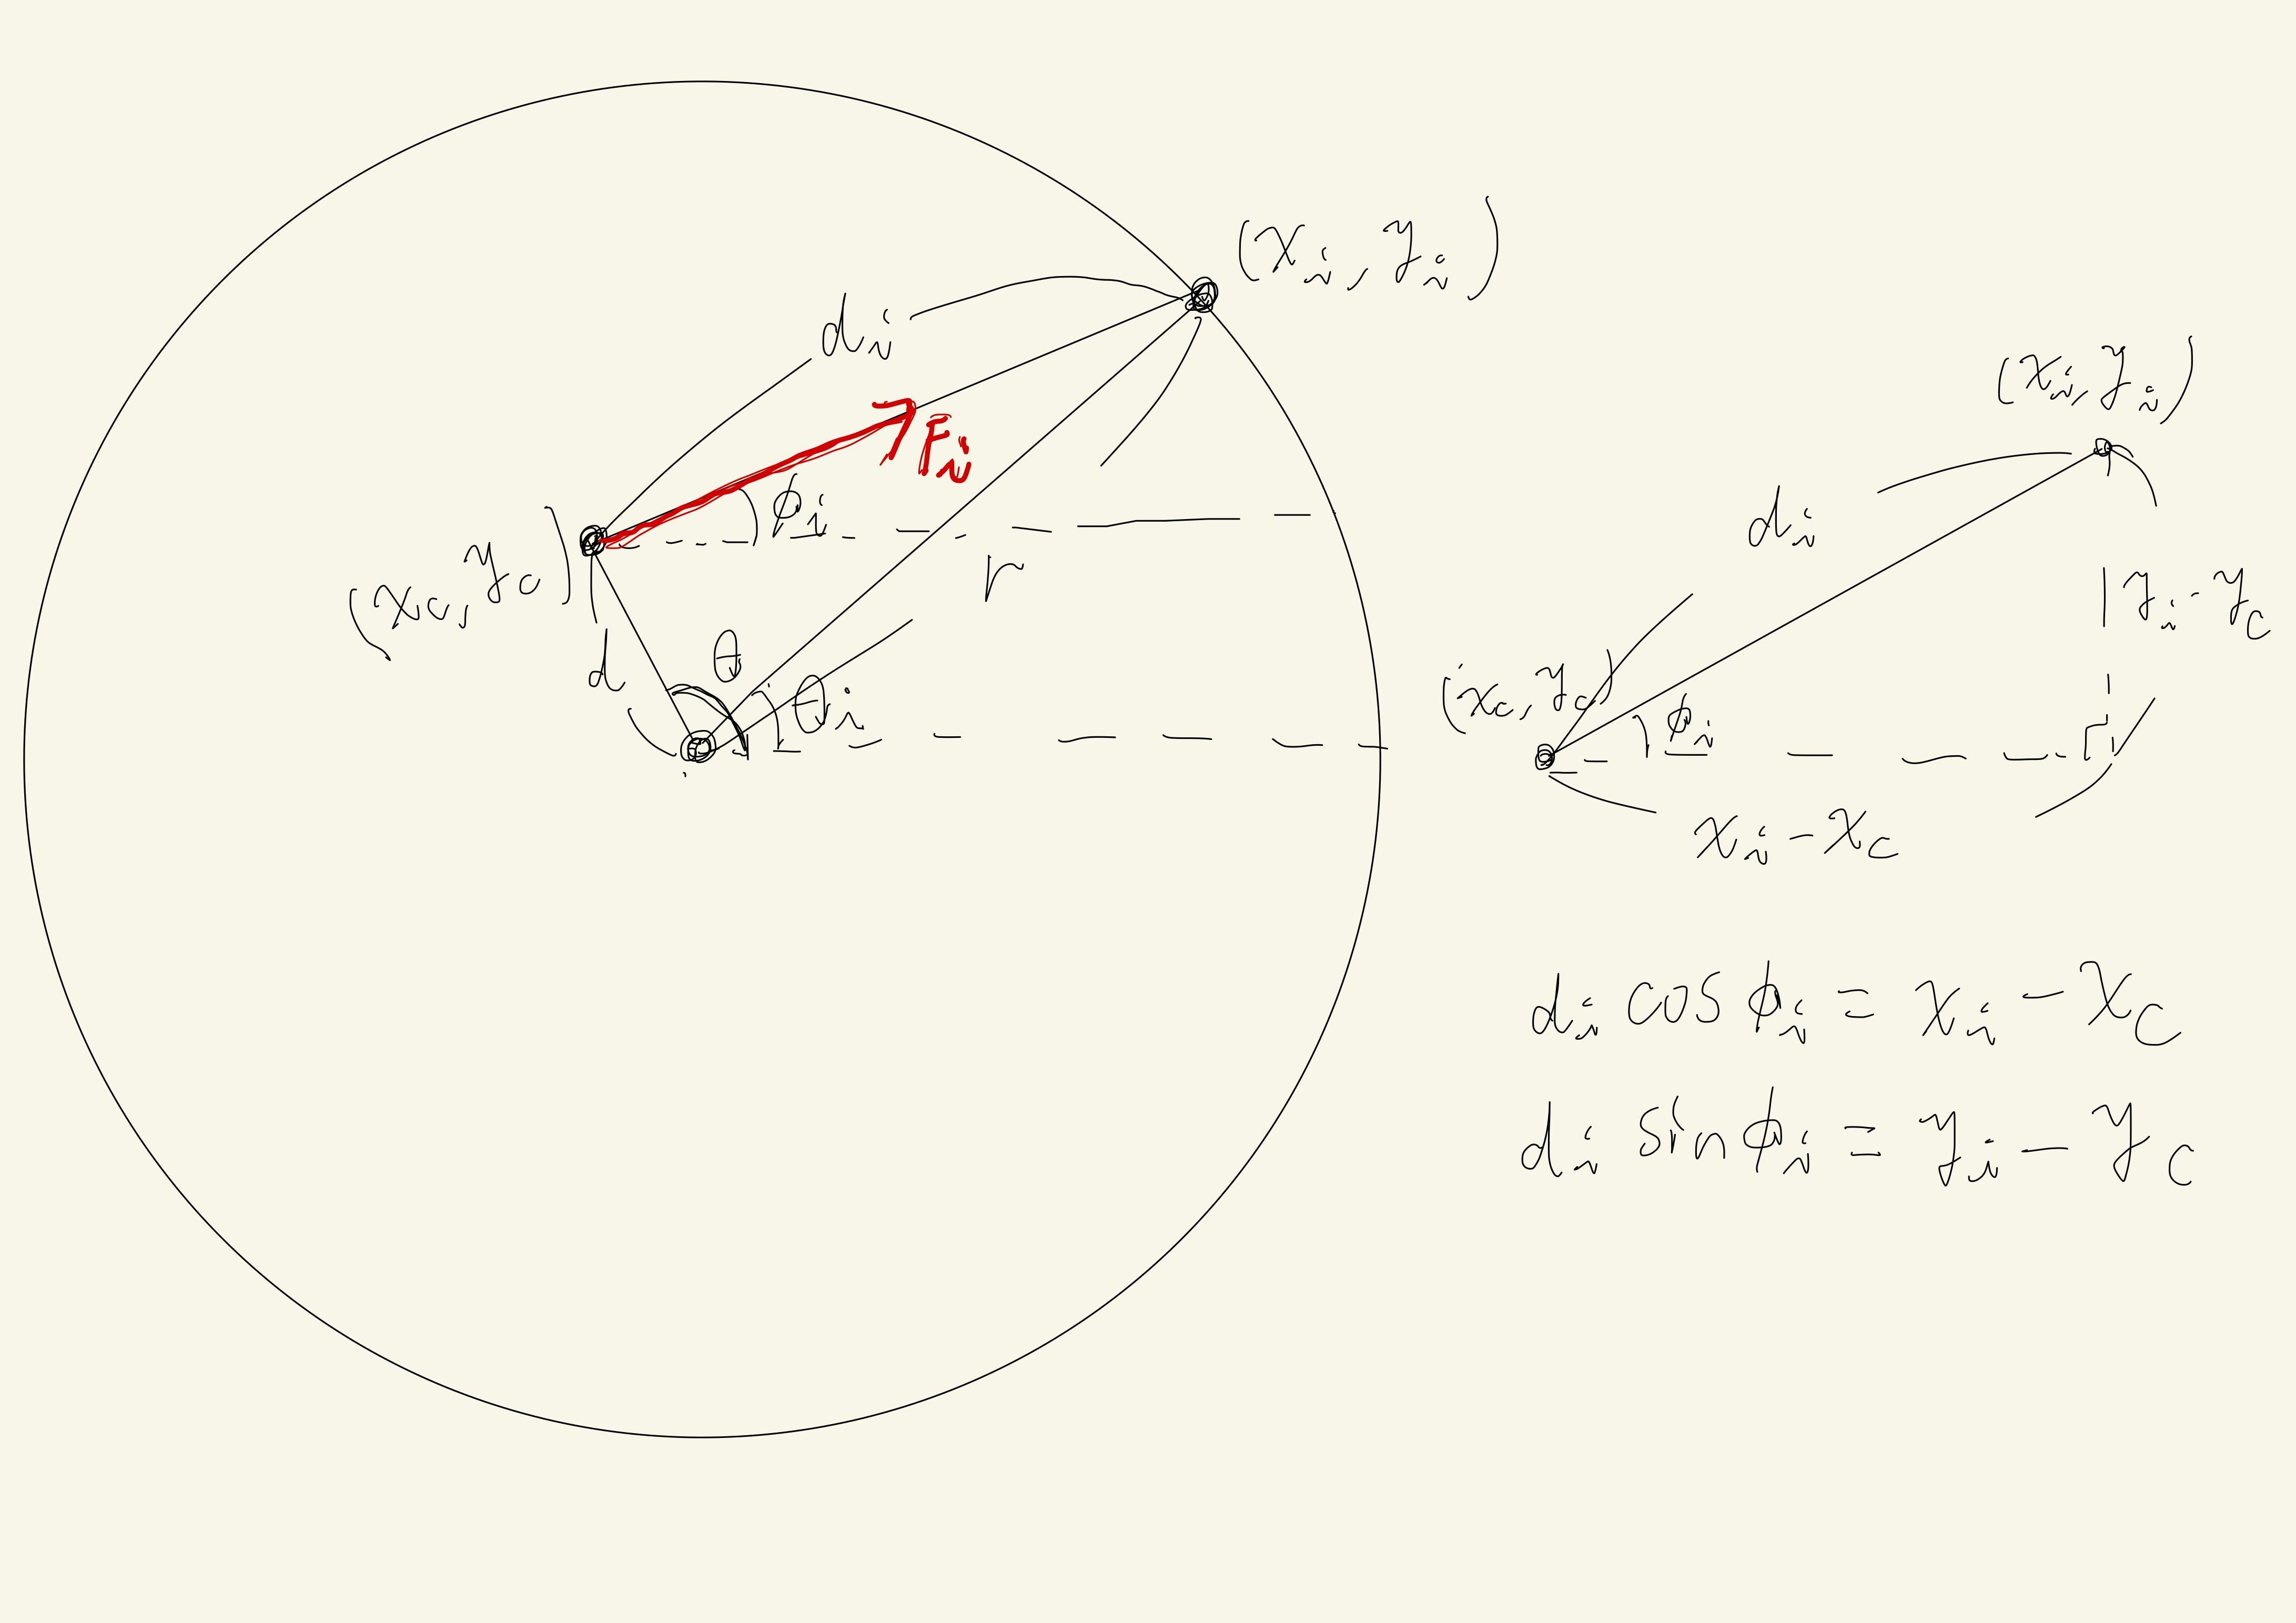
上図より、それぞれ次のようになる。
\cos \phi_i = \frac{r \cos \theta_i - d \cos \theta}{d_i} \\
\sin \phi_i = \frac{r \sin \theta_i - d \sin \theta}{d_i}
全てのバネが釣り合う条件から次式が得られる。
d \cos \theta = r \frac{\sum_{i=1}^n k_i \cos \theta_i}{\sum_{i=1}^n k_i} \\
d \sin \theta = r \frac{\sum_{i=1}^n k_i \sin \theta_i}{\sum_{i=1}^n k_i}
ここから $d$ と $\theta$ について解くと次のようになり、全てのバネの力が釣り合うデータ点の座標が求まる。
d = \sqrt{\left(r \frac{\sum_{i=1}^n k_i \cos \theta_i}{\sum_{i=1}^n k_i}\right)^2 + \left(r \frac{\sum_{i=1}^n k_i \sin \theta_i}{\sum_{i=1}^n k_i}\right)^2}\\
\theta = \tan^{-1} \frac{\sum_{i=1}^n k_i \sin \theta_i}{\sum_{i=1}^n k_i \cos \theta_i}
RadVizの実装
JavaScriptによる実装を次に示す。D3.js と React を用いている。
import React from "react";
import * as d3 from "d3";

const radviz = (data, dimensions, r) => {
  const n = dimensions.length;
  const scales = dimensions.map((property) => {
    return d3
      .scaleLinear()
      .domain(d3.extent(data, (item) => item[property]))
      .range([0, 1]);
  });
  return data.map((item, i) => {
    let a = 0;
    let b = 0;
    let c = 0;
    const dt = (2 * Math.PI) / n;
    for (let j = 0; j < n; ++j) {
      const v = scales[j](item[dimensions[j]]);
      a += v * Math.cos(dt * j);
      b += v * Math.sin(dt * j);
      c += v;
    }
    a *= r / c;
    b *= r / c;
    const d = Math.sqrt(a * a + b * b);
    const t = Math.atan2(b, a);
    return { x: d * Math.cos(t), y: d * Math.sin(t) };
  });
};

const Radviz = ({ data, dimensions }) => {
  const r = 300;
  const contentWidth = 2 * r;
  const contentHeight = 2 * r;
  const margin = 50;
  const width = contentWidth + margin * 2;
  const height = contentHeight + margin * 2;
  const lineColor = "#444";

  const color = d3.scaleOrdinal(d3.schemeCategory10);
  for (const item of data) {
    color(item.species);
  }
  const points = radviz(data, dimensions, r);

  return (
    <svg viewBox={`0 0 ${width} ${height}`}>
      <g transform={`translate(${margin + r},${margin + r})`}>
        <circle r={r} fill="none" stroke={lineColor} />
        {dimensions.map((property, i) => {
          return (
            <g
              key={i}
              transform={`rotate(${(360 / dimensions.length) * i + 90})`}
            >
              <line x1="0" y1="0" x2="0" y2={-r} stroke={lineColor} />
              <text
                y={-r}
                textAnchor="middle"
                dominantBaseline="text-after-edge"
              >
                {property}
              </text>
            </g>
          );
        })}
        {data.map((item, i) => {
          const { x, y } = points[i];
          return (
            <g key={i} transform={`translate(${x},${y})`}>
              <circle r="3" fill={color(item.species)} opacity="0.8">
                <title>{dimensions.map((p) => item[p]).join(",")}</title>
              </circle>
            </g>
          );
        })}
      </g>
    </svg>
  );
};
動作しているデモを以下に掲載する。
https://reactd3.vdslab.jp/radviz
TODO
RadVizはアンカーの配置順によって可視化結果が異なる。最適なアンカー配置順の決定については実装していない。
参考文献
- Hoffman, Patrick, Georges Grinstein, and David Pinkney. "Dimensional anchors: a graphic primitive for multidimensional multivariate information visualizations." Proceedings of the 1999 workshop on new paradigms in information visualization and manipulation in conjunction with the eighth ACM internation conference on Information and knowledge management. 1999.
- Grinstein, Georges, Marjan Trutschl, and Urška Cvek. "High-dimensional visualizations." Proceedings of the Visual Data Mining Workshop, KDD. Vol. 2. 2001.
- Gee, Alexander G., Min Yu, and G. G. Grinstein. Dynamic and interactive dimensional anchors for spring-based visualizations. Technical report, computer science, University of Massachussetts Lowell, 2005.