5
8

Delete article

Deleted articles cannot be recovered.

Draft of this article would be also deleted.

Are you sure you want to delete this article?

More than 5 years have passed since last update.

2次元Kernel密度推定

Posted at

#2次元Kernel密度推定:kde2d( )

##データの作成と可視化
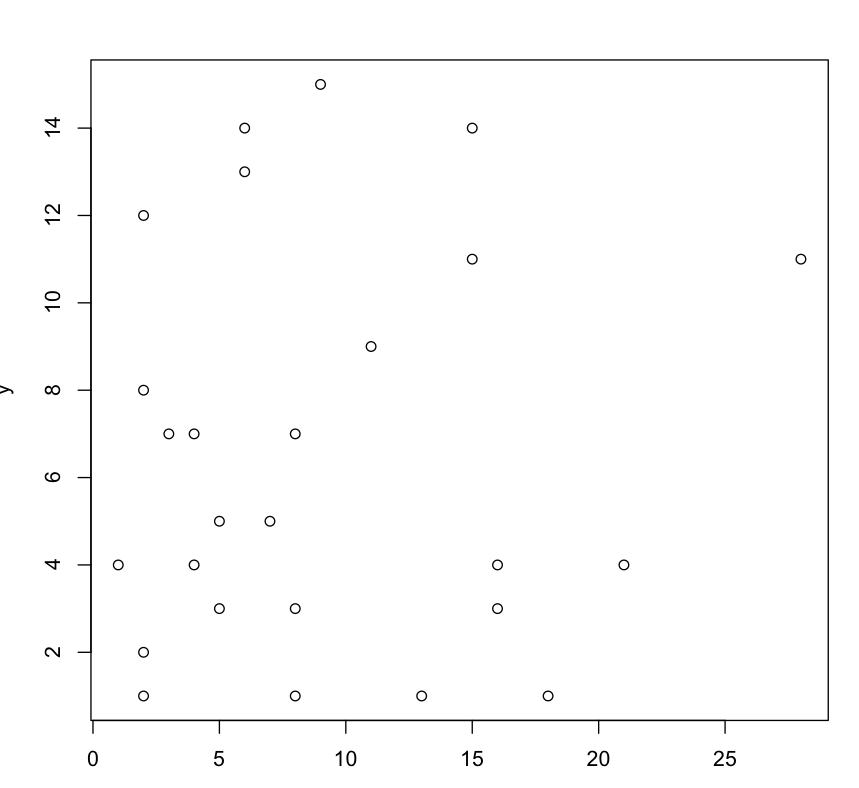
2次元標本データを手作業で作成します。気持ちとしては犯罪が起こった場所のx,y座標を取得しているつもりです。

> x <- c(1,2,2,2,2,3,4,4,5,5,6,6,7,8,8,8,9,11,13,15,15,16,16,18,21,28)
> y <- c(4,1,2,8,12,7,4,7,3,5,13,14,5,1,3,7,15,9,1,11,14,3,4,1,4,11)
> plot(x,y)

スクリーンショット 2015-11-19 1.06.50.png

##2次元Kernel密度推定の実行
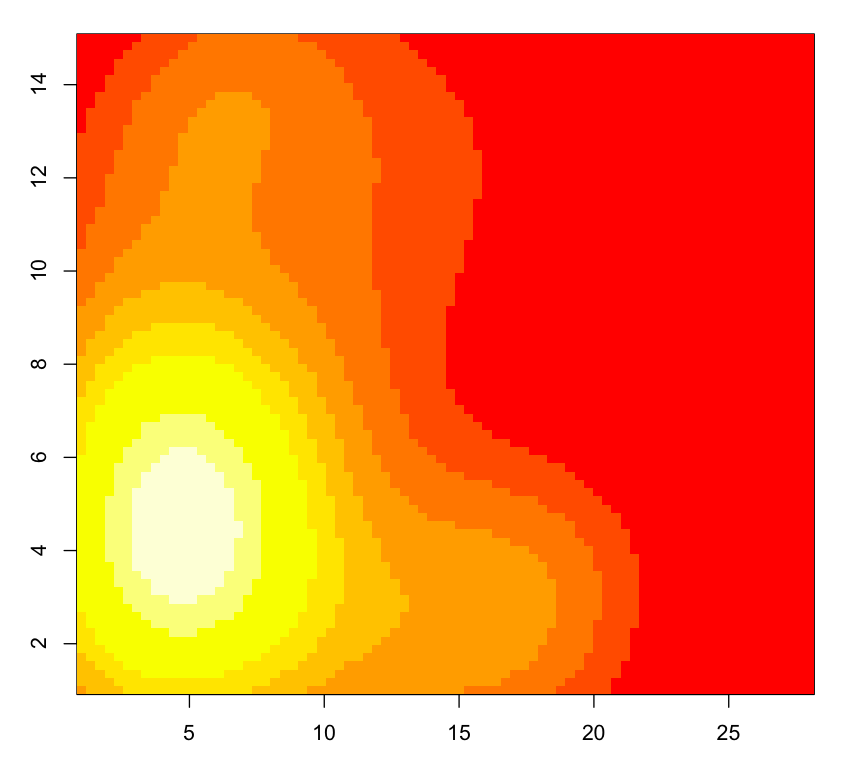
MASSライブラリのkde2d関数を実行して密度推定を行います。バンド幅は良いものを探さないといけないが、今回はそれを補助するバンド幅決定関数:bandwidth.nrdを使用します。

> d = kde2d(x,y,c(bandwidth.nrd(x), bandwidth.nrd(y)),n=80)
> image(d)

スクリーンショット 2015-11-19 1.09.38.png

##おまけ

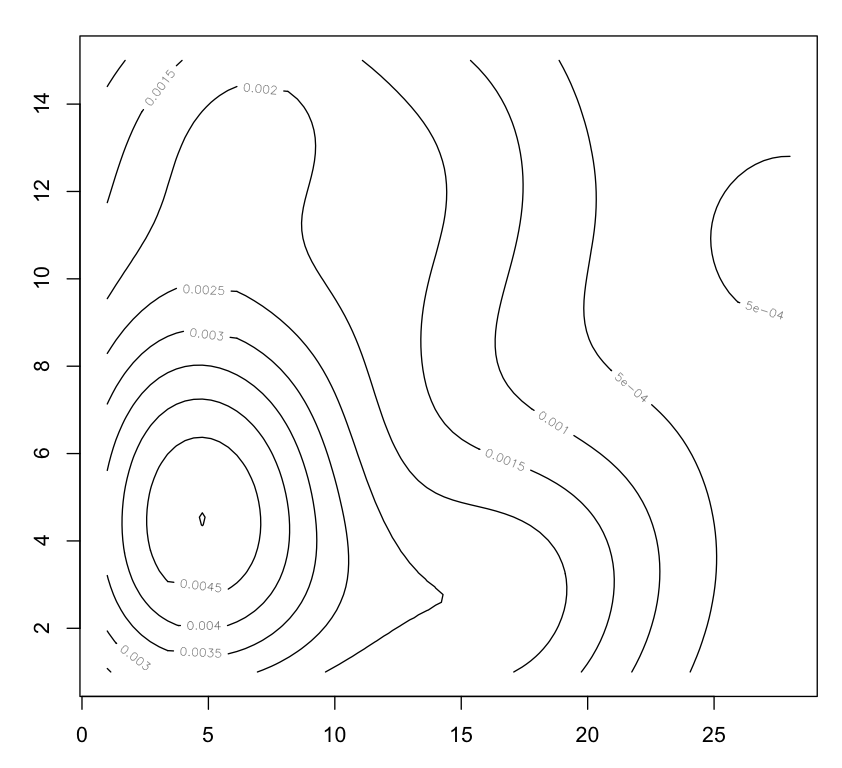
contour関数を使えば等高線が書けます。
max関数を使えば最大密度の値が求まります。

contour(d)
> max(d$z)
[1] 0.005004014

スクリーンショット 2015-11-19 1.10.00.png

[参照 http://bio-info.biz/tips/r_kde2d.html ]
5
8
0

Register as a new user and use Qiita more conveniently

  1. You get articles that match your needs
  2. You can efficiently read back useful information
  3. You can use dark theme
What you can do with signing up
5
8

Delete article

Deleted articles cannot be recovered.

Draft of this article would be also deleted.

Are you sure you want to delete this article?