■ 概要
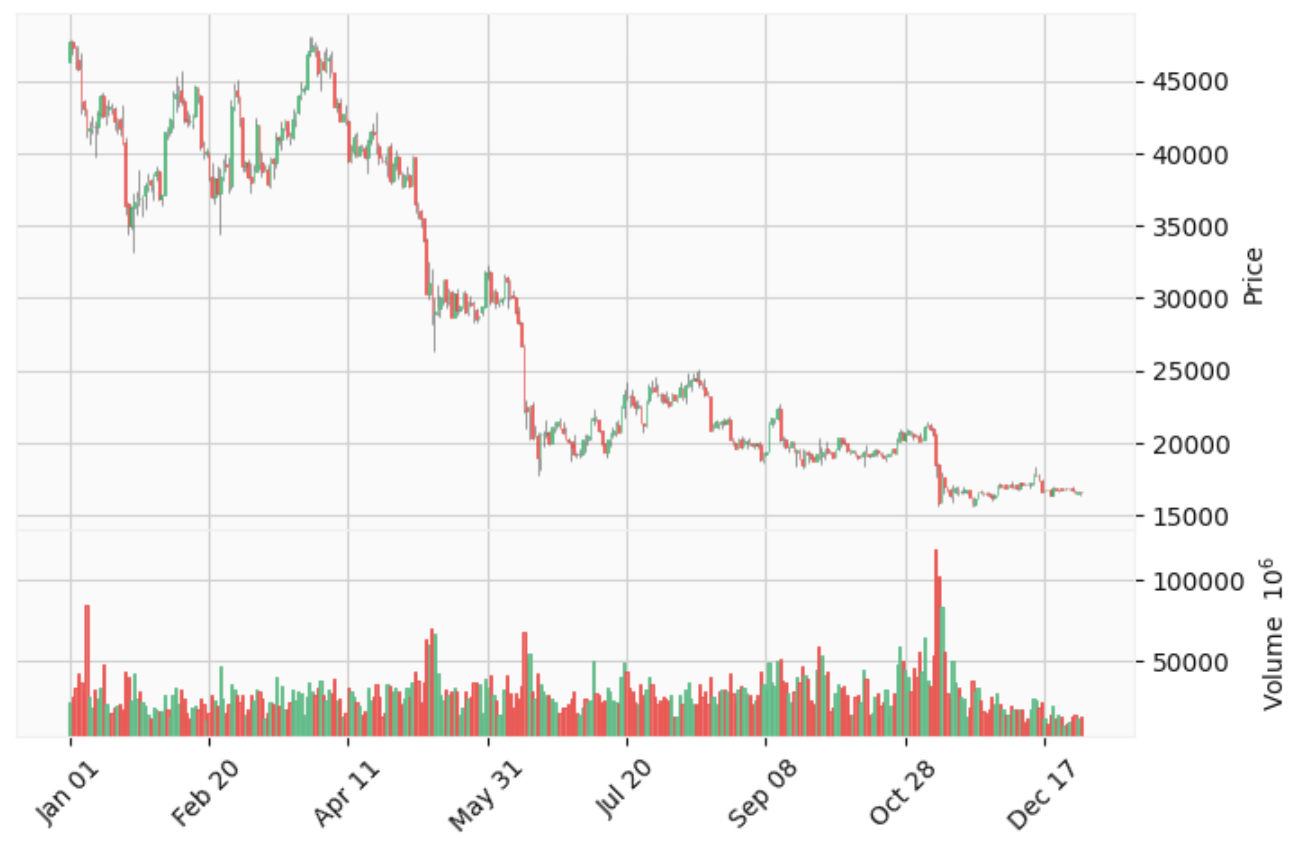
mplfinanceという株価や仮想通貨のチャートを表示できるツールを使い、ローソク足を表示させる。
一連のコードは↓
■ 環境
mplfinance : 0.12.9b7
pandas : 1.3.5
■ 実装
(1) データ収集
前回の記事と同様にyfinanceでビットコインのデータを収集しました。
データの詳細としては、2022年の日足のデータを収集しました。
!pip install yfinance
#yfinanceとpandasをインポート
import yfinance as yf
import pandas as pd

#取得するデータ詳細
name = 'BTC-USD'
start = '2022-01-01'
end = '2022-12-31'

#データのダウンロード
df = yf.download(tickers=name, start=start, end=end)
df.head()
詳しくは前回の記事をご覧ください。
( 2 ) mplfinanceをインストールする
!pip install mplfinance
( 3 ) 簡単なロウソク足を表示する
import mplfinance as mpf

mpf.plot(df, type="candle", figratio = (3, 2), volume=True, style="yahoo")

● type : グラフの種類
candle(ロウソク足), line(折れ線グラフ), renko(練行足), pnf(ポイント&フィギュア)
● figratio : 表示サイズを変える
● volume : 出来高の表示
● style : グラフのスタイル(色など)
binance, blueskies, brasil, charles, checkers, classic, default, ibd, kenan, mike, nightclouds, sas, starsandstripes, yahoo
( 4 ) 時間指定してみる
datetimeを使用して時間指定を行う。
import datetime as dt

df_r = df[dt.datetime(2022, 10, 1):dt.datetime(2022, 11, 1)]
mpf.plot(df_r, type="candle", figratio = (3, 2), volume=True, style="yahoo")

他の指定方法として
#2022年10月1日〜
df_r = df[dt.datetime(2022, 10, 1):]
#〜2022年2月1日
df_r = df[:dt.datetime(2022, 2, 1)]

#前から100日分
df_r = df.head(100)
#後ろから100日分
df_r = df.tail(100)
■ 参考文献