この記事はElastic stack Advent Calendar 2017の12/14分の記事です。
みなさん、初めまして。
fujii(@ZooBonta) と申します。
今回は、Logstash 5.0から利用可能になった、
Monitoring API を使って、Logstashを可視化してみようと思います。
環境情報
- OS
- Windows 10
- Elasticsearch/Logstash
- Ver 6.0.1
目的
Logstash のMonitoring APIを使って、Logstashを可視化します。
Monitoring API を使ってみたかっただけので、
「そんなの、Metricbeats使えば、いいじゃん」とかは言わないでください。。。
Monitoring APIとは?
Ver5 系から入った、Logstashの監視用APIです。
大きく、以下の4つに分類されます。
- Node Info API:Logstashのノードに関する情報を扱うAPI
- Plugins Info API:Logstashにインストールしたプラグインを扱うAPI
- Node Stats API:Logstashの統計情報を扱うAPI
- Hot Threads API:Logstashの起動中スレッドの情報を扱うAPI
さっそく、使ってみましょう。
まずは、Node Stats Info APIを使って、jvmの値を見てみます。
curl -X GET http://localhost:9600/_node/stats/jvm?pretty
以下の値が返ってきました。
{
  "host" : "my-host",
  "version" : "6.0.1",
  "http_address" : "127.0.0.1:9600",
  "id" : "b780ef4e-d70f-4919-a841-6b15caeed834",
  "name" : "my-host",
  "jvm" : {
    "threads" : {
      "count" : 28,
      "peak_count" : 32
    },
    "mem" : {
      "heap_used_percent" : 28,
      "heap_committed_in_bytes" : 1038876672,
      "heap_max_in_bytes" : 1038876672,
      "heap_used_in_bytes" : 299934992,
      "non_heap_used_in_bytes" : 155144224,
      "non_heap_committed_in_bytes" : 174878720,
      "pools" : {
        "survivor" : {
          "peak_used_in_bytes" : 34865152,
          "used_in_bytes" : 8099120,
          "peak_max_in_bytes" : 34865152,
          "max_in_bytes" : 34865152,
          "committed_in_bytes" : 34865152
        },
        "old" : {
          "peak_used_in_bytes" : 256622432,
          "used_in_bytes" : 110373176,
          "peak_max_in_bytes" : 724828160,
          "max_in_bytes" : 724828160,
          "committed_in_bytes" : 724828160
        },
        "young" : {
          "peak_used_in_bytes" : 279183360,
          "used_in_bytes" : 181462696,
          "peak_max_in_bytes" : 279183360,
          "max_in_bytes" : 279183360,
          "committed_in_bytes" : 279183360
        }
      }
    },
    "gc" : {
      "collectors" : {
        "old" : {
          "collection_time_in_millis" : 201,
          "collection_count" : 2
        },
        "young" : {
          "collection_time_in_millis" : 2295,
          "collection_count" : 62
        }
      }
    },
    "uptime_in_millis" : 2429462
  }
}
スレッド数、JVMのヒープ、GC実行回数などが見えますね。
それでは、別のLogstashを使って、このAPIの結果をLogstahに入れてみます。
今回は、http_poller プラグインを使いました。
input {
   http_poller  {
     urls => {
       host => "http://localhost:9600/_node/stats/jvm"
     }
     schedule => { cron => "* * * * * UTC"}
     codec => "json"
     metadata_target => "http_poller_metadata"
   }
}
output {
    elasticsearch {
      hosts => ["localhost"]
      index => "jvm-%{+YYYY.MM.dd}"
      document_type  => "monitoring"
    }
}
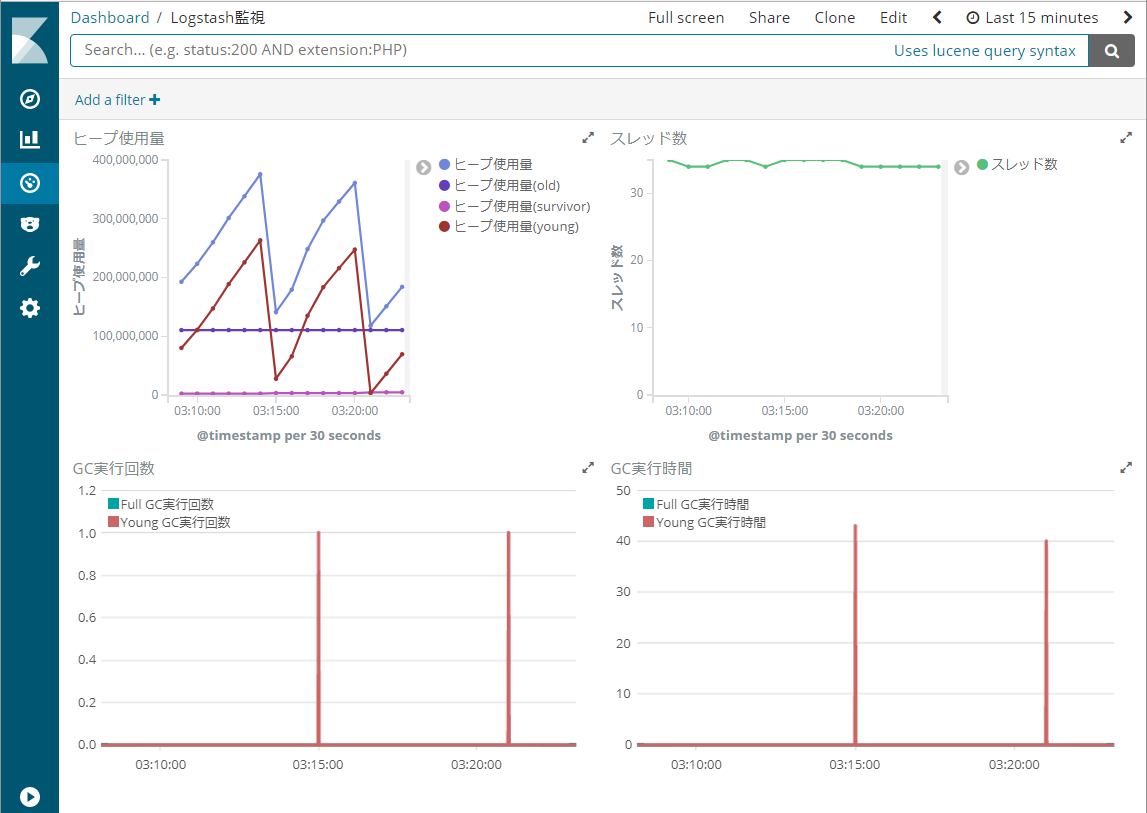
Logstashで取り込んだ結果をKibanaで可視化してみます。

ヒープ使用量、プロセスのスレッド数、GC実行回数、GC実行時間が取得できていることが確認できました。
これを使えば、Logstashの可視化ができますね。
どこかで見たような画面とか、言っちゃいけません。
最後に
LogstashのMonitoring APIでは、CPUやメモリといったリソース以外にも、
Logstashの全体イベント実行回数や、実行中のスレッド情報も取得可能です。
描画ライブラリと組み合わせると、Pipeline Viewer のような表現もできるようになっています。
是非、お試しください。