目次
1. はじめに
2. rpw.ui.forms.
3. Revit.UI.
4. Matplotlib
5. WPF
6. WinForms
7. Tkinter(使えない)
8. PySimpleGUI(使えない)
9. 参考リンク
はじめに
DynamoのPythonスクリプトやpyRevitでGUIをつくる方法を紹介します。本記事のコードはDynamo2.12(Revit2022)で動作確認しています。
rpw.ui.forms.
PyRevitには RPW(Revit Python Wrapper) というライブラリがデフォルトで搭載されており、これを使ってシンプルなGUIを簡単に作成できます。WPFを利用して実装されているため ironPython のみで動作します。DynamoのPythonスクリプトでも使用できます。
Dynamoの場合はパッケージをインストールしてください。
SelectFromList
辞書もしくはリストからドロップダウンリストを作成します。

from rpw.ui.forms import SelectFromList
value = SelectFromList('タイトル', ['1','2','3'])
TextInput
テキスト入力フォームを作成します。(改行などには対応していません。)
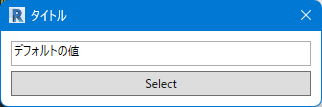
from rpw.ui.forms import TextInput
value = TextInput('タイトル', default='デフォルトの値')
TaskDialog
カスタマイズ可能なダイアログを作成します。

from rpw.ui.forms import CommandLink, TaskDialog
dialog = TaskDialog('メインテキスト',
            title='タイトル',
            title_prefix=False,
            content='サブテキスト',
            commands=[
                CommandLink('選択肢1', return_value='A'),
                CommandLink('選択肢2', return_value='B'),
                CommandLink('選択肢3', return_value='C'),
                CommandLink('選択肢4', return_value='D')],
            buttons=['None', 'Ok', 'Yes', 'No', 'Cancel', 'Retry', 'Close'],
            footer='フッターテキスト',
            verification_text='チェックボックス',
            expanded_content='詳細テキスト',
            show_close=True)
dialog.show()
Alert
メッセージダイアログを作成します。

from rpw.ui.forms import Alert
Alert('サブテキスト', title='タイトル', header='メインテキスト', exit=True)
Select Folder
フォルダ選択ダイアログを作成します。

from rpw.ui.forms import select_folder
folderpath = select_folder()
Select File
ファイル選択ダイアログを作成します。
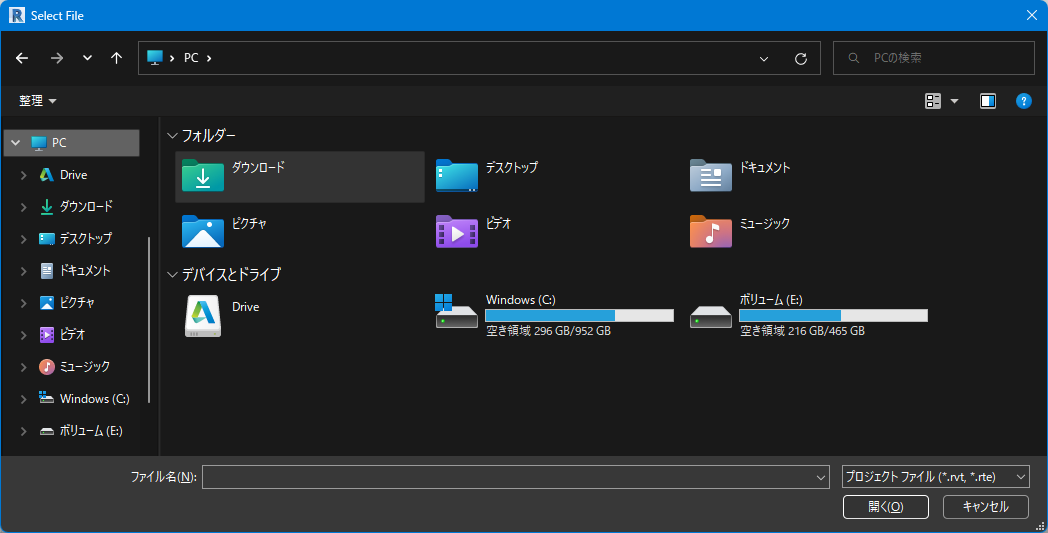
from rpw.ui.forms import select_file
filepath = select_file('プロジェクト ファイル (*.rvt, *.rte)|*.rvt, *.rte')
# select_file('<テキスト>|<ファイル形式>')
Console
コンソールを表示します。
※Dynamoでは動作しないようです。
FlexForm
ドロップダウンリスト・チェックボックス・ボタンなどを組み合わせてダイアログを作成します。
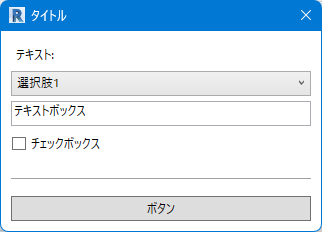
from rpw.ui.forms import *
dialog = FlexForm('タイトル',
        [Label('テキスト:'),
        ComboBox('combobox1', {'選択肢1': 10, '選択肢2': 20, '選択肢2': 30}),
        TextBox('textbox1', Text="テキストボックス"),
        CheckBox('checkbox1', 'チェックボックス'),
        Separator(),
        Button('ボタン')])
dialog.show()
Revit.UI.
RevitAPIに標準搭載されているダイアログを使用する方法です。pyRevitやDynamoに標準搭載されています。
TaskDialog
rpw.ui.forms.TaskDialog と同様にカスタマイズ可能なダイアログを作成します。こちらはプログレスバーやアイコンも表示できます。

import clr
clr.AddReference("RevitAPIUI")
from  Autodesk.Revit.UI import *

dialog = TaskDialog("タイトル")
dialog.MainIcon = TaskDialogIcon.TaskDialogIconShield
dialog.MainInstruction = "メインテキスト"
dialog.MainContent = "サブテキスト"
dialog.AddCommandLink(TaskDialogCommandLinkId.CommandLink1, "選択肢1")
dialog.AddCommandLink(TaskDialogCommandLinkId.CommandLink2, "選択肢2")
dialog.AddCommandLink(TaskDialogCommandLinkId.CommandLink3, "選択肢3")
dialog.AddCommandLink(TaskDialogCommandLinkId.CommandLink4, "選択肢4")
dialog.CommonButtons = TaskDialogCommonButtons.Ok|TaskDialogCommonButtons.Yes|TaskDialogCommonButtons.No|TaskDialogCommonButtons.Cancel|TaskDialogCommonButtons.Retry|TaskDialogCommonButtons.Close
dialog.DefaultButton = TaskDialogResult.Ok
dialog.EnableMarqueeProgressBar = True
dialog.FooterText = "フッターテキスト"
dialog.ExtraCheckBoxText = "チェックボックス"
dialog.ExpandedContent = "詳細テキスト"

res = dialog.Show()
表示できるアイコンは以下の4種類です。
| TaskDialogIconShield |  |
| TaskDialogIconInformation |  |
| TaskDialogIconError |  |
| TaskDialogIconWarning |  |
FileOpenDialog
rpw.ui.forms.Select File と同様にファイル選択ダイアログを作成します。

import clr
clr.AddReference("RevitAPIUI")
from  Autodesk.Revit.UI import *

dialog = FileOpenDialog("プロジェクト ファイル (*.rvt, *.rte)|*.rvt, *.rte")
res = dialog.Show()
path  = ModelPathUtils.ConvertModelPathToUserVisiblePath(dialog.GetSelectedModelPath())
FileSaveDialog
ファイル保存ダイアログを作成します。
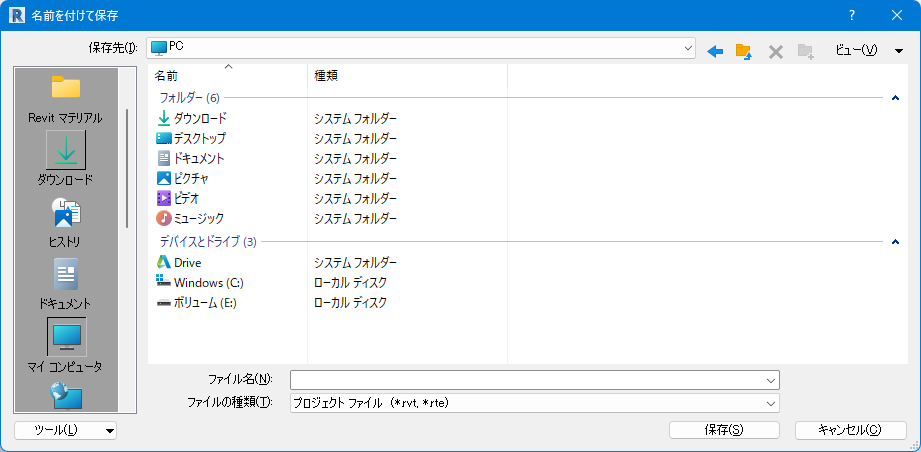
import clr
clr.AddReference("RevitAPIUI")
from  Autodesk.Revit.UI import *

dialog = FileSaveDialog("プロジェクト ファイル (*.rvt, *.rte)|*.rvt, *.rte")
dialog.Show()
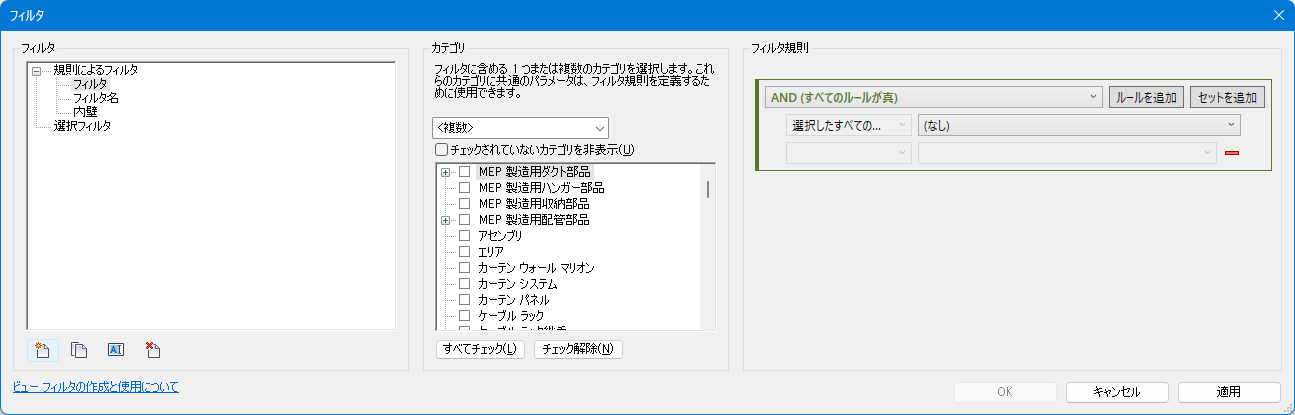
FilterDialog
フィルタダイアログを作成します。
import clr
clr.AddReference("RevitAPIUI")
from  Autodesk.Revit.UI import *

clr.AddReference("RevitServices")
import RevitServices
from RevitServices.Persistence import DocumentManager
doc = DocumentManager.Instance.CurrentDBDocument

dialog = FilterDialog(doc, "フィルタ");
dialog.Show();
param_filter = doc.GetElement(dialog.NewFilterId)
filter = param_filter.GetElementFilter()
ColorSelectionDialog
色選択ダイアログを作成します。

import clr
clr.AddReference("RevitAPIUI")
from  Autodesk.Revit.UI import *

clr.AddReference("RevitServices")
import RevitServices
from RevitServices.Persistence import DocumentManager

dialog = ColorSelectionDialog()
dialog.Show()
selected = dialog.SelectedColor
Matplotlib
Matplotlib はPythonのグラフ描画のためのライブラリで、グラフの描画やデータの可視化が簡単に行えます。折れ線グラフ、ヒストグラムや散布図など表現可能です。
Matplotlib は標準ライブラリではないため自分でインストールする必要があります。下記記事の「ライブラリのインストール」を参考にしてください。
Matplotlib の使い方は下記記事を参考にしてください。
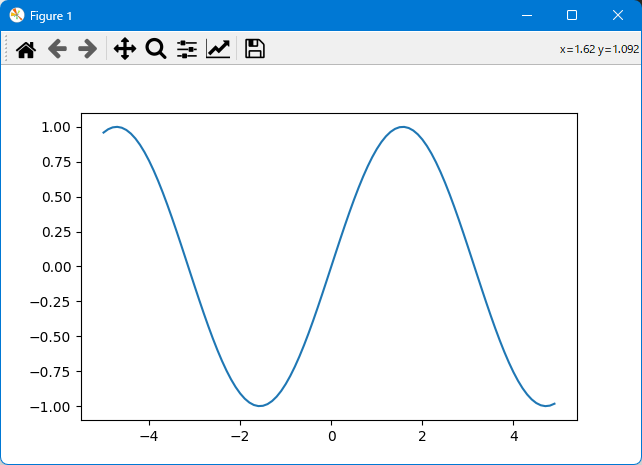
グラフを表示する
import sys
sys.path.append(r'C:\Users\<ユーザー名>\.conda\envs\Dynamo383\Lib\site-packages')
import numpy as np
import matplotlib.pyplot as plt

x = np.arange(-5, 5, 0.1)
y = np.sin(x)
plt.plot(x,y)
plt.show()
Watch Imageノードで表示する

import sys
sys.path.append(r'C:\Users\<ユーザー名>\.conda\envs\Dynamo383\Lib\site-packages')
import io
import numpy as np
import matplotlib.pyplot as plt
from PIL import Image as Img
import System.Drawing
from System.Drawing import *
from System.Drawing.Imaging import *
from System.IO import MemoryStream

def convertToBitmap(fig):
    rgba_buf = fig.canvas.buffer_rgba()
    (w,h) = fig.canvas.get_width_height()
    npImgArray = np.frombuffer(rgba_buf, dtype=np.uint8).reshape((h,w,4))
    bitmap_ = None
    # alphaチャンネルを削除
    if npImgArray.ndim == 3 and npImgArray.shape[-1] == 4:
        npImgArray = npImgArray[:, :, :-1]
    img = Img.fromarray(npImgArray, "RGB")
    # 画像をバイナリデータに変換し、メモリ上に保存
    byteIO = io.BytesIO()
    img.save(byteIO, format='BMP')
    byteArr = byteIO.getvalue()
    # ByteArrayに変換して出力
    netBytes = System.Array[System.Byte](byteArr)
    with MemoryStream(netBytes) as ms:
        bitmap_ = Bitmap(ms)
    return bitmap_

fig = plt.figure(figsize=(10,10))

ax1 = fig.add_subplot(2,1,1)
x = np.arange(-5, 5, 0.1)
y = np.sin(x)
ax1.plot(x, y)
ax1.grid(True)

ax2 = fig.add_subplot(2,1,2)
a = range(0, 7)
b = [55,21,61,98,85,52,99]
ax2.bar(a, b)
ax2.grid(True)

fig.canvas.draw()
OUT = convertToBitmap(fig)
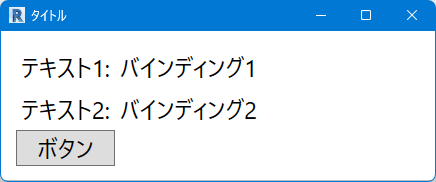
WPF
WPF は.NET Frameworkで利用できるGUIを開発するための機能で、ironPythonのみで動きます。他の手法よりもリッチな(カッコイイ&高機能な)GUIを作り込むことができます。また、後々にアドインをC#で再実装する場合にはWPFを使いまわすことができます。
C#.NETでの開発経験がある人にオススメです。
WPFアプリケーションでは、ロジックと視覚的な部分を分離して、XAML(Extensible Application Markup Language)」と呼ばれるマークアップ言語で記述します。
import clr
clr.AddReference("PresentationFramework")
clr.AddReference("PresentationCore")

from System.Windows import Application
from System.Windows.Markup import XamlReader

xaml = """<Window
    xmlns="http://schemas.microsoft.com/winfx/2006/xaml/presentation"
    xmlns:x="http://schemas.microsoft.com/winfx/2006/xaml"
    xml:lang="ja-JP"
    Title="タイトル"
    Width="450"
    SizeToContent="Height">
    <Grid Margin="15" x:Name="grid1">
        <Grid.RowDefinitions>
            <RowDefinition Height="Auto" />
            <RowDefinition Height="Auto" />
            <RowDefinition Height="Auto" />
        </Grid.RowDefinitions>
        <Grid.ColumnDefinitions>
            <ColumnDefinition Width="Auto" />
            <ColumnDefinition Width="*" />
        </Grid.ColumnDefinitions>
        <Label Grid.Row="0" Grid.Column="0" FontSize="24" Content="テキスト1:" />
        <Label Grid.Row="0" Grid.Column="1" FontSize="24" Content="バインディング1" />
        <Label Grid.Row="1" Grid.Column="0" FontSize="24" Content="テキスト2:" />
        <Label Grid.Row="1" Grid.Column="1" FontSize="24" Content="バインディング2" />
        <Button Grid.Row="2" FontSize="24" Content="ボタン"/>
    </Grid>
</Window>"""

w = XamlReader.Parse(xaml)
Application().Run(w)
WinForms
WinForms は.NET Frameworkで利用できるGUIを開発するための機能です。
C#.NETでの開発経験がある人にオススメです。

import clr
clr.AddReference('System.Windows.Forms')
clr.AddReference('System.Drawing')

import System.Drawing
import System.Windows.Forms
from System.Drawing import *
from System.Windows.Forms import *

class MainForm(System.Windows.Forms.Form):
    def __init__(self):
        self.InitializeComponent()

    def InitializeComponent(self):
        self._progressBar1 = System.Windows.Forms.ProgressBar()
        self._label1 = System.Windows.Forms.Label()
        self._button1 = System.Windows.Forms.Button()
        self._button2 = System.Windows.Forms.Button()
        self.SuspendLayout()

        # progressBar1
        self._progressBar1.Location = System.Drawing.Point(15, 50)
        self._progressBar1.Name = "progressBar1"
        self._progressBar1.Size = System.Drawing.Size(370, 20)
        self._progressBar1.Minimum = 0     #最小値を指定
        self._progressBar1.Maximum = 3   #最大値を指定

        # label1
        self._label1.Location = System.Drawing.Point(18, 20)
        self._label1.Name = "label1"
        self._label1.Size = System.Drawing.Size(300, 23)
        self._label1.TabIndex = 1
        self._label1.Text = "「実行」をクリックして処理を開始します。"

        # button1
        self._button1.Location = System.Drawing.Point(210, 80)
        self._button1.Name = "button1"
        self._button1.Size = System.Drawing.Size(80, 25)
        self._button1.TabIndex = 1
        self._button1.Text = "実行"
        self._button1.UseVisualStyleBackColor = True
        self._button1.Click += self.Button1Click

        # button2
        self._button2.Location = System.Drawing.Point(305, 80)
        self._button2.Name = "button2"
        self._button2.Size = System.Drawing.Size(80, 25)
        self._button2.TabIndex = 1
        self._button2.Text = "キャンセル"
        self._button2.UseVisualStyleBackColor = True
        self._button2.Click += self.Button2Click

        # MainForm
        self.ClientSize = System.Drawing.Size(400, 120)
        self.Controls.Add(self._label1)
        self.Controls.Add(self._button1)
        self.Controls.Add(self._button2)
        self.Controls.Add(self._progressBar1)
        self.Name = "MainForm"
        self.Text = "タイトル"
        self.StartPosition = System.Windows.Forms.FormStartPosition.CenterScreen
        self.ResumeLayout(False)
        self.PerformLayout()

    def update(self, text, progress_value):
        self._label1.Text = text
        self._label1.Update()
        if progress_value <= 3:
            self._progressBar1.Value = progress_value
            self._progressBar1.Update()

    def Button1Click(self, sender, e):

        self.update("処理1を実行中...", 1)
        <重い処理 1>

        self.update("処理2を実行中...", 2)
        <重い処理 2>

        self.update("処理3を実行中...", 2)
        <重い処理 3>

        self.update("処理が完了しました。", 7)
        self.Close()

    def Button2Click(self, sender, e):
        self.Close()

System.Windows.Forms.Application.EnableVisualStyles()
form = MainForm()
System.Windows.Forms.Application.Run(form)
Tkinter(使えない)
Python標準のGUIライブラリであるTkinterは、DynamoやpyRevitで扱うことができません。TkinterはironPythonとCPythonのどちらにも含まれていません。
pyRevitに搭載されているPythonエンジンには、ironPython(C#で実装されたPython、Python2)とCPython(Cで実装されたPython、Python3)があります。このCPythonは通常のものと異なる組み込み Python(Python Embeddable)というもので、Numpy など一部の外部ライブラリが使えますが、GUI関連のライブラリでは使えないモノもあります。
PySimpleGUI(使えない)
PySimpleGUIもDynamoやpyRevitで扱うことができません。PySimpleGUI内部でTkinterが用いられているためです。
参考リンク