やりたいこと
動作環境
package.json
    "vue": "^3.3.8",
    "vue-chartjs": "^4.0.4",
    "chart.js": "^3.7.1",
ソースコード
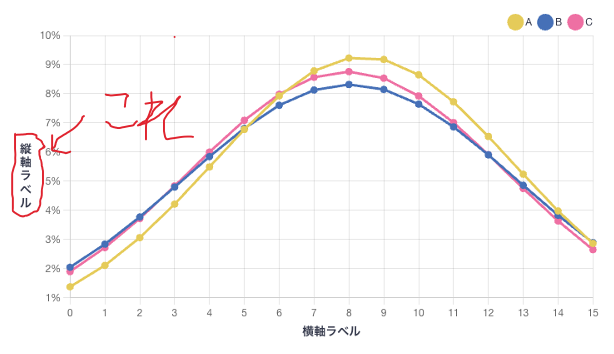
正規分布図を描画するコンポーネント。
NormalDistributionChart.vue
<template>
  <Line
    :chart-data="chartData"
    :chart-options="chartOptions"
    :plugins="plugins"
  />
</template>

<script setup lang="ts">
import { defineProps, withDefaults, computed } from "vue";
import { Line } from "vue-chartjs";
import {
  Chart,
  ChartData,
  ChartOptions,
  Plugin,
  registerables,
} from "chart.js";

Chart.register(...registerables);

export interface LineData {
  fx: number[];
  label: string;
  color: string;
}

export interface Props {
  x: number[];
  lines: LineData[];
}

const props = withDefaults(defineProps<Props>(), {
  x: () => [],
  lines: () => [],
});

const chartData = computed<ChartData<"line">>(() => ({
  labels: props.x,
  datasets: props.lines.map((line) => {
    return {
      label: line.label,
      data: line.fx,
      backgroundColor: line.color,
      borderColor: line.color,
      borderWidth: 3,
    };
  }),
}));

const chartOptions = computed<ChartOptions<"line">>(() => ({
  responsive: true,
  maintainAspectRatio: false,
  scales: {
    x: {
      title: {
        display: true,
        text: "横軸ラベル",
        font: {
          size: 14,
          weight: "bold",
        },
      },
    },
    y: {
      ticks: {
        callback: (value) => `${Math.floor(Number(value) * 100)}%`,
      },
    },
  },
  plugins: {
    legend: {
      align: "end",
      labels: {
        usePointStyle: true,
        font: {
          size: 12,
        },
      },
    },
    verticalTitle: {
      display: true,
      text: "縦軸ラベル",
      font: {
        size: 14,
        weight: "bold",
      },
    },
  },
}));

const plugins: Plugin<"line">[] = [
  {
    id: "verticalTitle",
    beforeLayout: (chart: any, args: any, opts: any) => {
      const { display, font } = opts;
      if (!display) return;

      const { ctx } = chart;
      ctx.font = `${font?.weight || "normal"} ${font?.size || 12}px ${
        font?.family || "'Helvetica Neue', 'Helvetica', 'Arial', sans-serif"
      }`;
      const { width } = ctx.measureText(opts.text[0]);
      chart.options.layout.padding.left = width * 1.5;
    },
    afterDraw: (chart: any, args: any, opts: any) => {
      const { display, font, text, color } = opts;
      const {
        ctx,
        chartArea: { top, bottom, left, right },
      } = chart;

      if (!display) return;

      ctx.fillStyle = color || Chart.defaults.color;
      ctx.font = `${font?.weight || "normal"} ${font?.size || 12}px ${
        font?.family || "'Helvetica Neue', 'Helvetica', 'Arial', sans-serif"
      }`;

      const fontSize = font?.size || 12;
      const y = (top + bottom) / 2 - (text.length / 2) * fontSize;
      const lineHeight = 1.1618; // 行の高さ (フォントサイズに対する倍率)
      for (var lines = text.split(""), i = 0, l = lines.length; l > i; i++) {
        var line = lines[i];
        var addY = fontSize;

        // 2行目以降の水平位置は行数とlineHeightを考慮する
        if (i) addY += fontSize * lineHeight * i;

        ctx.fillText(line, 0, y + addY);
      }
    },
  },
];
</script>
ポイント
通常機能として提供されていないので plugins で縦書きの縦軸ラベル機能を追加する。
"verticalTitle"という名前で追加するコード。
NormalDistributionChart.vue
<script setup lang="ts">
const plugins: Plugin<"line">[] = [
  {
    id: "verticalTitle",
    beforeLayout: (chart: any, args: any, opts: any) => {
      const { display, font } = opts;
      if (!display) return;

      const { ctx } = chart;
      ctx.font = `${font?.weight || "normal"} ${font?.size || 12}px ${
        font?.family || "'Helvetica Neue', 'Helvetica', 'Arial', sans-serif"
      }`;
      const { width } = ctx.measureText(opts.text[0]);
      chart.options.layout.padding.left = width * 1.5;
    },
    afterDraw: (chart: any, args: any, opts: any) => {
      const { display, font, text, color } = opts;
      const {
        ctx,
        chartArea: { top, bottom, left, right },
      } = chart;

      if (!display) return;

      ctx.fillStyle = color || Chart.defaults.color;
      ctx.font = `${font?.weight || "normal"} ${font?.size || 12}px ${
        font?.family || "'Helvetica Neue', 'Helvetica', 'Arial', sans-serif"
      }`;

      const fontSize = font?.size || 12;
      const y = (top + bottom) / 2 - (text.length / 2) * fontSize;
      const lineHeight = 1.1618; // 行の高さ (フォントサイズに対する倍率)
      for (var lines = text.split(""), i = 0, l = lines.length; l > i; i++) {
        var line = lines[i];
        var addY = fontSize;

        // 2行目以降の水平位置は行数とlineHeightを考慮する
        if (i) addY += fontSize * lineHeight * i;

        ctx.fillText(line, 0, y + addY);
      }
    },
  },
];
</script>
"verticalTitle"を使うコード。
NormalDistributionChart.vue
<script setup lang="ts">
const chartOptions = computed<ChartOptions<"line">>(() => ({
  plugins: {
    verticalTitle: {
      display: true,
      text: "縦軸ラベル",
      font: {
        size: 14,
        weight: "bold",
      },
    },
  },
}));
</script>