前段:
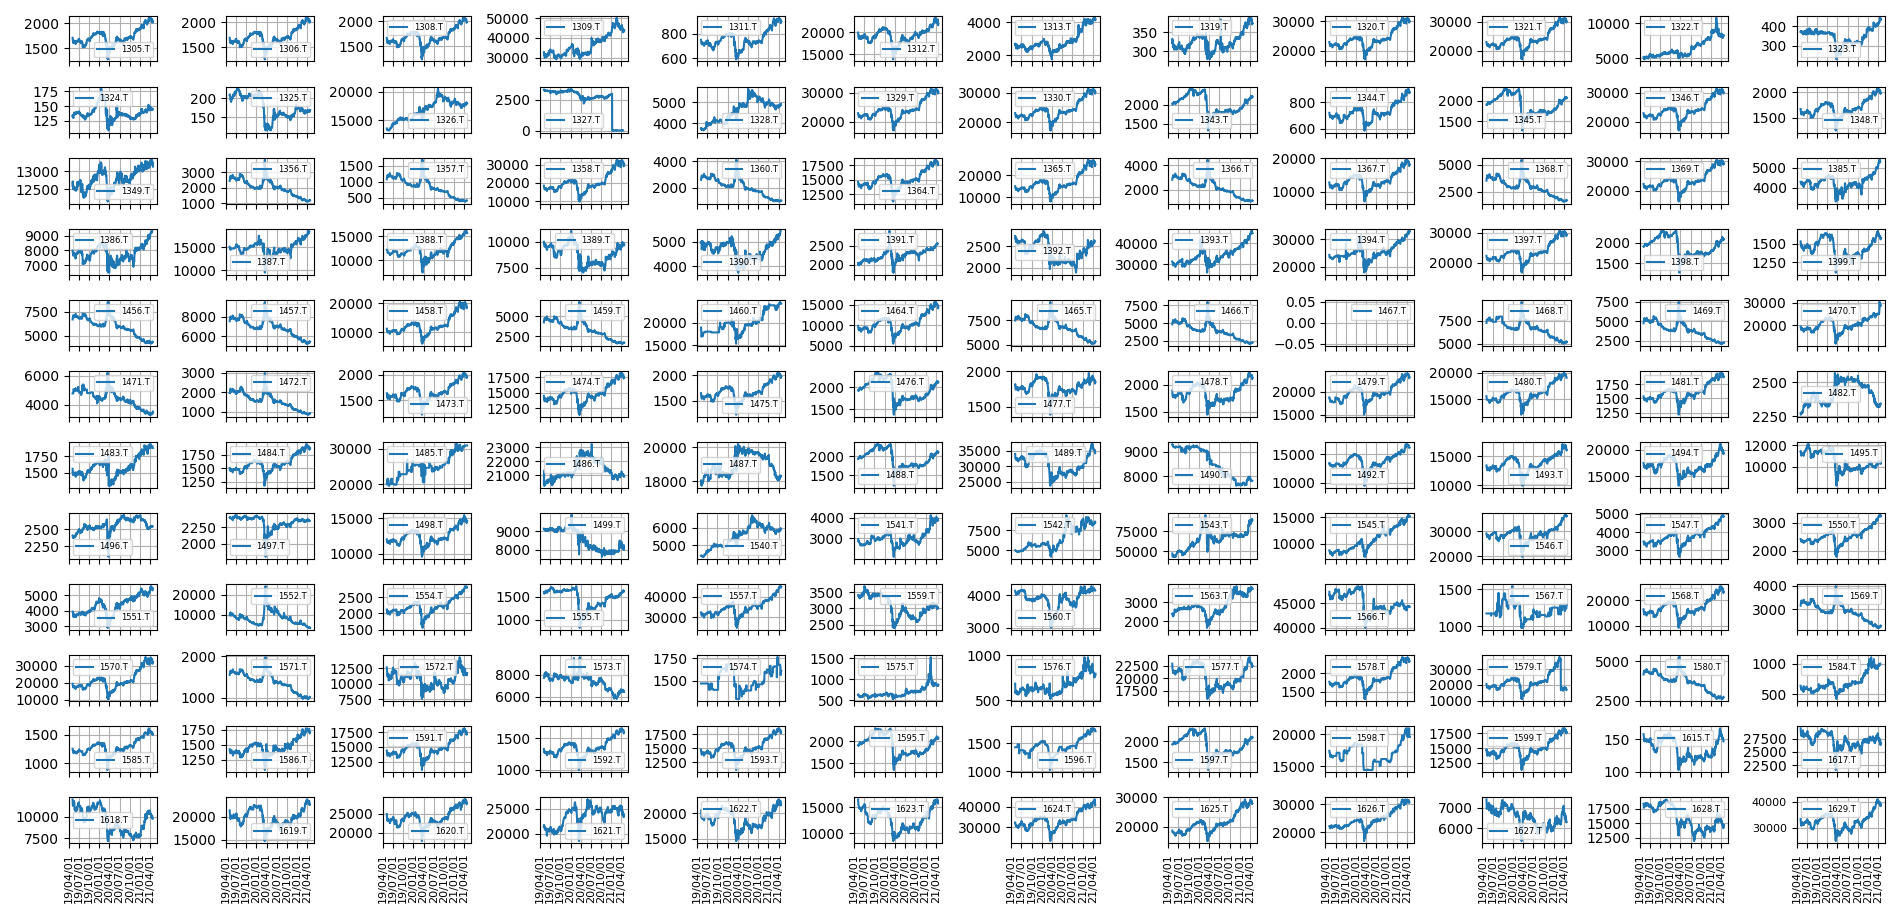
メーカーの営業をしており、常日頃の思いとして「主要1,000製品の受注動向をデイリーで把握したい」という思いに駆られることが多々ある。色々試行した結果折れ線グラフでの可視化が一番効率良くモニターできると感じPythonでのグラフ作りに至った。
*本投稿では受注データーの代わりに株価を使用。
(社内セキュリティーの関係でPythonを導入できていない為、実務上での解決には至っていない)
構成:
株価を使用しPythonでのグラフ作り
以下手順
・Pythonで株価の自動取得
・データー整形
・データーを纏めてプロット
# 必要ライブラリーのImport
from datetime import datetime
import pandas as pd
import matplotlib.pyplot as plt
import sys
from yahoo_finance_api2 import share
from yahoo_finance_api2.exceptions import YahooFinanceError
import numpy as np
import matplotlib.dates as mdate
# 銘柄ファイルを先にエクセルで作成しておきPandasで読み込み(銘柄コード一覧はネットで拾ってくる)
df=pd.read_excel("/Users/銘柄.xlsx")
l=df["コード"]
# yahoo_finance_apiで株価を自動取得する為、銘柄コードの末尾に「.T」を付与する処理
j=list(l)
q=list(map(lambda x: str(x),j))
c = list(map(lambda x: x+".T", q))
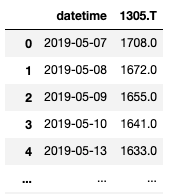
# 先ずは例として1銘柄2年分自動取得を行う。(今回はOpenのみ使用)
my_share = share.Share('1305.T')
symbol_data = None

try:
    symbol_data= my_share.get_historical(
        share.PERIOD_TYPE_YEAR, 2,
        share.FREQUENCY_TYPE_DAY,1)
except YahooFinanceError as e:
    print(e.message)
    sys.exit(1)

df = pd.DataFrame(symbol_data)
df["datetime"] = pd.to_datetime(df.timestamp, unit="ms")
g=df[["datetime","open"]]
g.rename(columns={'open': '1305.T'}, inplace=True)
# 残りはfor loopで回し、上で作成した株価一覧に結合していく
for z in c:
    my_share = share.Share(z)
    symbol_data = None

    try:
        symbol_data = my_share.get_historical(
            share.PERIOD_TYPE_YEAR, 2,
            share.FREQUENCY_TYPE_DAY,1)
    except YahooFinanceError as e:
        print(e.message)
        sys.exit(1)

    df = pd.DataFrame(symbol_data)
    df["datetime"] = pd.to_datetime(df.timestamp, unit="ms")
    d=df[["datetime","open"]]
    d.rename(columns={'open': z}, inplace=True)
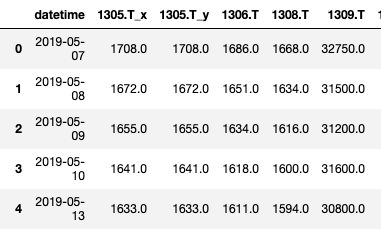
    g=pd.merge(g, d, on='datetime',how='left')
# datetimeをインデックス化。また1305.Tの重複を削除
g.set_index('datetime', inplace=True)
print(g.columns[[0,1,2]])
g.rename(columns={'1305.T_y': '1305.T'}, inplace=True)
g.drop(g.columns[[0]], axis=1,inplace=True)
# 複合グラフの処理、見やすさを加味し12x12とした
%matplotlib tk
fig, axes = plt.subplots(12,12,sharex=True,sharey=False, figsize = (19,10))

for ax, zz in zip(axes.ravel(),c):
    dt = g[zz]
    ax.plot(dt,label=zz)
    ax.grid(True)
    ax.legend(fontsize=6)
    ax.set_xticklabels(g.index,rotation=90,fontsize=8)
xfmt = mdates.DateFormatter("%y/%m/%d")
ax.xaxis.set_major_formatter(xfmt)

ax.tick_params(labelsize=8)
plt.tight_layout()
plt.show()


