0
1

Delete article

Deleted articles cannot be recovered.

Draft of this article would be also deleted.

Are you sure you want to delete this article?

More than 3 years have passed since last update.

CSV などのデータファイルを TeX のみでグラフ化し,PDF で保存する

Last updated at Posted at 2021-08-25

なぜ TeX を使いたいか

  • 論文等を TeX で書くとき:
    • 図で用いるフォントも TeX 由来のものに統一したい.
    • 文中のフォントサイズと図のフォントサイズを無理なく合わせたい.
    • 元データに修正が入るたびに図を作り直すのが面倒なので,コマンド一発で再生成できるようにしたい.

上記の多くは Pythonmatplotlib でも実現可能であるが,PGF/TikZ のほうが柔軟性が高いと考えたため,しばらくはこちらで運用することにする.

筆者の環境

  • macOS Big Sur Version 11.5
  • TeX Live 2020 (GUI は特に不要です)

データファイル

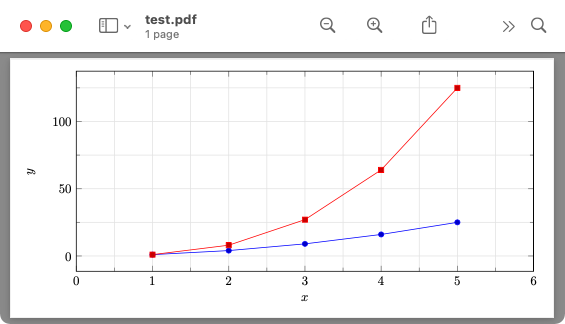
次のような CSV ファイルのデータをグラフ化してみます.

test.csv
x1, x2, x3 # ヘッダはあってもなくても構わない
1, 1, 1
2, 4, 8
3, 9, 27
4, 16, 64
5, 25, 125

TeX ソース

\documentclass[dvipdfmx,tikz,border=10pt]{standalone}
% tikz       : 指定しなければ PDF 2ページ目に白紙が入ってしまう.                                                                                                                                                                                                               
% border     : 余白に相当.指定なしではグラフがはみ出ることがある.                                                                                                                                                                                                             

\usepackage{pgfplots}

\pgfplotstableread[  % CSV の読み込み                                                                                                                                                                                                                                           
  col sep=comma,     % セパレータ                                                                                                                                                                                                                                               
  comment chars={\#} % コメント行の先頭文字                                                                                                                                                                                                                                     
]{test.csv}\testcsv

\begin{document}
\begin{tikzpicture}
  \begin{axis}[
      xmin=0, xmax=6,
      xlabel={$x$},         % x 軸のラベル,もちろん math モードで書けます
      ylabel={$y$},         % y 軸のラベル
      width=400pt, 
      height=200pt,
      grid=both,            % 主グリッド,副グリッド,共に表示                                                                                                                                                                                                                  
      grid style={gray!20}, % グリッド線のスタイル                                                                                                                                                                                                                              
      minor tick num = 1,   % 副目盛(グリッド)の本数                                                                                                                                                                                                                          
      xtick distance = 1    % x 目盛の間隔                                                                                                                                                                                                                                      
    ]
    \addplot table [
      x index=0, % x 座標として用いるデータのインデックス                                                                                                                                                                                                                       
      y index=1  % y 座標として用いるデータのインデックス                                                                                                                                                                                                                       
    ] \testcsv;
    \addplot table [
      x = x1, % インデックスの代わりにヘッダを利用                                                                                                                                                                                                                              
      y = x3
    ] \testcsv;
  \end{axis}
\end{tikzpicture}
\end{document}
  • ファイルの先頭行にヘッダを指定してある場合,x index=0x = x1 などの形に置き換えることができます.
  • col sep としては,comma の他に spacetab など色々なセパレータを指定できます.
  • PGF/TikZ の記法ではコマンド文末に ; がつくことをお忘れなく.

出力結果

  • エンジンは何でも良いですが,筆者は latexmk (中身は platex + dvipdfmx)を用いています.

Screen Shot 2021-08-25 at 20.47.34.png

  • 図を論文等に挿入する際には,サイズ変更やスケーリングなどのオプション(width=.75\textwidth, scale=2.0 など)を用いずに,そのまま \includegraphics{test.pdf} などとしましょう.documentclass のフォントサイズが同じであれば,図のフォントと本文フォントが完全に一致します.
  • 本稿では紹介しませんが,nodepin などを用いれば,柔軟なデコレーションが可能になります.
0
1
0

Register as a new user and use Qiita more conveniently

  1. You get articles that match your needs
  2. You can efficiently read back useful information
  3. You can use dark theme
What you can do with signing up
0
1

Delete article

Deleted articles cannot be recovered.

Draft of this article would be also deleted.

Are you sure you want to delete this article?