概要
外国為替取引におけるアルゴリズム取引のうち代表的なものをいくつか選んで実装する。
今回の導入ではアメリカドル(USD)にだけ焦点を当てて価格推移、価格の変化率、5日移動平均線などを実装した。
データ
データはみずほ銀行のヒストリカルデータから日次データ等を取得できる。
CSV形式である。
そのままだと扱いにくいので、indexを日付、columnsを通貨の名前にした。
def load_data():
    """
    為替情報をダウンロードしてくる
    Parameter
    ---------
    None

    Return
    ------
    df : pandas DataFrame
        取得した為替情報
    """
    url = "https://www.mizuhobank.co.jp/market/csv/quote.csv"
    r = requests.get(url)
    df = pd.read_csv(io.BytesIO(r.content), sep=",", encoding="cp932")

    nameOfCurrency = list(df.iloc[1].values)
    nameOfCurrency = nameOfCurrency[1:]
    nameOfCurrency = nameOfCurrency[:31] + nameOfCurrency[32:]

    date = list(df.T.iloc[0].values)
    date = date[2:]

    df = df.drop(df.columns[[0, 32]], axis=1)
    df = df.T.drop(df.T.columns[[0, 1]], axis=1)
    df = df.T
    df.index = date
    df.columns = nameOfCurrency
    return df
用語
実装したもののうち馴染みがないと思う以下の4つのものについては、それぞれの項目において図を用いて説明する。
5日移動平均線
25日移動平均線
ゴールデン・クロス
デッド・クロス
実装
価格の推移
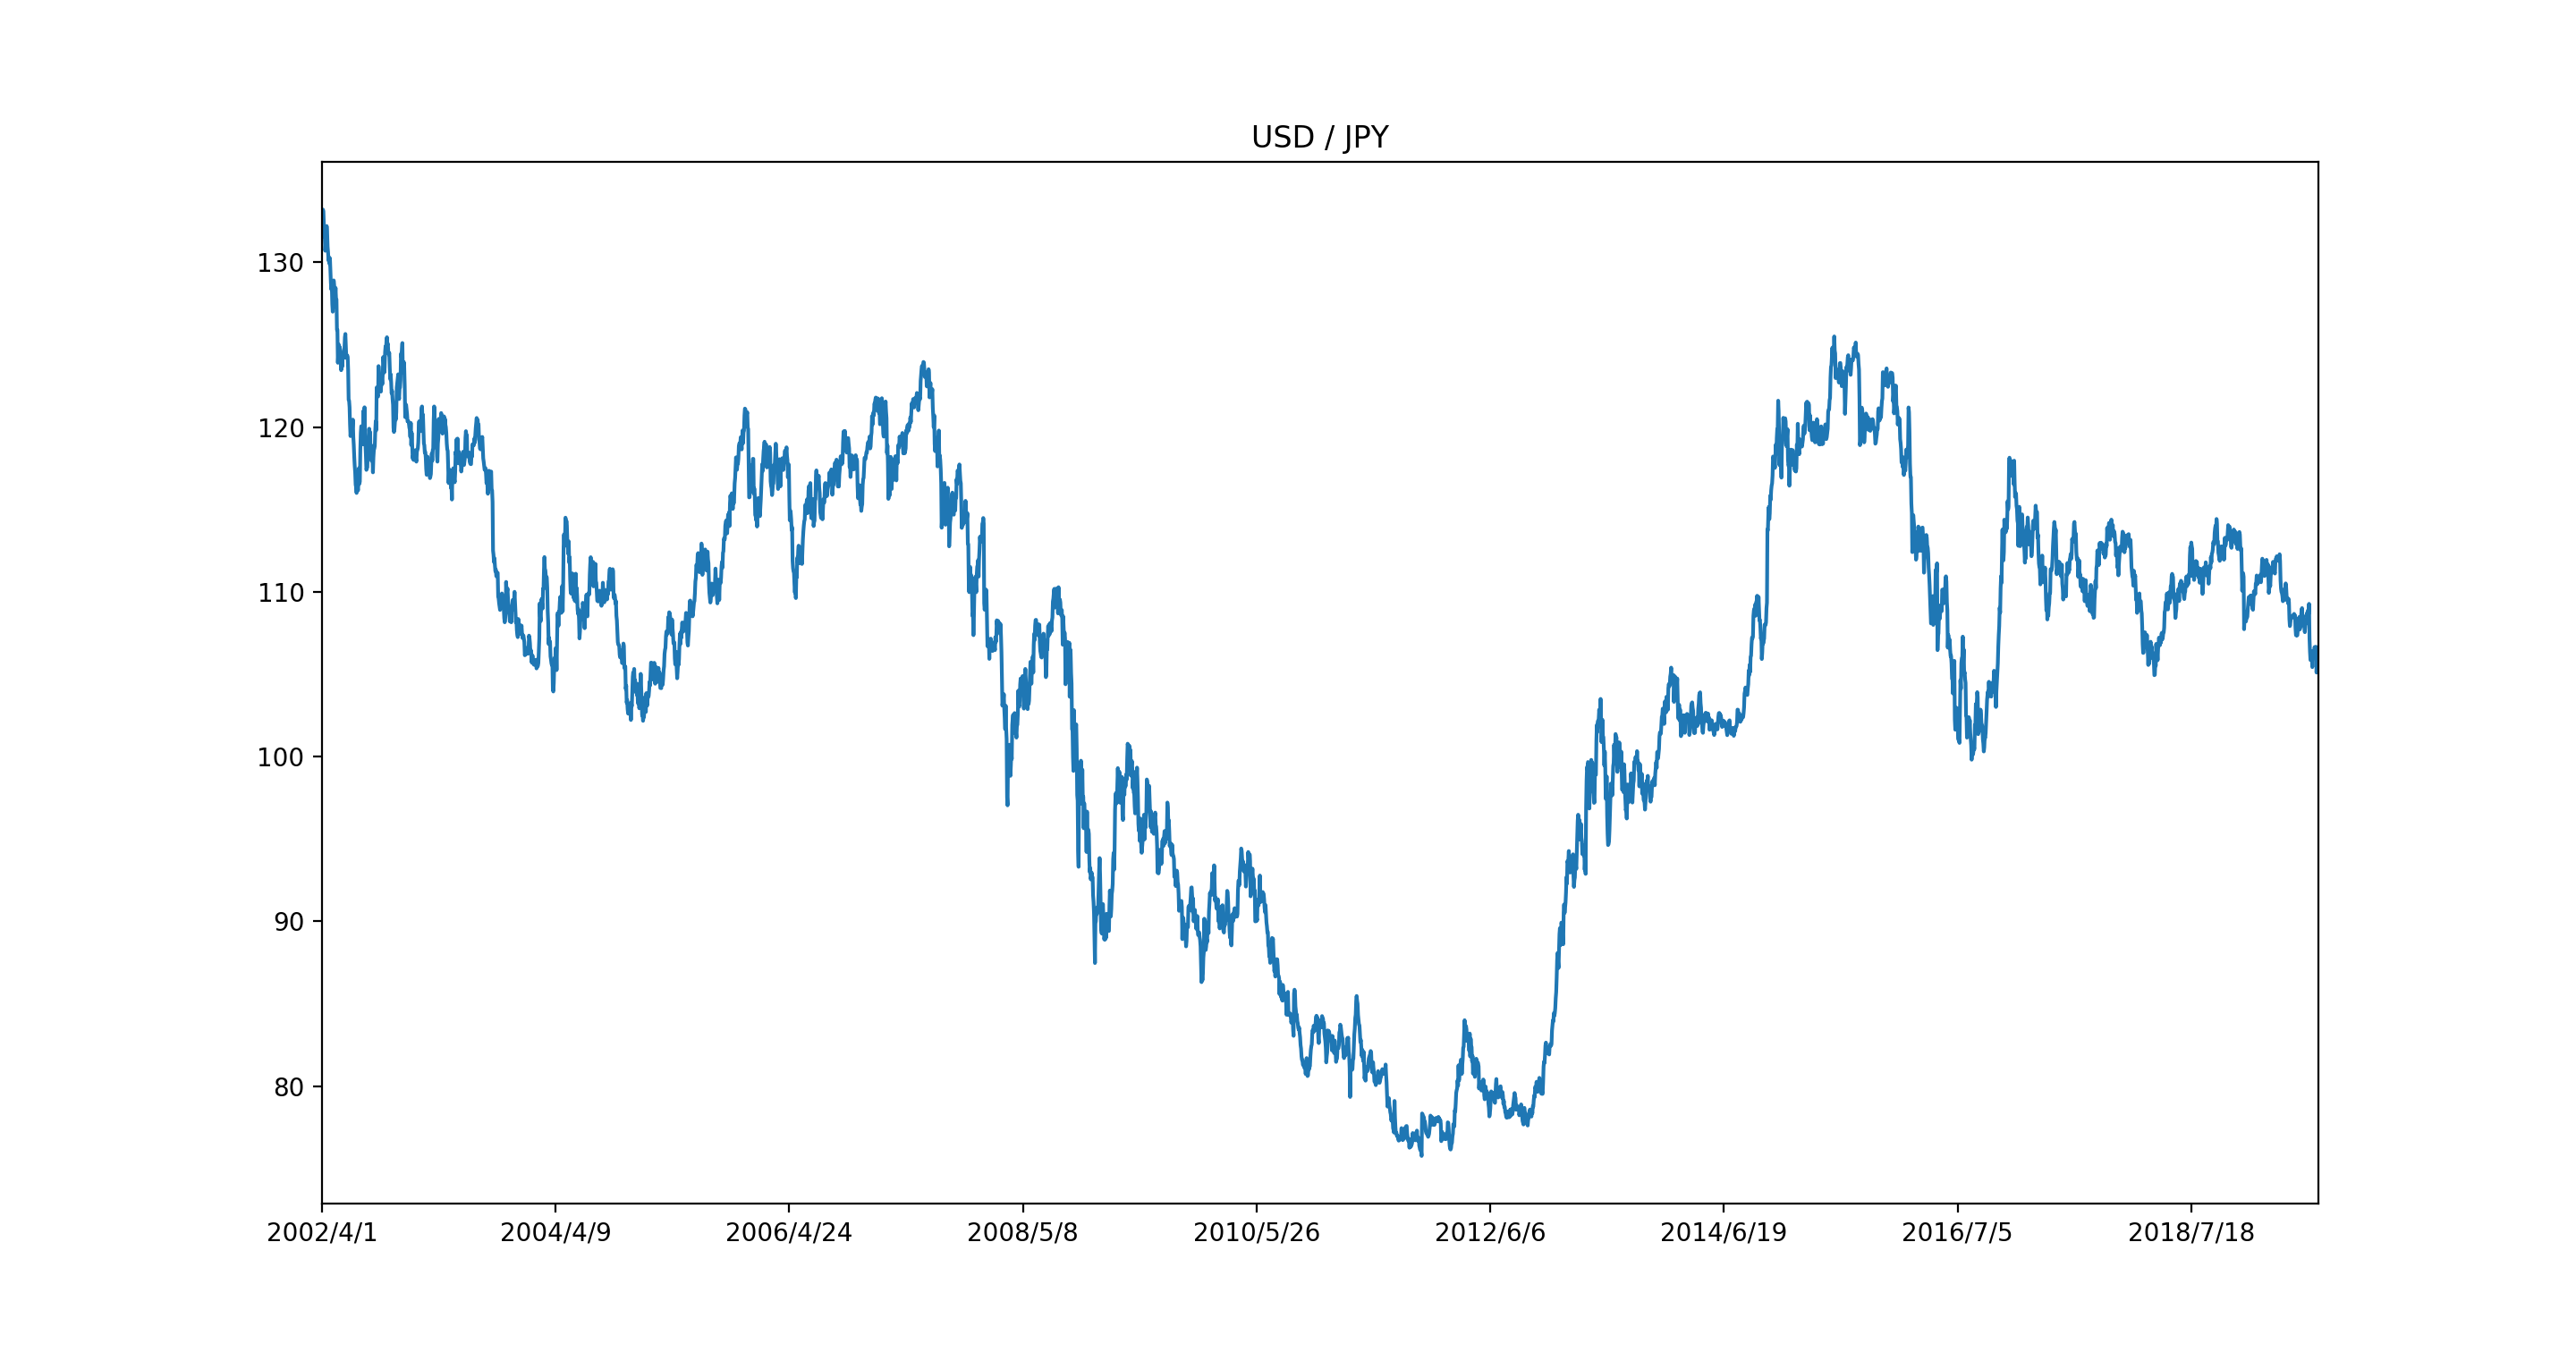
とりあえずcsvファイルにある2002/4/1から2019/8/30までの$1の価格をプロットした。

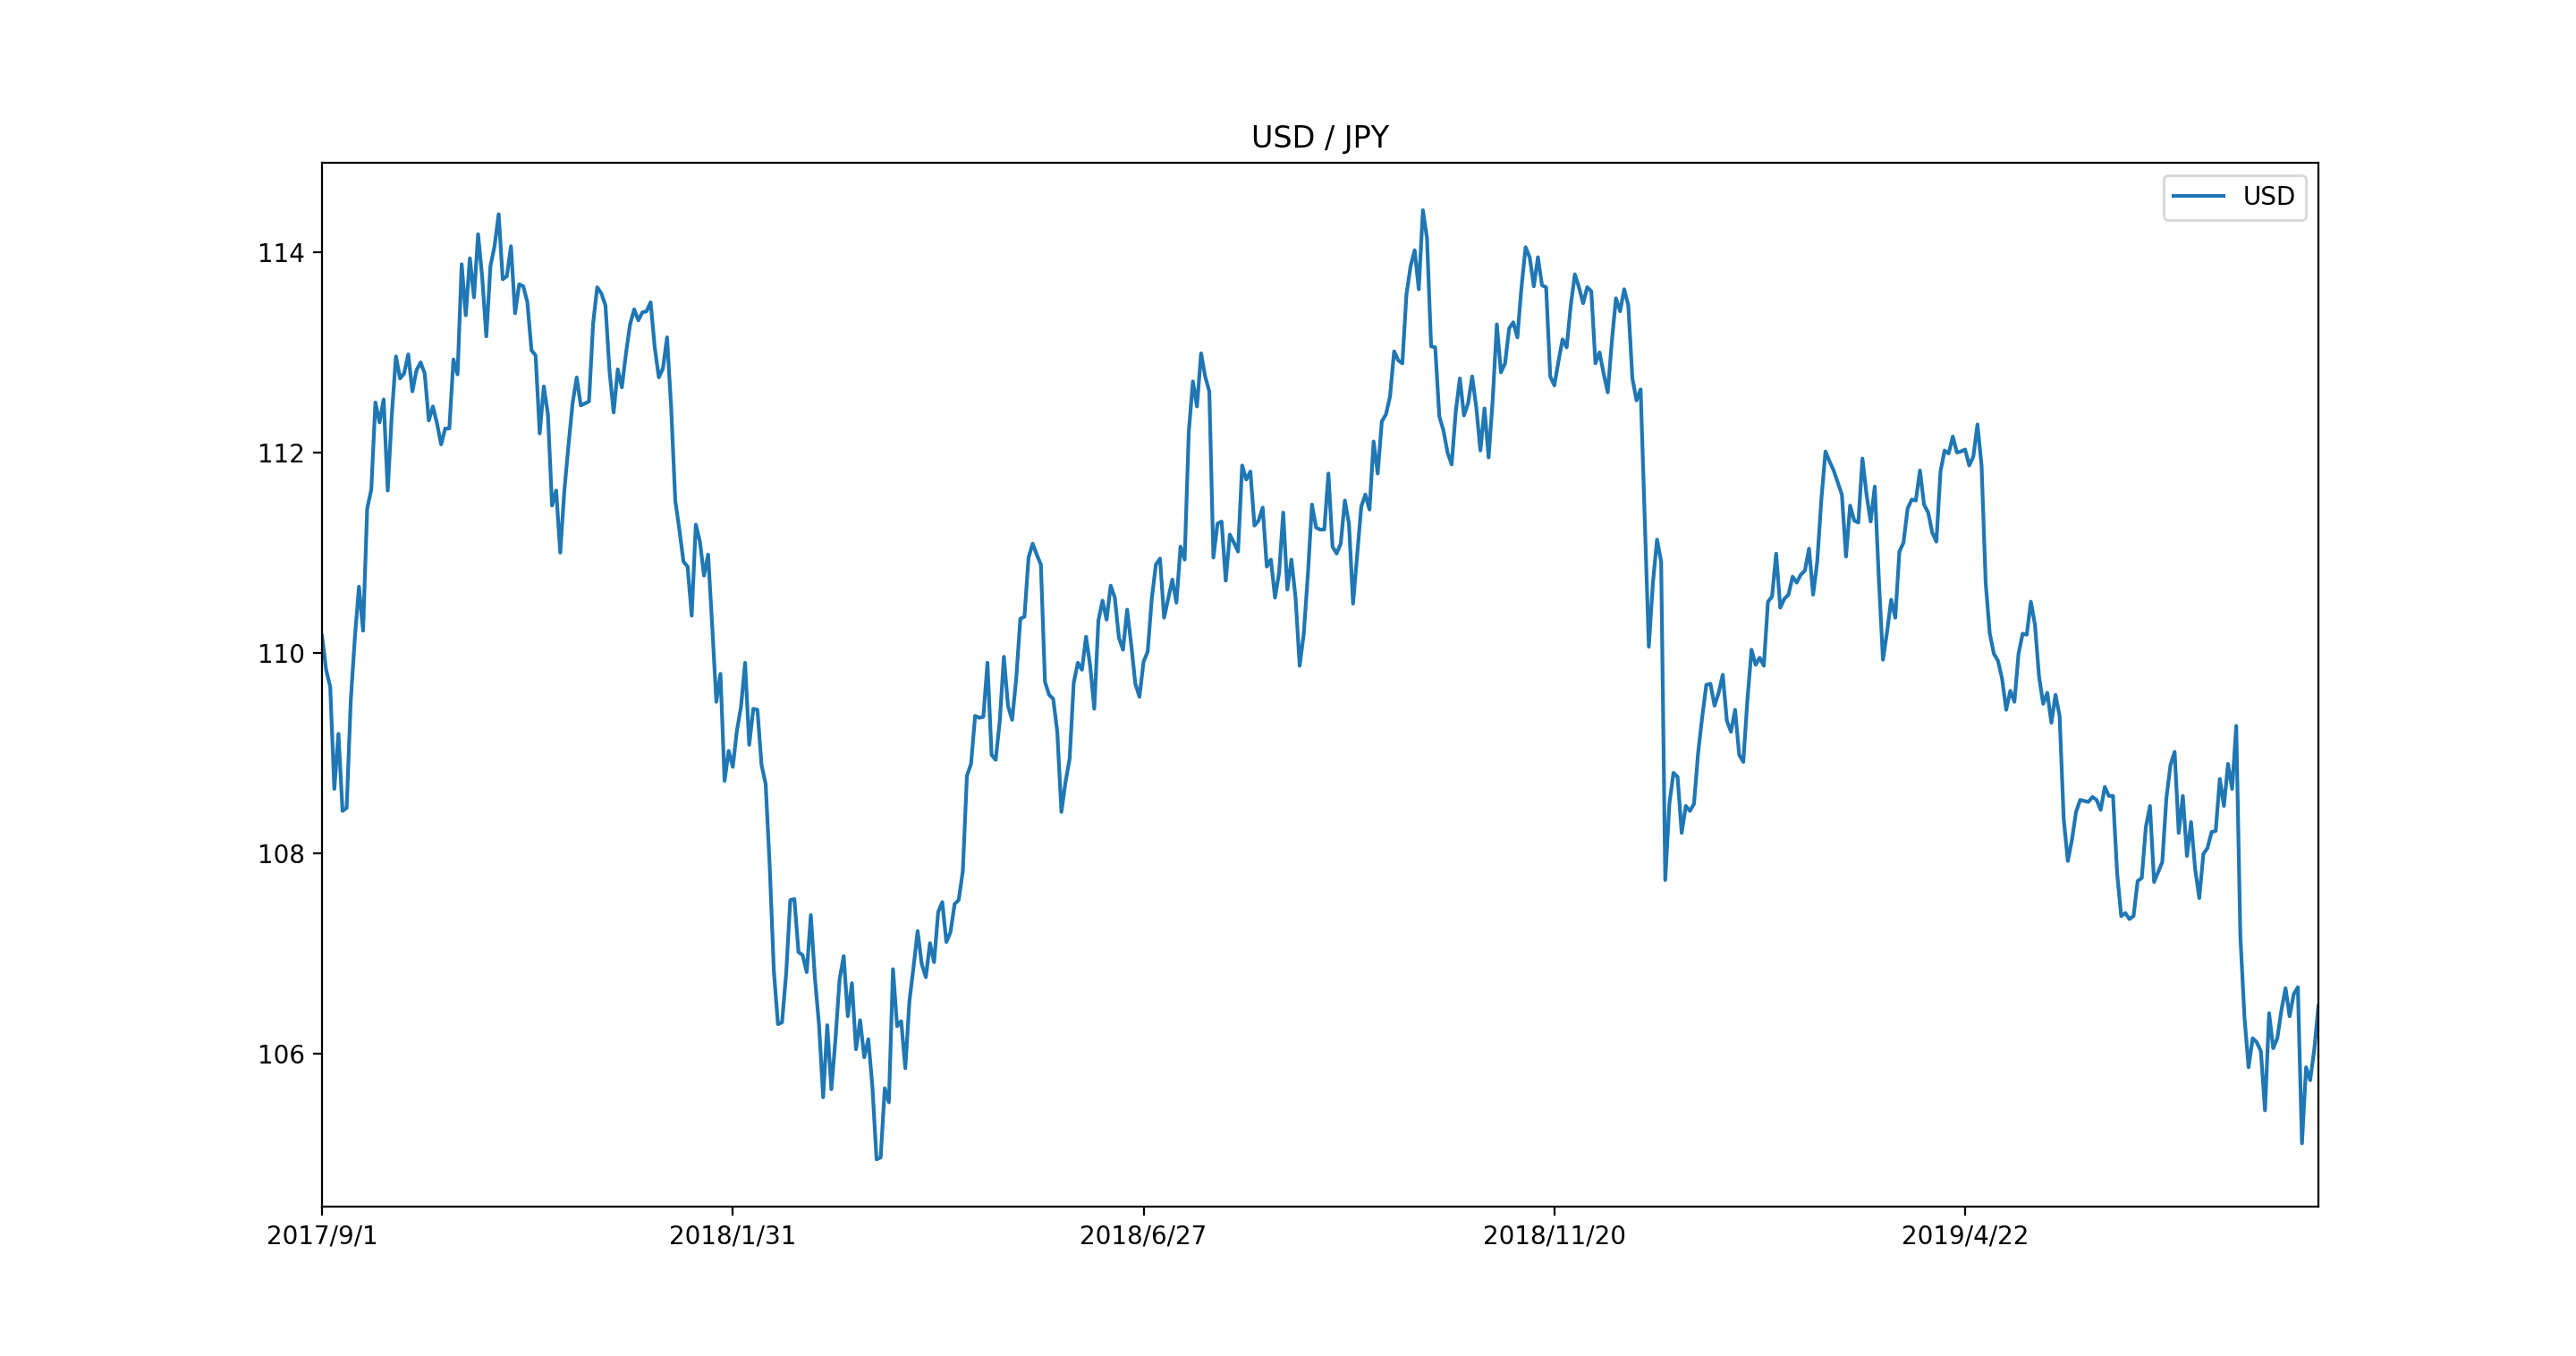
17年分だとグラフにした時にわかりにくいので、20179/1からのデータを新しくプロットした。

def everyday(data, nation, begin, end):
    """
    欲しい通貨のデータを返す
    Parameters
    ----------
    data : pandas DataFrame
        必要なデータ
    nation : chr
        欲しい国の通貨
    begin : int
        欲しいデータの開始日
    end : int
        欲しいデータの最終日 + 1

    Return
    ------
    everyday : pandas dataFrame
        日次データを返す
    """
    currency = data["{}".format(nation)]
    currency = currency.astype(float)
    if(end == "no"):
        currency  = currency[begin:]
    else:
        currency = currency[begin:end]
    currency = pd.DataFrame(currency)
    currency = currency.T
    (currency.T).plot(figsize=(12, 8), title="USD / JPY")
    return currency
5日移動平均線
5日移動平均線とは
5日移動平均線とは過去5日間の終値の平均値のことである。短期的なトレンドを表している。
メリットとしては線の動きで日ごとの終値の平均値が上昇しているか、下降しているかがすぐにわかる。
一方、過去の終値の平均値なので、上昇または下降トレンドを形成している場合、遅れがちになる。
2017/9/1から2019/8/31までの5日移動平均線をプロットした。

def five_days_moving_average(data, nation, begin, end):
    """
    5日移動平均を求める

    Parameters
    ----------
    data : pandas dataframe
        必要なデータ
    nation : chr
        欲しいデータの国名
    begin : int
        欲しいデータの開始日のindex
    end : int
        欲しいデータの最終日のindex + 1

    Return
    ------
    five_days : pandas DataFrame
        欲しい通貨の5日移動平均のデータ
    """
    currency = data["{}".format(nation)]
    currency = currency.T
    currency = currency.astype(float)
    if(end == "no"):
        partOfDate = currency[begin:]
    else:
        partOfDate = currency[begin:end]

    five_days = []
    for i in range(len((partOfDate.values).tolist()) - 4):
        five_days.append(mean((partOfDate.values).tolist()[i:i + 5]))

    date = list(partOfDate.index)
    five_days = pd.Series(five_days, index=date[4:])
    five_days = pd.DataFrame(five_days).T
    five_days.index = ["five days"]
    (five_days.T).plot(figsize=(12, 8), title="five days moving average")
    return five_days
25日移動平均線
25日移動平均線とは
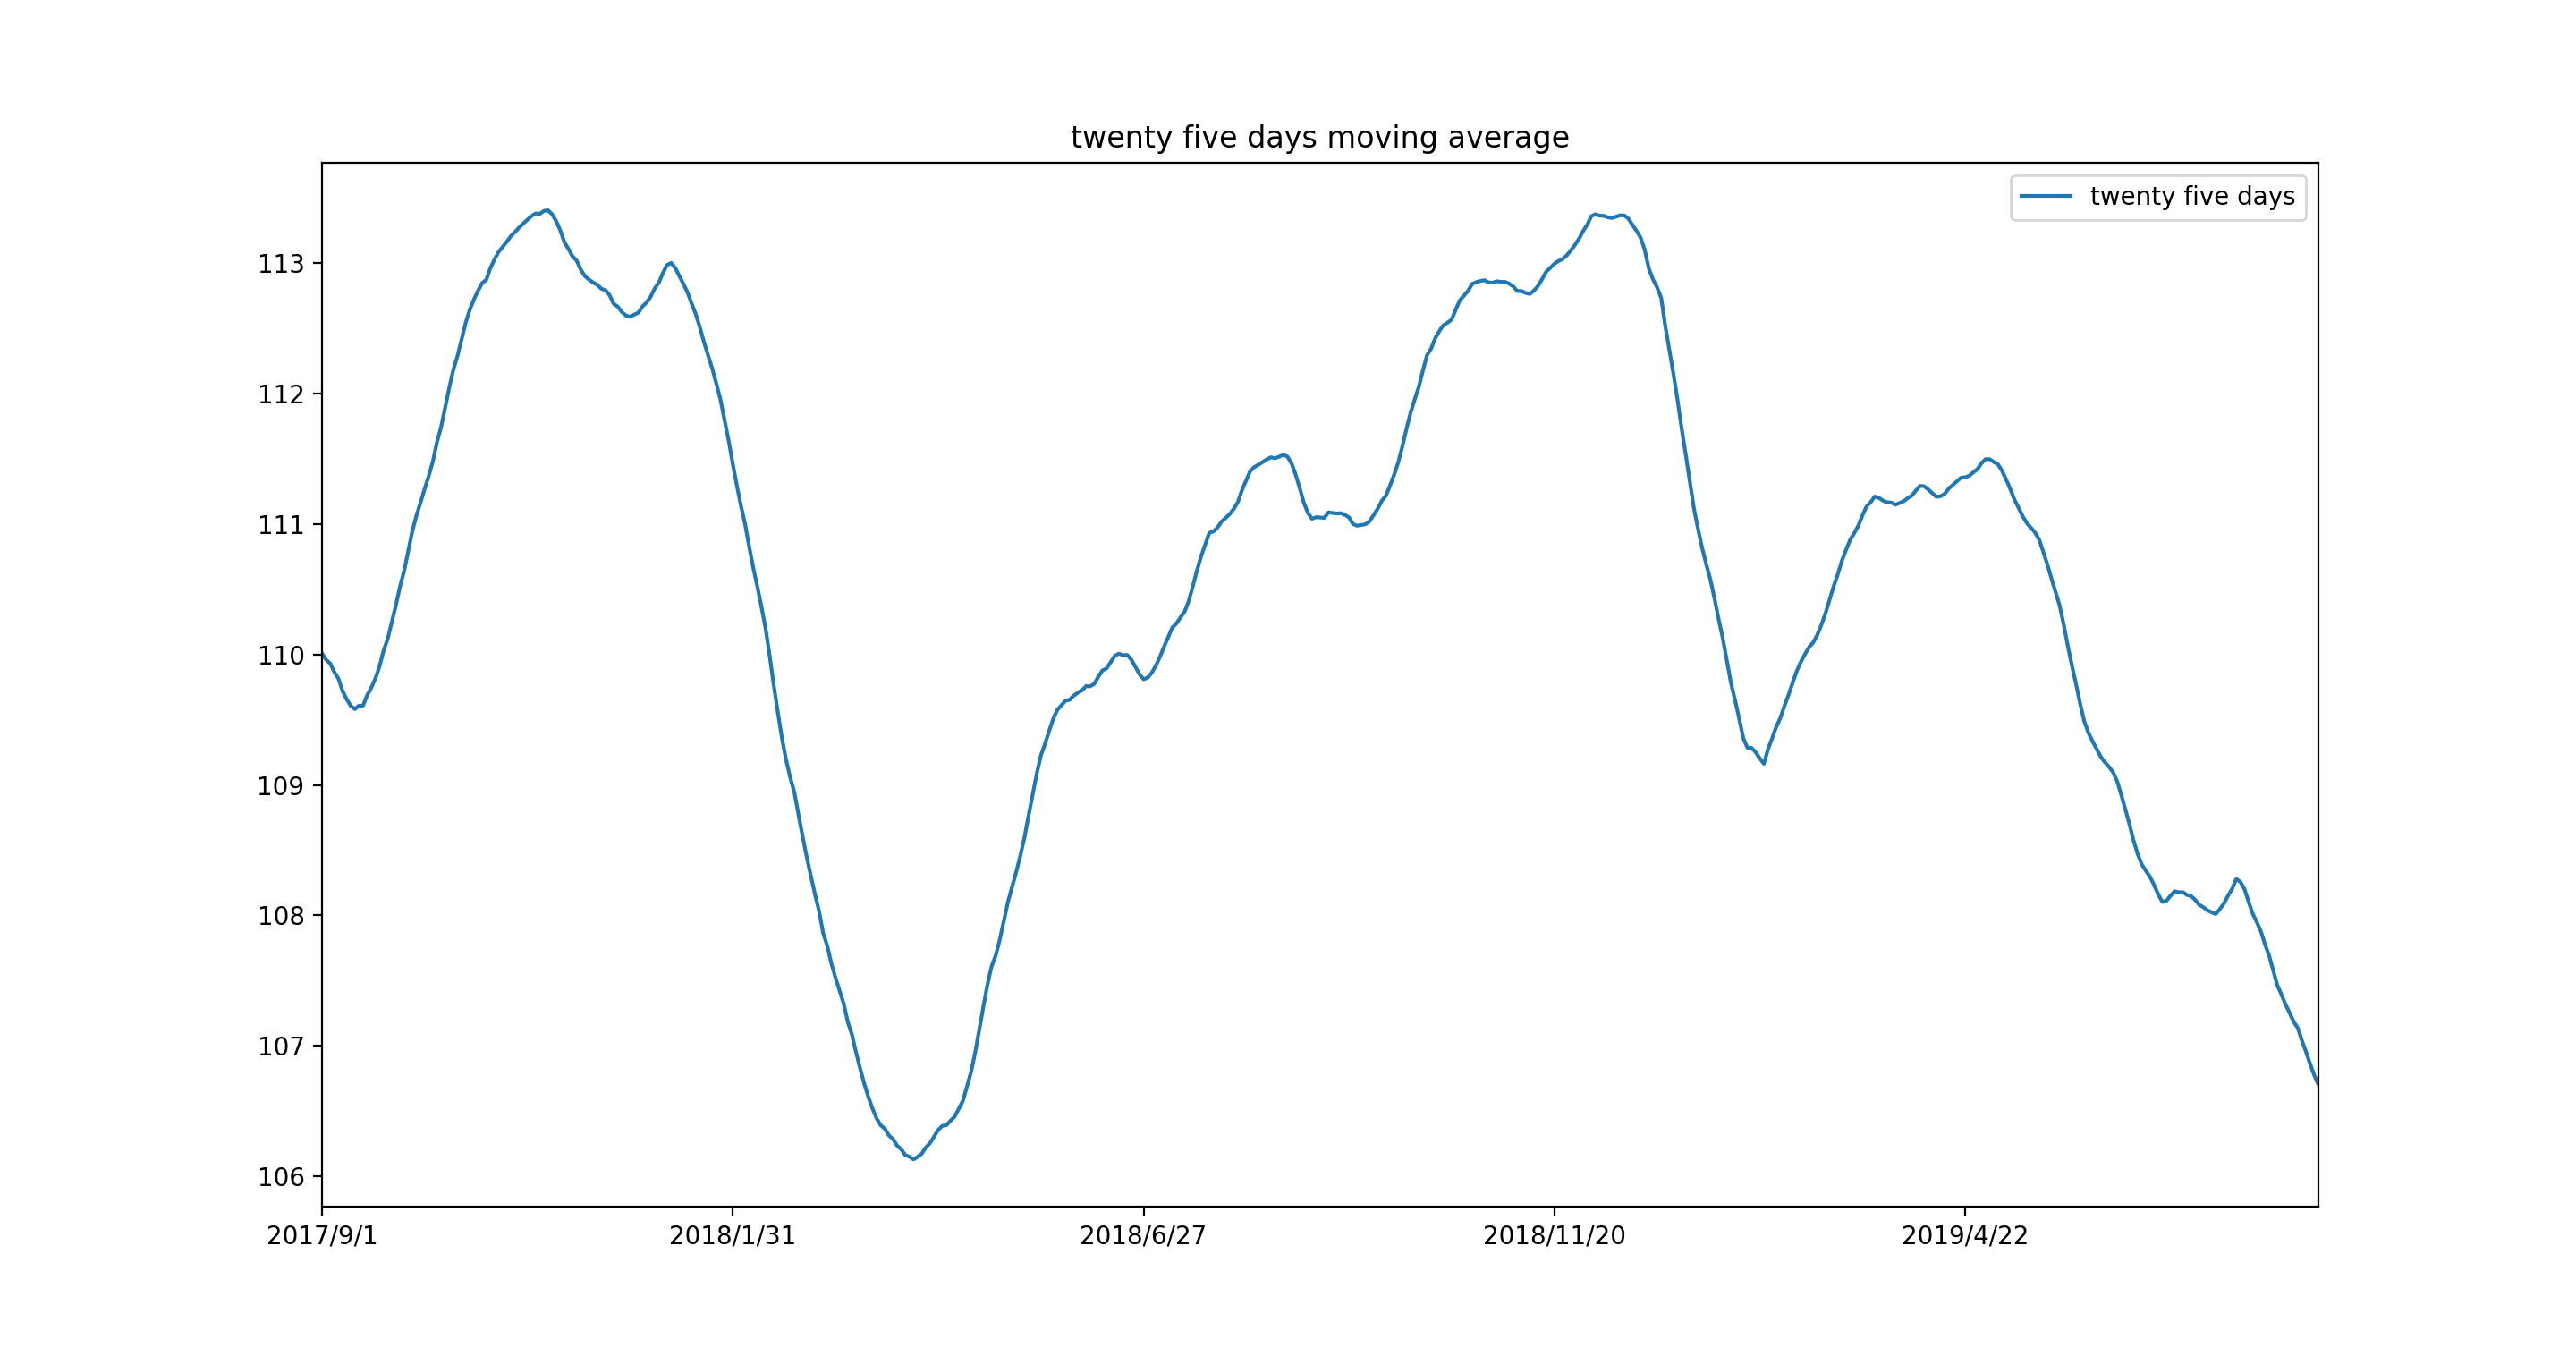
25日移動平均線とは過去25日間の終値の平均値である。5日移動平均線が短期的なトレンドを表していたのに対し、中長期的なトレンドを表している。
2017/9/1から2019/8/31までの25日移動平均線をプロットした。

def twenty_five_days_moving_average(data, nation, begin, end):
    """
    25日移動平均を求める

    Parameters
    ----------
    data : pandas dataframe
        必要なデータ
    nation : chr
        欲しいデータの国名
    begin : int
        欲しいデータの開始日のindex
    end : int
        欲しいデータの最終日のindex + 1

    Return
    ------
    five_days : pandas DataFrame
        欲しい通貨の25日移動平均のデータ
    """
    currency = data["{}".format(nation)]
    currency = currency.T
    currency = currency.astype(float)
    if(end == "no"):
        partOfDate = currency[begin:]
    else:
        partOfDate = currency[begin:end]

    twenty_five_days = []
    for i in range(len((partOfDate.values).tolist()) - 24):
        twenty_five_days.append(mean((partOfDate.values).tolist()[i:i + 25]))

    date = list(partOfDate.index)
    twenty_five_days = pd.Series(twenty_five_days, index=date[24:])
    twenty_five_days = pd.DataFrame(twenty_five_days).T
    twenty_five_days.index = ["twenty five days"]
    (twenty_five_days.T).plot(figsize=(12, 8), title="twenty five days moving average")
    return twenty_five_days
ゴールデン・クロスとデッドクロス
ゴールデン・クロスとは
ゴールデン・クロスとは5日移動平均線(短期的トレンド)が25日移動平均線(中長期的トレンド)を下から上へとクロスしたタイミングで買いサインを表すものである。
デッド・クロスとは
デッド・クロスとは5日移動平均線(短期的トレンド)が25日移動平均線(中長期的トレンド)を上から下へとクロスしたタイミングで売りサインを表すものである。
5日移動平均線と25日移動平均線を重ね合わせてみる。すると、青色の5日移動平均線と25日移動平均線が交わっているところがある。赤い丸がゴールデン・クロスを表しており、緑の丸がデッド・クロスを表している。

終わりに
なるべく視覚的にわかるようにしました。
まだまだテクニカル分析のうち簡単なものですが、これからどんどん他の分析手法を実装していきたいと思います。コードにつきましては、githubにあげる予定です。