こんにちは、Mottyです。
今回はPythonを使った回帰分析について記載しました。
回帰分析(Regression)
回帰分析は手元にあるデータを用いて、目的となるデータの予測する手法。その際に、データに定量的な関係の構造を当てはめる(回帰モデル)。また回帰モデルが直線であれば回帰直線、多項式回帰によってn次関数を当てはめた場合は回帰曲線という。
モデルの決定方法
当てはめたモデルの評価方法は最小二乗法を用います。測定で得られたデータを直線等の関数で近似する際、残差の2乗和が最小となるような係数の選び方を行う手法。
評価法
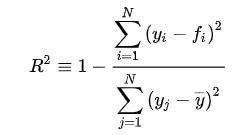
決定係数を用いる。こちらの数字が大きければ多いほど、回帰モデルの実データへの当てはまりが良い。
観測値= y, 関数による推定値をfとすると、以下の式で表される。

モデルが完全にデータにフィットした場合、決定係数の値は1となる。
回帰
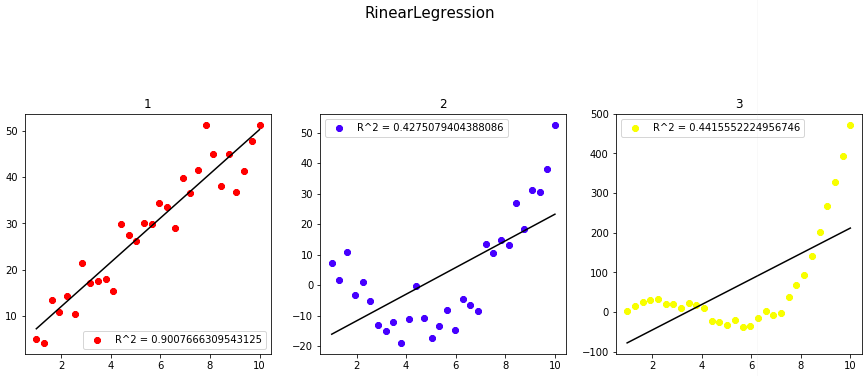
一次関数、二次関数、三次関数それぞれにノイズを加えたデータに
回帰直線を当てはめてみた。
import numpy as np
import matplotlib.pyplot as plt
%matplotlib inline

# sklearn
from sklearn.linear_model import LinearRegression as reg
from sklearn.metrics import r2_score

# データ関連
CI =["black","red","blue","yellow","green","orange","purple","skyblue"]#ColorIndex

N = 30 #サンプル数
x = np.linspace(1,10,N)
y1 = x *5 + np.random.randn(N)*5
y2 =  2*(x-2)*(x-7) +   np.random.randn(N)*5
y3 =  3*(x-1)*(x-4)*(x-7) +  np.random.randn(N)*10

x = x.reshape([-1,1])
y1 = y1.reshape([-1,1])
y2 = y2.reshape([-1,1])
y3 = y3.reshape([-1,1])

# 学習
clf1, clf2, clf3 = reg(),reg(),reg()
clf1.fit(x,y1),clf2.fit(x,y2),clf3.fit(x,y3)

# xデータに対する予測値
y1_pred,y2_pred,y3_pred = clf1.predict(x),clf2.predict(x),clf3.predict(x)

# 描画
fig = plt.figure(figsize = (15,15))
ax1,ax2,ax3 = fig.add_subplot(3,3,1),fig.add_subplot(3,3,2),fig.add_subplot(3,3,3)
# Data
ax1.scatter(x,y1,c = CI[1],label = "R^2 = {}".format(r2_score(y1,y1_pred)))
ax2.scatter(x,y2,c = CI[2],label = "R^2 = {}".format(r2_score(y2,y2_pred)))
ax3.scatter(x,y3,c = CI[3],label = "R^2 = {}".format(r2_score(y3,y3_pred)))
ax1.legend(),ax2.legend(),ax3.legend()
# 回帰直線
ax1.plot(x,clf1.predict(x), c = CI[0])
ax2.plot(x,clf2.predict(x), c = CI[0])
ax3.plot(x,clf3.predict(x), c = CI[0])

fig.suptitle("RinearLegression", fontsize = 15)
ax1.set_title("1")
ax2.set_title("2")
ax3.set_title("3")
当然ですが、直線の当てはまりは、一次関数に対してもっとも良いという結果が得られました。
多項式回帰
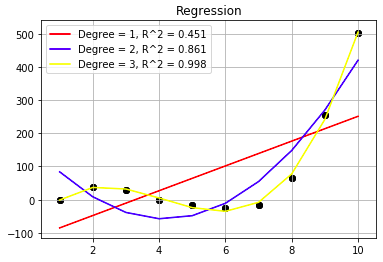
2や3などのデータセットに対しては多次関数のような回帰曲線を当てはめるのが適切だと言えるでしょう。
import numpy as np
import matplotlib.pyplot as plt
%matplotlib inline
from sklearn.linear_model import LinearRegression as reg
from sklearn.metrics import r2_score
from sklearn.preprocessing import PolynomialFeatures as PF


# データ関連
CI =["black","red","blue","yellow","green","orange","purple","skyblue"]#ColorIndex
N = 10 #サンプル数
x = np.linspace(1,10,N)
y3 =  3*(x-1)*(x-4)*(x-7) +  np.random.randn(N)*10
x = x.reshape([-1,1])
y3 = y3.reshape([-1,1])


# 学習
clf = reg()
clf.fit(x,y3)
# 次数
DegreeSet =[1,2,3]
for dg in DegreeSet:

    pf = PF(degree = dg, include_bias = False)
    x_poly = pf.fit_transform(x)
    poly_reg = reg()
    poly_reg.fit(x_poly,y3)
    polypred = poly_reg.predict(x_poly)

    #xデータに対する予測値
    pred = clf.predict(x)
    #描画
    plt.scatter(x,y3,c = CI[dg], label = "R^2={}".format(r2_score(y3,polypred)))
    plt.plot(x, polypred,c = CI[0])
    plt.legend()
    plt.title("Regression")
    plt.show()
結果的には、次数を1,2,3と上げるごとにモデルの当てはまりがよく、決定係数も高かった。
次数を上げれば良いのか?
次数を上げれば上げるほどモデルの表現力が増え、データへの当てはまりがよくなるが、次数が高くなるとそれだけ汎化性能が落ちてしまう(過学習)。
このような問題を解決するには単純な線形回帰、AIC等の罰則項を加えたものを用いると良い。
(データのモデルへの当てはめをAIC最小化問題に帰着させた際、
式を見ればわかるように次数の上昇に対して罰則項が設けられ、最適な次数が選定できる。)
sklearnにちょうどいいライブラリがなかったので、こちらの続きとして自作AICを用いたモデル評価を行う予定とします。

