はじめに
自分のportfolioに「接ぎ木する感じ」で書いていく
https://github.com/duri0214/portfolio
普段は株価情報を主に表現しているのが portfolio の Let's analyze Vietnam! だ。
今回は、ベトナムのガチンコの統計局が出している情報(GPTや消費者物価指数とか)をプラスしたい(機能追加の前に、CIの設定とかcronが動かないとかで機能追加のやる気が起きなくて1年ぐらい溶かしてしまった。ようやく「業務的な機能追加」ができる![]() )
)
もちろんベトナム語なんてわからんから翻訳を駆使していくゥ!
| 翻訳前 | 翻訳後 |
|---|---|
 |
 |
FAOSTAT FoodBalanceRanker Trend
FAOとは?
国際連合食糧農業機関(FAO)が運営する世界 最大かつ包括的な食料・農林水産業関連のオンライン統計 データベース
データの理解
FAOからデータを取得するというのはもともとのTODOとしてあって、着手するときにたしか最初、このページを見つけたんだよな
https://www.fishprotein.net/letter/t0015/
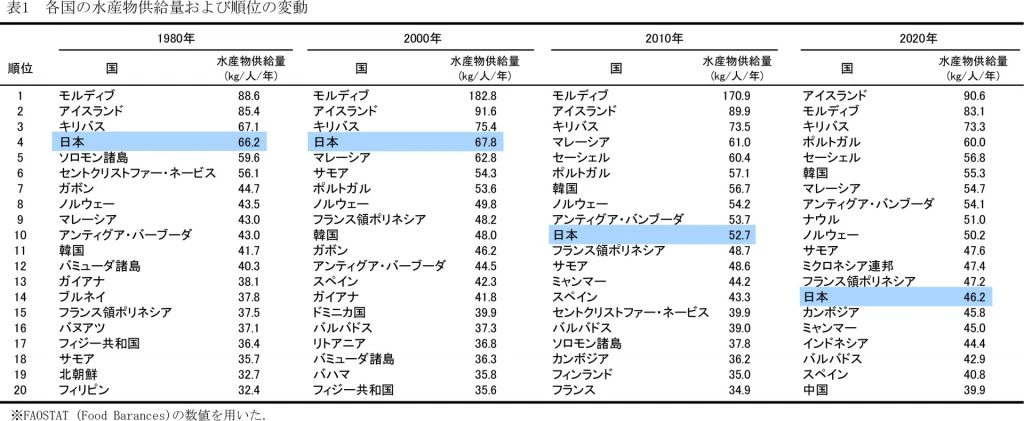
たしかに、ある国の水産物供給量の推移を見れば、「さかなで稼ぐようになったのかもしれない」なんていう示唆が得られるかもしれない。
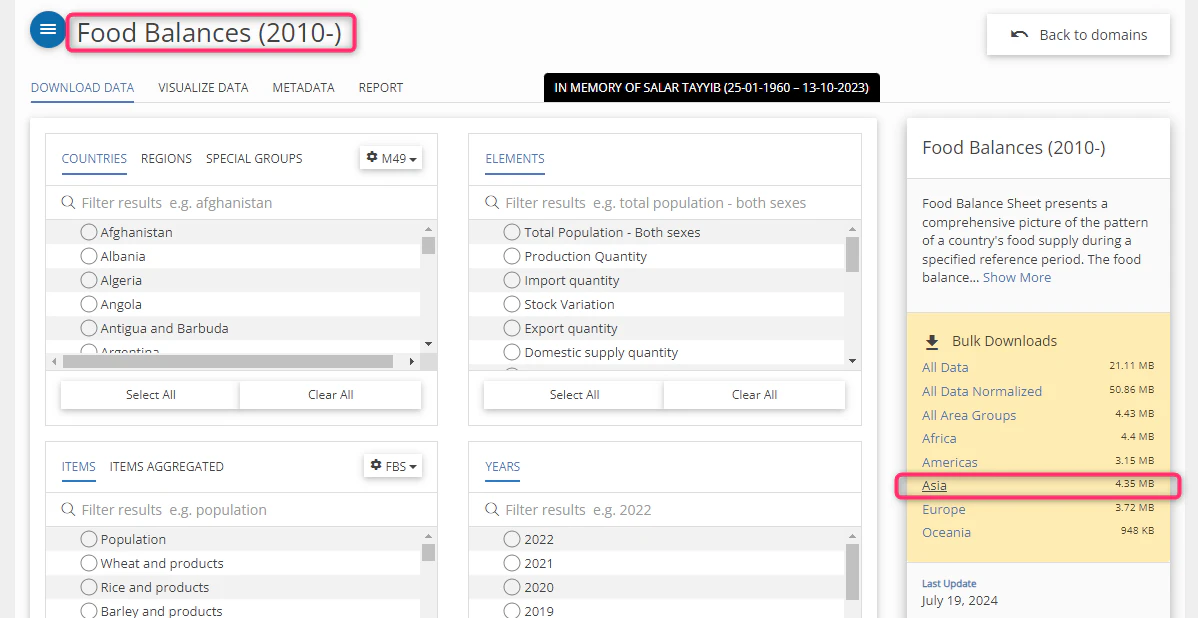
FAOSTATでいろいろページを見て回ったけど、以下のzipのなかみがそれっぽいものだとわかった。バッチを流したタイミングで、オンザフライダウンロードして処理するかたちにしよう。どうやらAPIはなさそうだ。
https://www.fao.org/faostat/en/#data/FBS/visualize
バッチ作成
Djangoでのバッチ処理の知識はある前提する
https://qiita.com/YoshitakaOkada/items/3b5da2d77e54d833dac6
作る処理自体はシンプル。こういうのは「なにをするのかの決め」「データの取り扱いを理解する」のほうが時間かかる。
monthly_fao_food_balance_chart.py
import io
import re
import zipfile
from pathlib import Path

import pandas as pd
import requests
from django.core.management.base import BaseCommand

from lib.log_service import LogService
from vietnam_research.models import FaoFoodBalanceRankers


class Command(BaseCommand):
    help = "fao_food_balance_chart"

    def handle(self, *args, **options):
        FaoFoodBalanceRankers.objects.all().delete()
        zip_url = (
            "https://bulks-faostat.fao.org/production/FoodBalanceSheets_E_Asia.zip"
        )
        response = requests.get(zip_url)

        with zipfile.ZipFile(io.BytesIO(response.content)) as z:
            with z.open("FoodBalanceSheets_E_Asia_NOFLAG.csv") as f:
                df = pd.read_csv(f, encoding="latin1").fillna(0)

        # 'Y2022' to 2022
        end_year_string = df.columns[-1]
        end_year = int(re.findall(r"\d+", end_year_string)[0])

        # ranking
        fao_food_balance_rankers: list[FaoFoodBalanceRankers] = []
        items = df["Item"].unique()
        for item in items:
            print(f"Processing item: {item}")
            df_filtered = df[
                (df["Item"] == item)
                & (df["Element"] == "Food supply quantity (kg/capita/yr)")
            ]
            for year in range(2010, end_year + 1):
                year_column = f"Y{year}"
                df_sorted = df_filtered.sort_values(year_column, ascending=False)
                for i, (_, row) in enumerate(df_sorted.iterrows()):
                    fao_food_balance_rankers.append(
                        FaoFoodBalanceRankers(
                            year=year,
                            rank=i + 1,
                            name=row["Area"],
                            item=row["Item"],
                            element=row["Element"],
                            unit=row["Unit"],
                            value=row[year_column],
                        )
                    )

        # bulk-insert
        chunk_size = 5000
        for i in range(0, len(fao_food_balance_rankers), chunk_size):
            print(
                f"Processing chunk {i//chunk_size + 1}/{len(fao_food_balance_rankers) // chunk_size}"
            )
            FaoFoodBalanceRankers.objects.bulk_create(
                fao_food_balance_rankers[i : i + chunk_size]
            )

        caller_file_name = Path(__file__).stem
        log_service = LogService("./result.log")
        log_service.write(
            f"{caller_file_name} is done.({len(fao_food_balance_rankers)})"
        )
models.py
    :
class FaoFoodBalanceRankers(models.Model):
    year = models.PositiveIntegerField()
    rank = models.PositiveIntegerField()
    name = models.CharField(max_length=255)
    item = models.CharField(max_length=255)
    element = models.CharField(max_length=255)
    unit = models.CharField(max_length=255)
    value = models.FloatField()
index.html
        :
    <div id="fao-stat-food-balance-trend" class="jumbotron">
        <h2 class="display-4">FAOSTAT FoodBalanceRanker Trend</h2>
        <p><a href="https://www.fao.org/faostat/en/#data/FBS/visualize" target="_blank">Food Balances (2010-)</a>
            から水産物供給量の推移 を使って推移グラフを作る</p>
        <ul>
            <li class="d-block"><b>Item:</b> Fish, Seafood</li>
            <li class="d-block"><b>Element:</b> Food supply quantity (kg/capita/yr)</li>
        </ul>
        <table class="table table-striped table-bordered">
            <thead>
            <tr>
                {% for header in fao_rank_trend.0.keys %}
                    <th>{{ header }}</th>
                {% endfor %}
            </tr>
            </thead>
            <tbody>
            {% for row in fao_rank_trend %}
                <tr>
                    {% for column, value in row.items %}
                        {% if value == "Viet Nam" %}
                            <td class="text-red-bold">{{ value }}</td>
                        {% else %}
                            <td>{{ value }}</td>
                        {% endif %}
                    {% endfor %}
                </tr>
            {% endfor %}
            </tbody>
        </table>
    </div>
        :
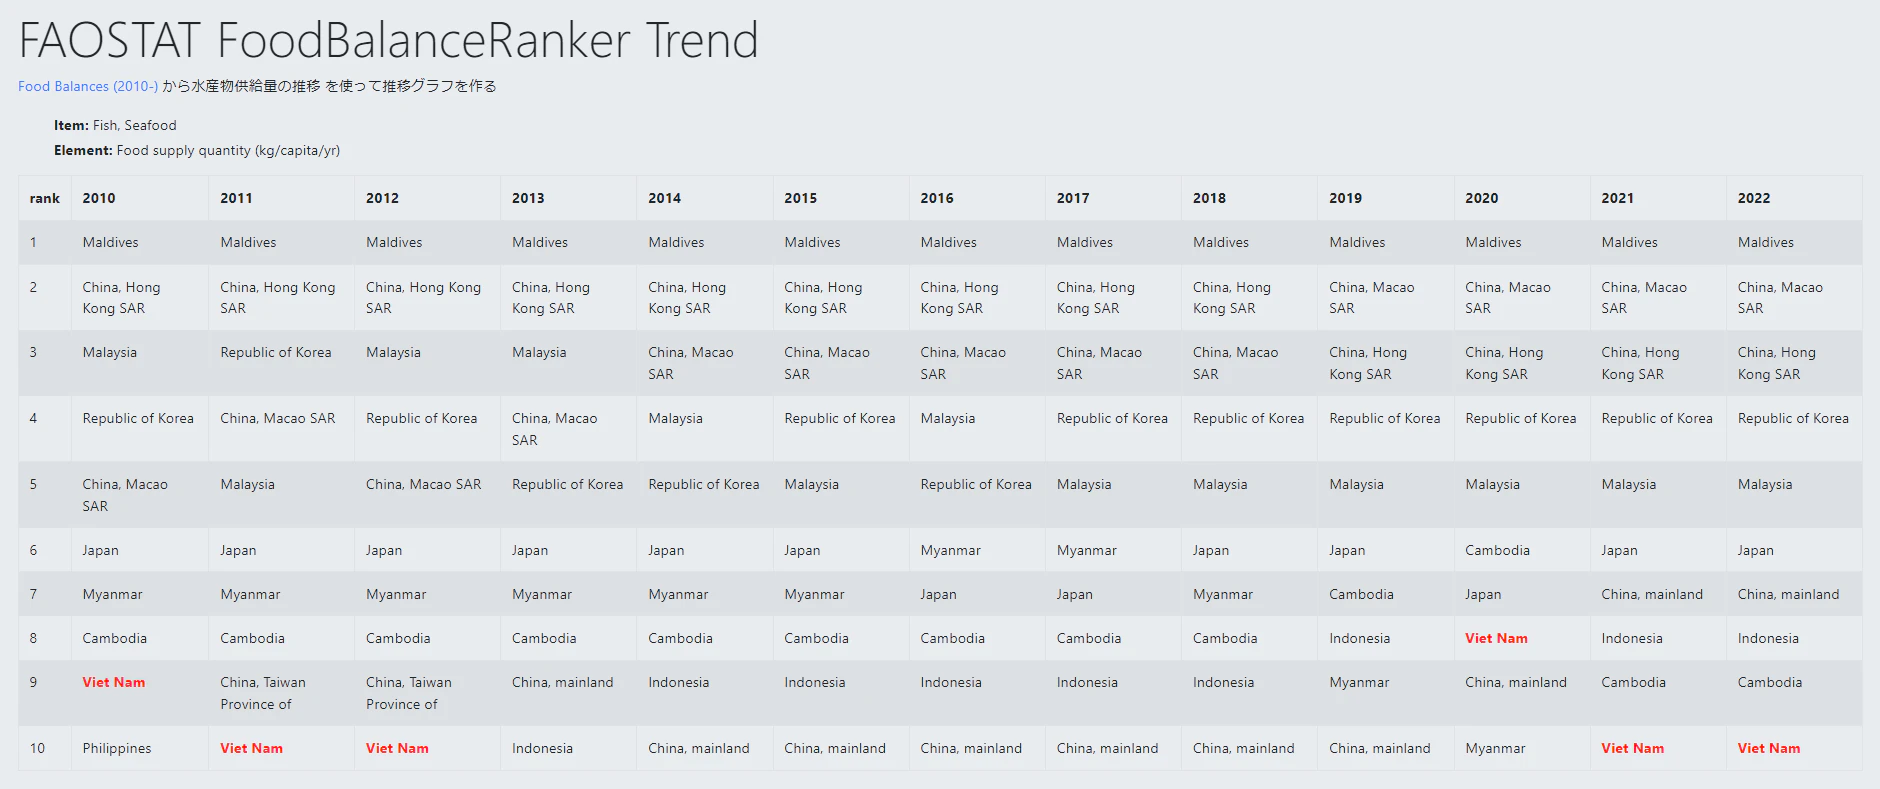
できました!ベトナムだけ赤く表示されていて、わかりやすいね!
(なんか最初の絵の、日本がダダ下がりするような感じはなかったなぁ。基本ずっと6位やん。時間が経ってfixしたのかなぁ![]() )
)
ベトナム経済指標
まずは鉱工業生産指数のデータが欲しい
鉱工業生産指数とは
鉱業・製造業の活動状況を把握するための経済統計です。景気が好転すれば、製造業の生産活動が活発になるため、鉱工業生産指数は上昇傾向をたどります。また、鉱工業生産指数が高まれば、株式市場では将来の景気好転、企業業績の向上を織り込んで、株価が上昇しやすくなります。
https://www.tokaitokyo.co.jp/otome/investment/glossary/detail_ko001.html
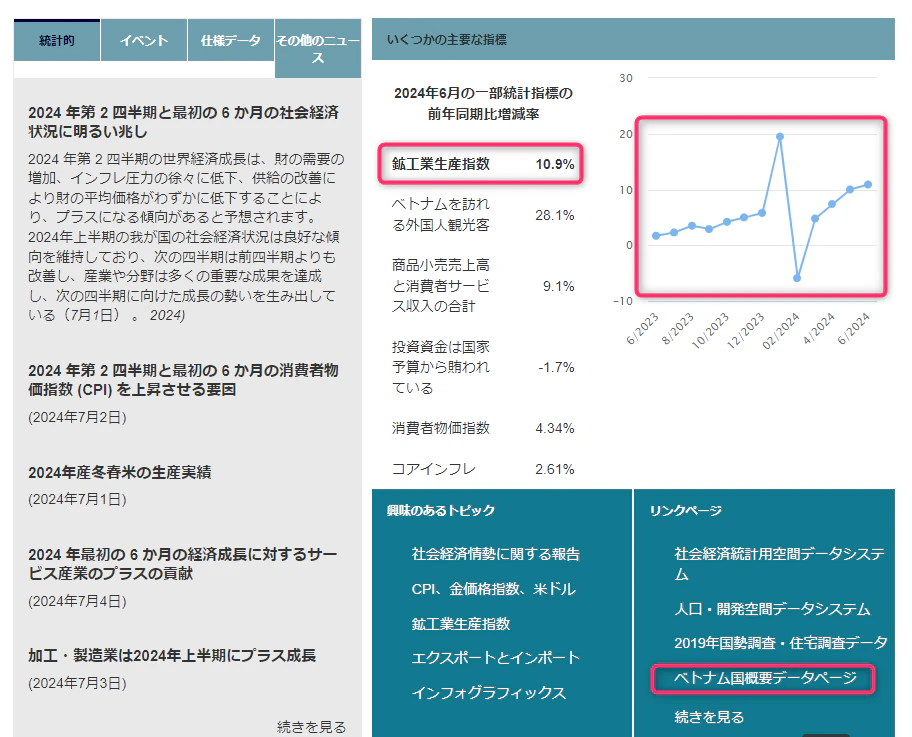
どうやら ベトナム国概要データページ に鉱工業生産指数があるようだ
データの理解
ベトナムでは、ピリオドは千の区切りとして使用され、カンマは小数点として使用されます
鉱工業生産指数
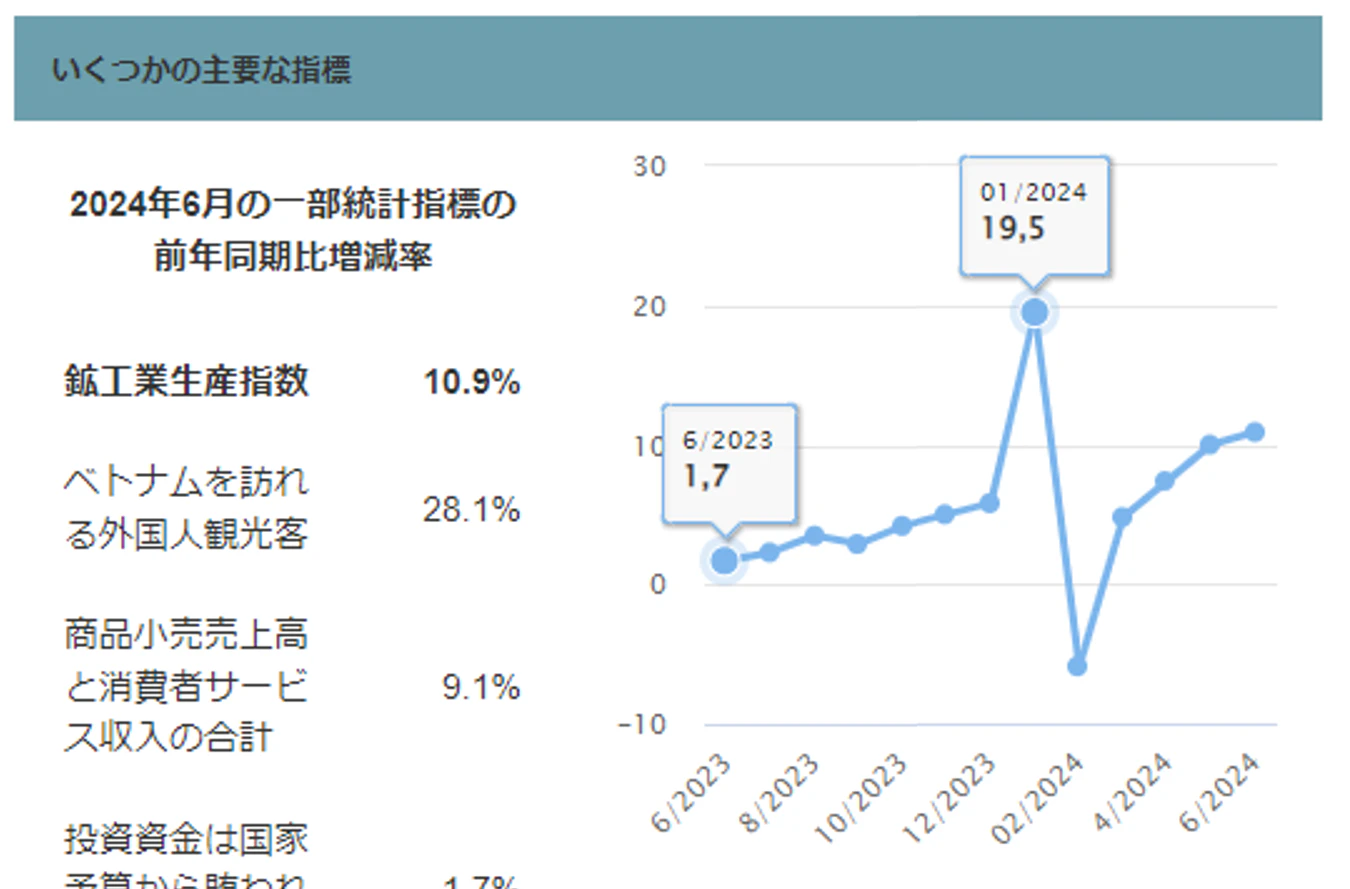
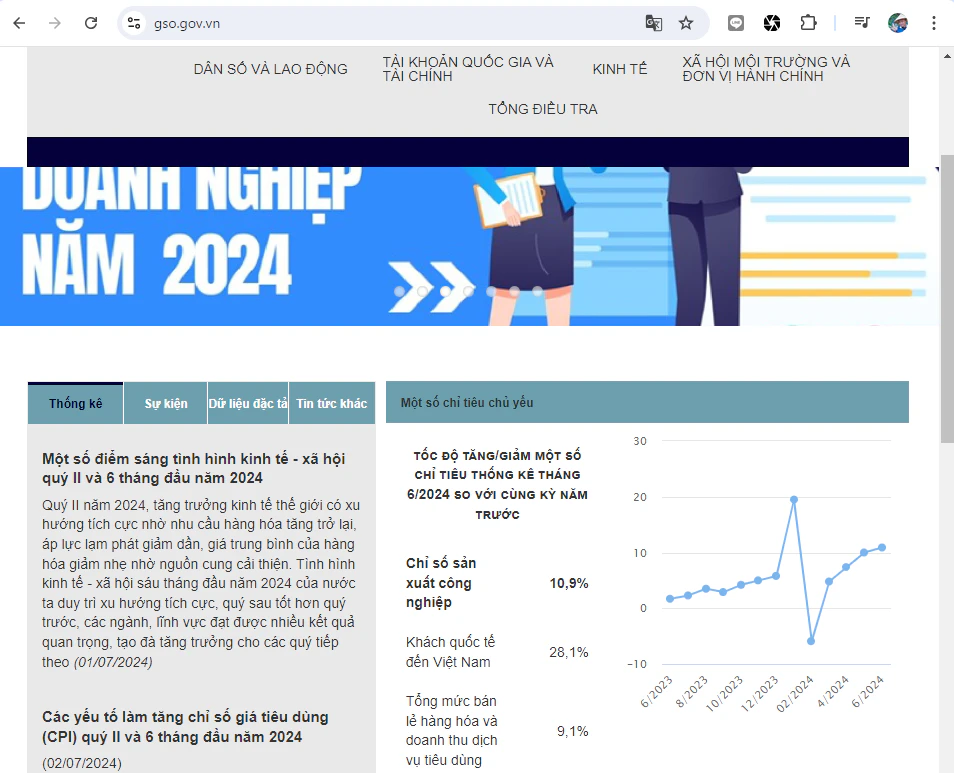
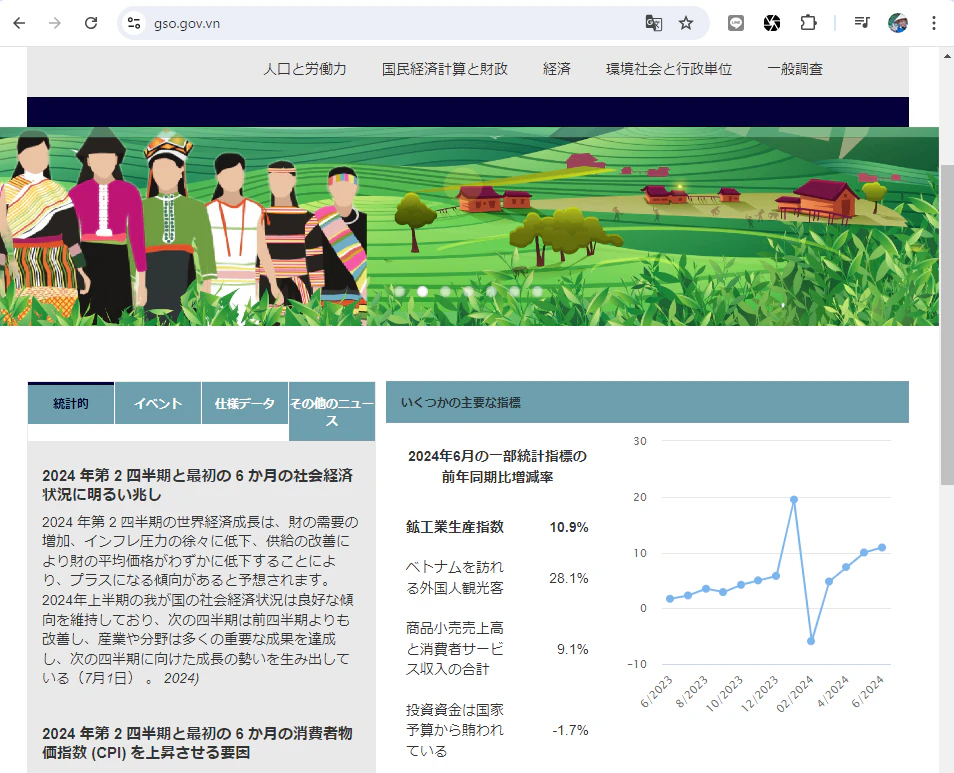
前年同期比増減率だから、2023-06 が 1.7%増、2024-01 が 19.5%増 なのね。
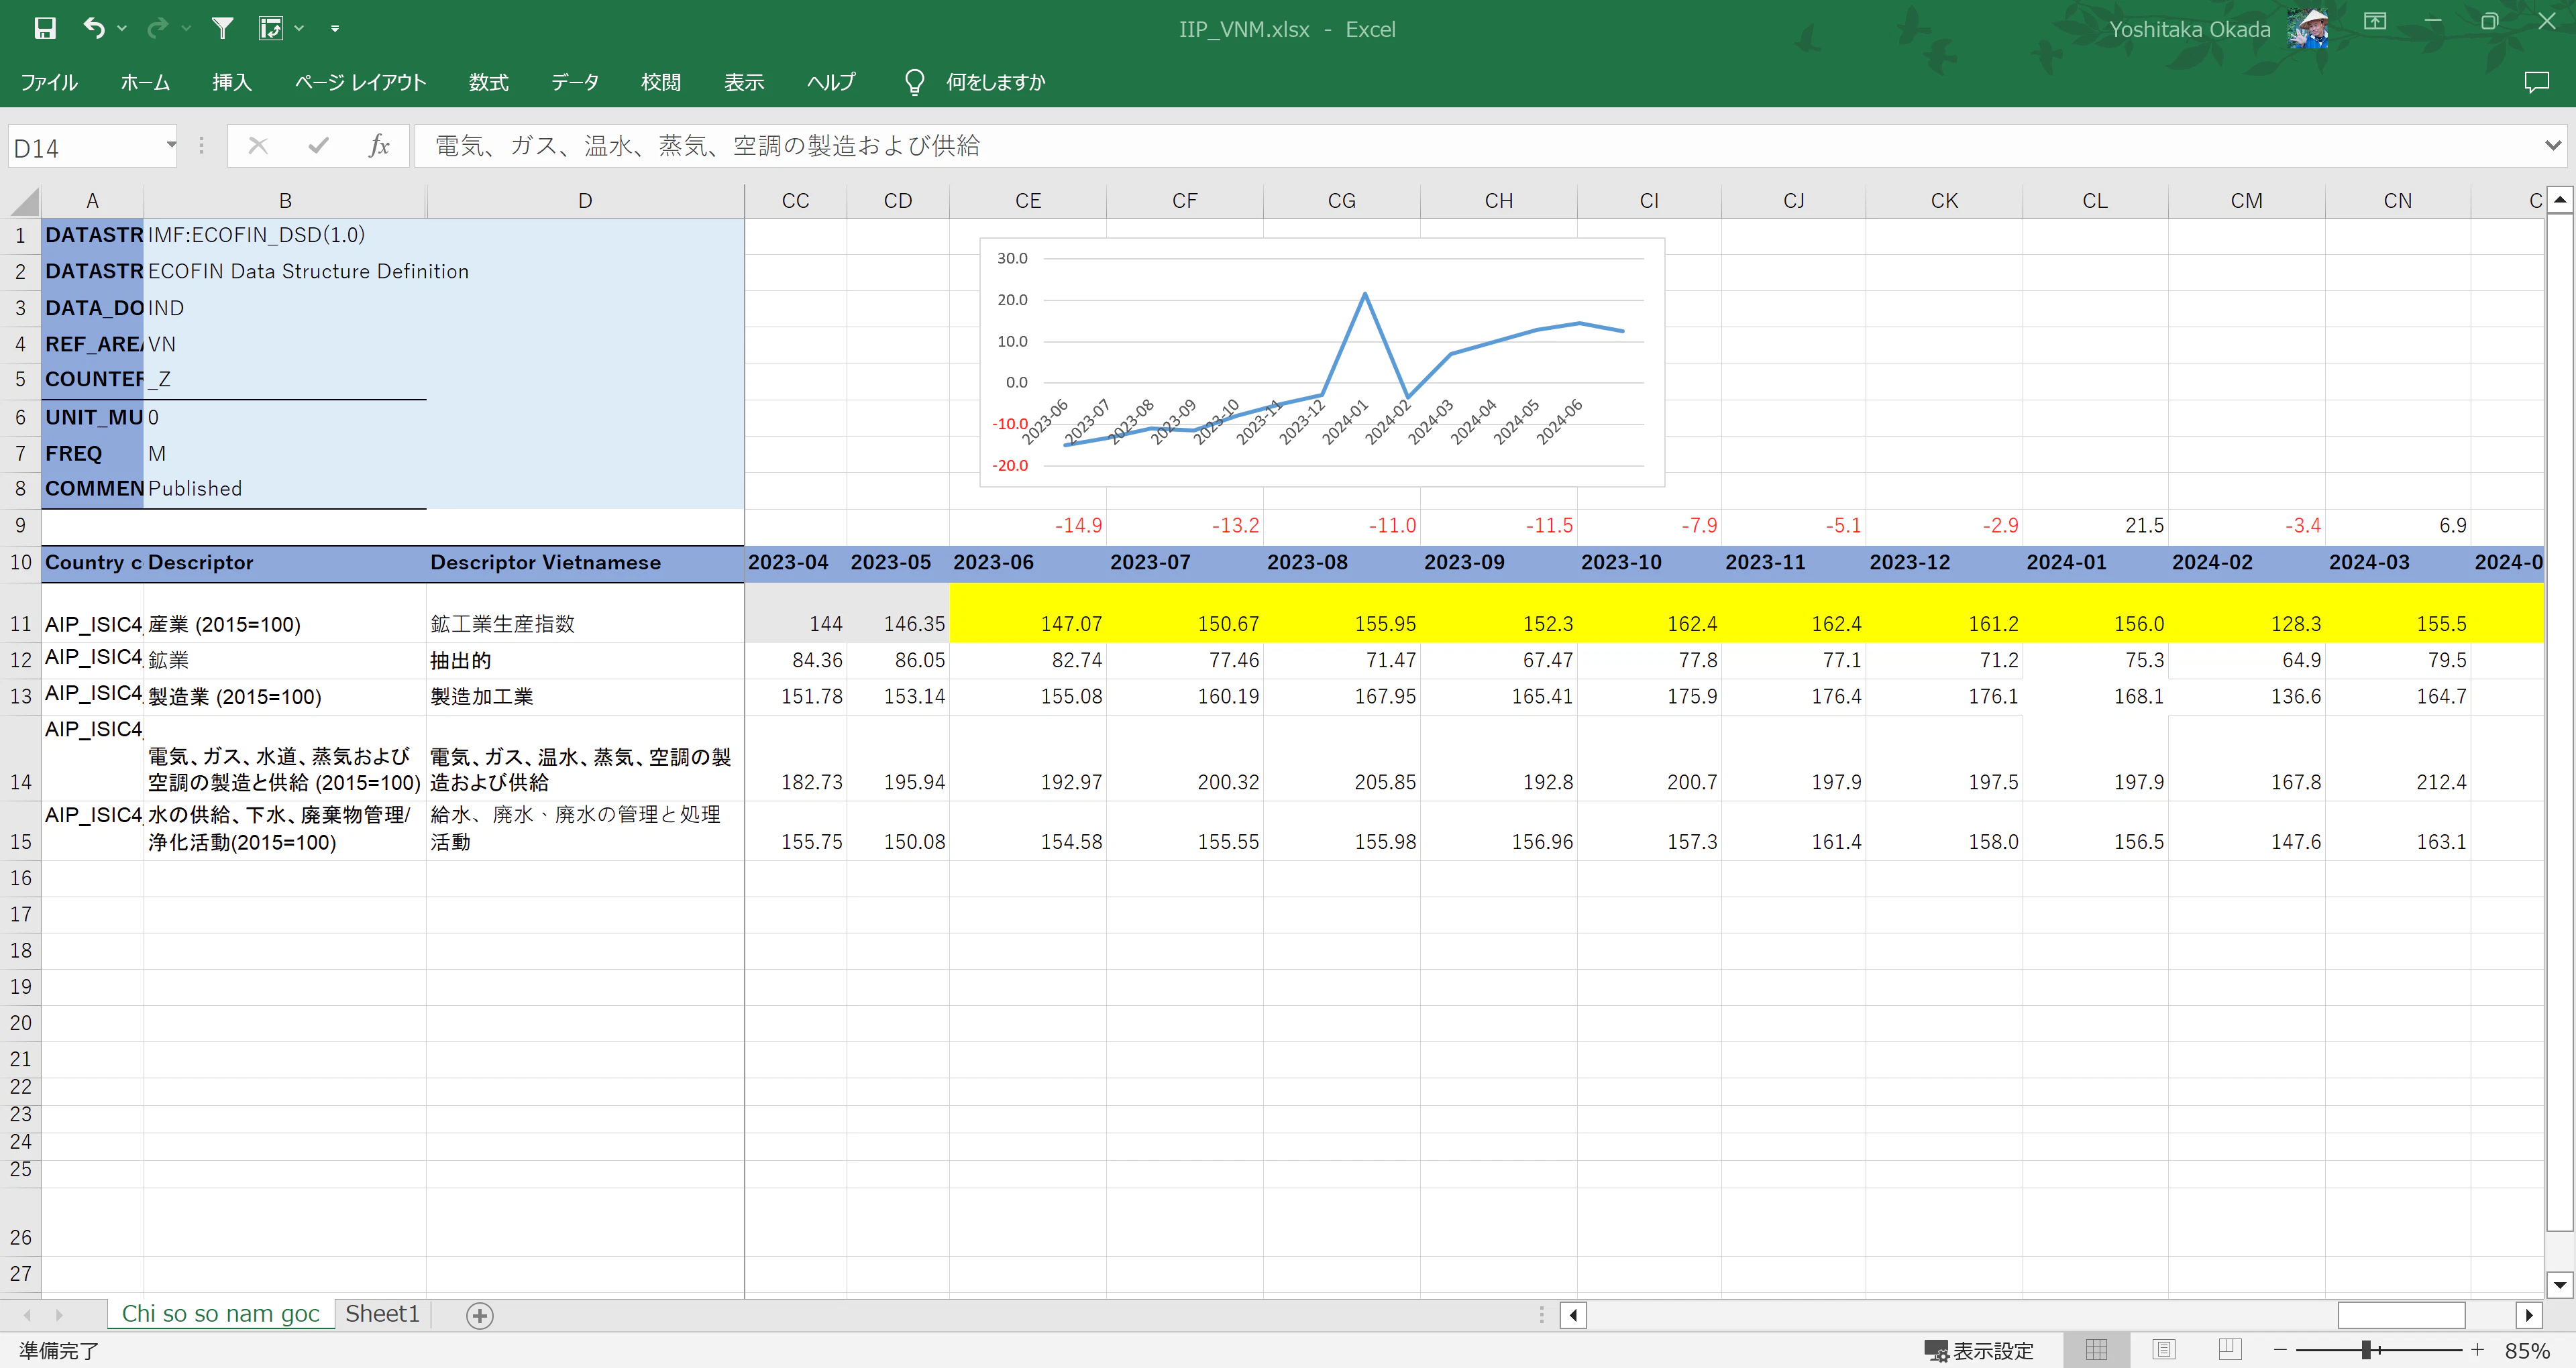
まずはexcelをダウンロードしてデータを見てみよう

前同の増減率はなるほど、こう出すのね
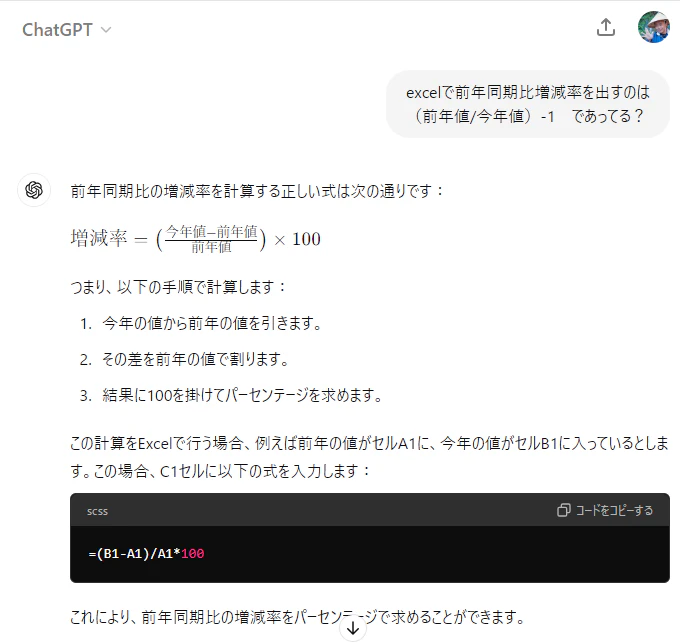
なんでか数字が違うんだよなー...補正されるのかなぁ ![]()
2023-06 が 14.9%減、2024-01 が 21.5%増
まぁでもグラフ的には同じトレンドに見えるから、これがあっているものとしよう。
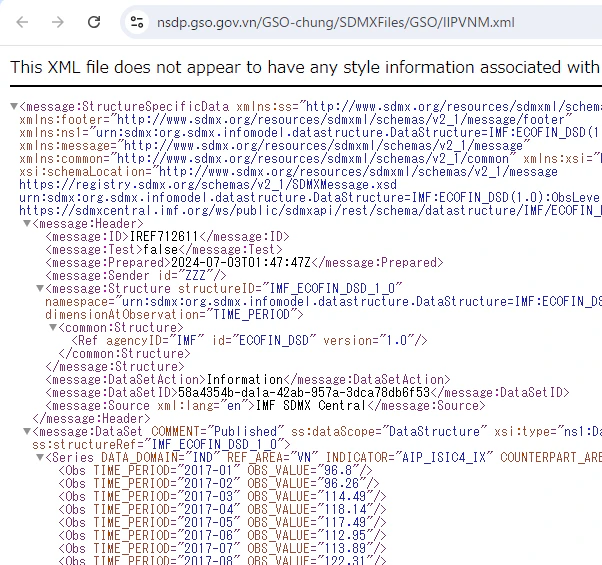
つぎはSDMXデータを見てみよう
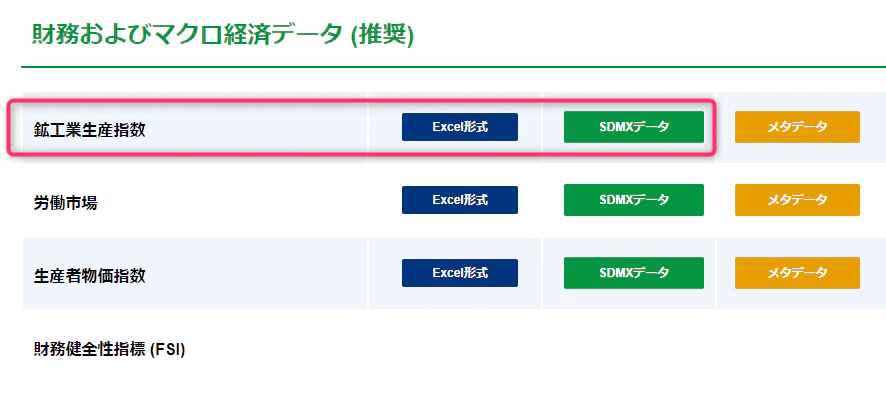
なるほど、xmlか。ということはここをrequestで取得しにいってデータ化できそうだな
消費者物価指数
消費者物価指数も同じようにできる
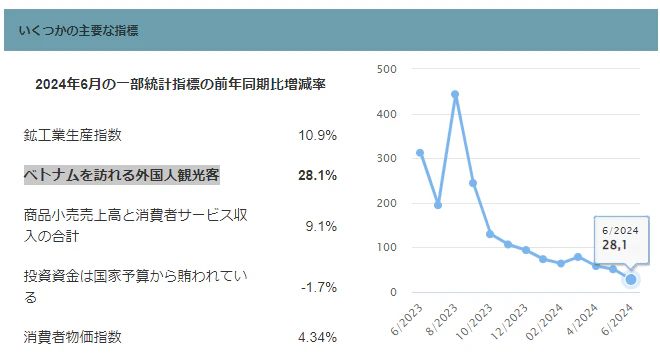
ベトナムを訪れる外国人観光客
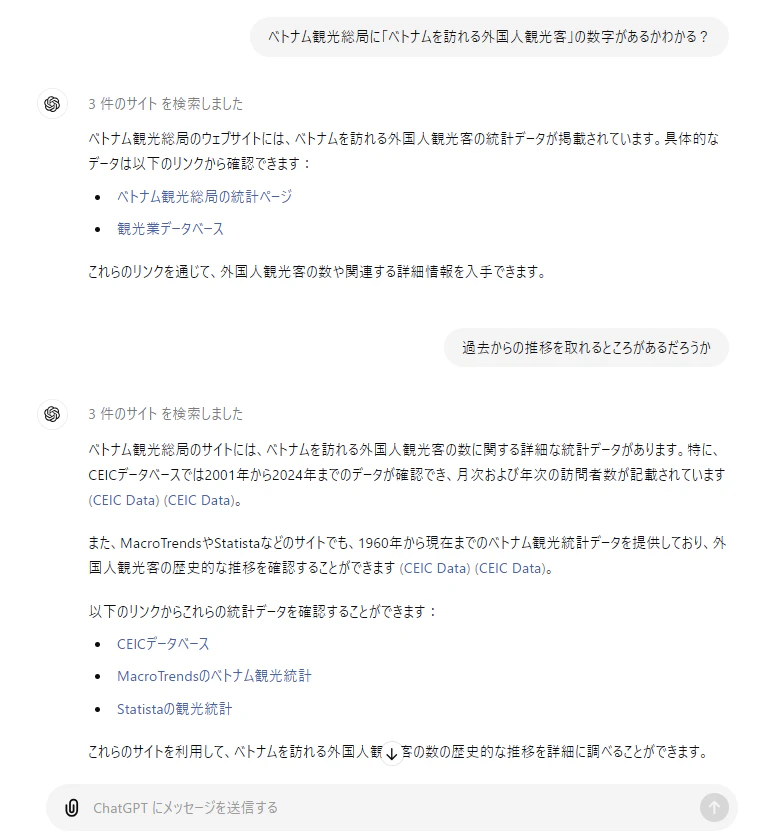
これ欲しいんだよなぁ データ見つけらんねぇ
ChatGPTも有料のところは紹介してくれるけど、うーん
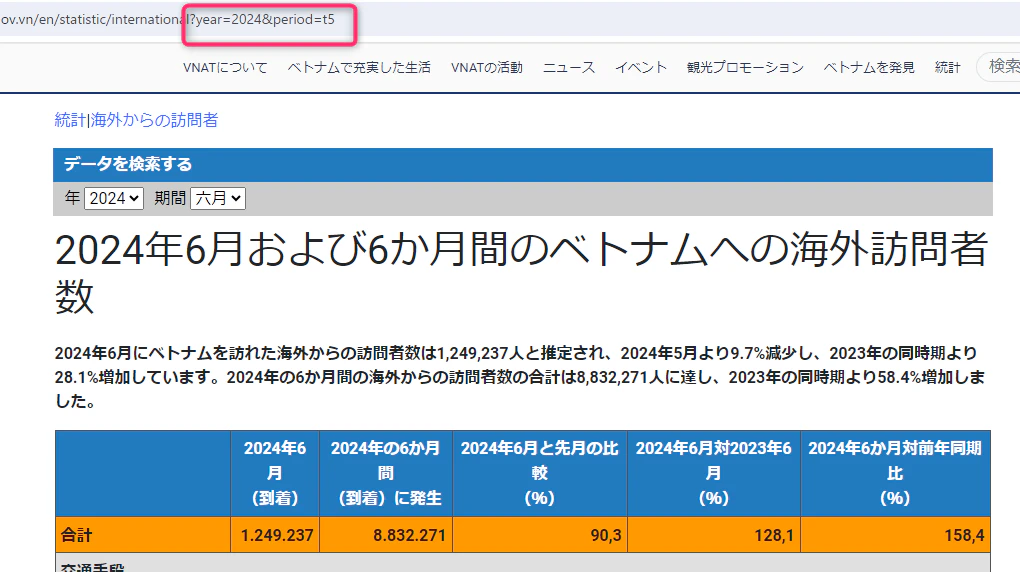
データ源 候補1
https://vietnamtourism.gov.vn/en/statistic/international?year=2024&period=t5
一応それっぽいのがあるけど、時系列で取れなさそう...
前同 128.1 って書いてあるから増減は 28.1%の増 になるから、データは合ってそうだよね。
Webスクレイピングすればやれそうではあるけどできればxmlとかで取得したいよなぁ
データ源 候補2
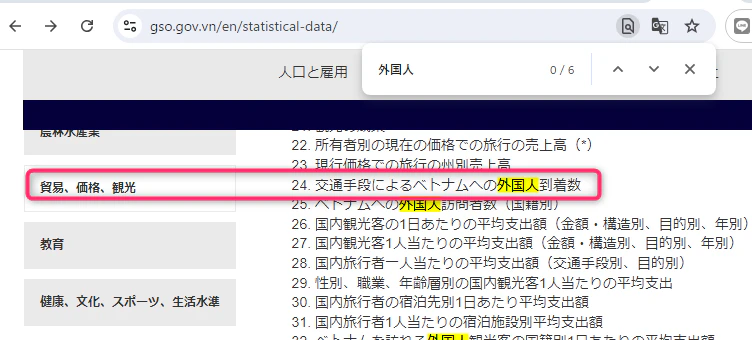
https://www.gso.gov.vn/en/statistical-data/
ここにもそれっぽいのがあるけど、リストボックスから選択するタイプなんだよなぁ。しかも年単位
| 1 | 2 |
|---|---|
 |
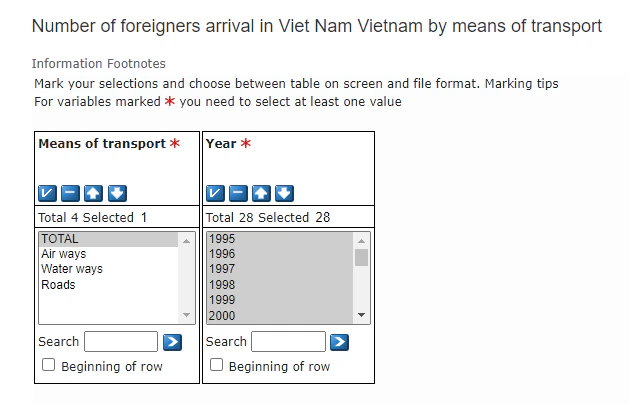 |
現状の最適解は欲しい年月のぶんだけスクレイピングするほうか...
スクレイピングを試してみたがjsでレンダリングされているからか、うまく取得できなかったな...
バッチ作成
monthly_vietnam_statistics.py
import xml.etree.ElementTree as et
from dataclasses import dataclass, field
from datetime import datetime, timedelta

import requests
from django.core.management.base import BaseCommand

from vietnam_research.models import VietnamStatistics


@dataclass
class Obs:
    element: str
    period_str: str
    value: float
    period: datetime = field(init=False)

    def __post_init__(self):
        self.period = self.get_datetime()

    def get_datetime(self) -> datetime:
        year, month = map(int, self.period_str.split("-"))
        if month == 12:
            next_month = datetime(year + 1, 1, 1)
        else:
            next_month = datetime(year, month + 1, 1)
        last_day_of_month = next_month - timedelta(days=1)
        return last_day_of_month


# XMLデータのパース
def fetch_data(url: str) -> str:
    response = requests.get(url)
    response.raise_for_status()
    return response.text


def parse_xml(
    element_name: str, xml_data: str, data_domain: str, ref_area: str, indicator: str
):
    root = et.fromstring(xml_data)
    observations = []
    for series in root.findall(".//Series"):
        if (
            series.get("DATA_DOMAIN") == data_domain
            and series.get("REF_AREA") == ref_area
            and series.get("INDICATOR") == indicator
        ):
            for obs in series.findall("Obs"):
                period_str = obs.get("TIME_PERIOD")
                value = float(obs.get("OBS_VALUE"))
                observation = Obs(
                    element=element_name, period_str=period_str, value=value
                )
                observations.append(observation)
    return observations


class Command(BaseCommand):
    help = "Fetch Vietnam Statistics data"

    def handle(self, **options):
        """
        このコマンドは、ベトナムの鉱工業生産指数と消費者物価指数のデータを取得、保存します。
        これらのデータはベトナム統計局のウェブサイト `https://www.gso.gov.vn/` から提供されています。

        handleメソッドは以下のタスクを実行します:

        1. VietnamStatisticsモデルのすべてのレコードを削除。
        2. 各URLから以下のデータを取得:
            - "https://nsdp.gso.gov.vn/GSO-chung/SDMXFiles/GSO/IIPVNM.xml"(工業生産指数)
            - "https://nsdp.gso.gov.vn/GSO-chung/SDMXFiles/GSO/CPIVNM.xml"(消費者物価指数)
        3. 取得データを解析し、VietnamStatisticsモデルに新たなレコードを作成。
        4. データの取得と保存が成功した場合、成功メッセージを表示。

        鉱工業生産指数は、一定期間内の鉱業および製造業の生産量を測る指標。
        この指数が増加すると、製造業の生産量が増加し、その結果、物資の流通や貿易が盛んになる可能性があります。
        ベトナム統計局のウェブサイトの「ベトナム国概要データページ」の鉱工業生産指数 - SDMXデータ をクリック

        一方、消費者物価指数は、一般的な物価水準の変動を測定。インフレまたはデフレを示す可能性があり、
        これらの状況はそれぞれ、物価上昇または下落を意味します。
        ベトナム統計局のウェブサイトの「ベトナム国概要データページ」の消費者物価指数 - SDMXデータ をクリック

        これらの指数を分析し、ベトナム経済のパフォーマンスとトレンドを把握します。
        """
        VietnamStatistics.objects.all().delete()

        # data1: 鉱工業生産指数
        url = "https://nsdp.gso.gov.vn/GSO-chung/SDMXFiles/GSO/IIPVNM.xml"
        xml_data = fetch_data(url)
        element_name = "industrial production index"
        data_domain = "IND"
        ref_area = "VN"
        indicator = "AIP_ISIC4_IX"
        industrial_production_index = parse_xml(
            element_name, xml_data, data_domain, ref_area, indicator
        )

        entities = [
            VietnamStatistics(element=obs.element, period=obs.period, value=obs.value)
            for obs in industrial_production_index
        ]
        VietnamStatistics.objects.bulk_create(entities)

        self.stdout.write(
            self.style.SUCCESS("Successfully fetched and stored Vietnam IIP data.")
        )

        # data2: 消費者物価指数
        url = "https://nsdp.gso.gov.vn/GSO-chung/SDMXFiles/GSO/CPIVNM.xml"
        xml_data = fetch_data(url)
        element_name = "consumer price index"
        data_domain = "CPI"
        ref_area = "VN"
        indicator = "PCPI_IX"
        consumer_price_index = parse_xml(
            element_name, xml_data, data_domain, ref_area, indicator
        )

        entities = [
            VietnamStatistics(element=obs.element, period=obs.period, value=obs.value)
            for obs in consumer_price_index
        ]
        VietnamStatistics.objects.bulk_create(entities)

        self.stdout.write(
            self.style.SUCCESS("Successfully fetched and stored Vietnam CPI data.")
        )
models.py
    :
class VietnamStatistics(models.Model):
    element = models.CharField(max_length=255)
    period = models.DateField()
    value = models.FloatField()
グラフ表示
dataprovider/market.py
        :
    def iip_timeline(self) -> dict:
        """
        鉱工業生産指数のシンプルなYM時系列データセットを作成します。
        Returns:
            dict: IIPのタイムラインデータです。
        参照先: https://www.chartjs.org/docs/latest/getting-started/
        """
        records = self.repository.get_iip_timeline()
        return {
            "labels": [record.period.strftime("%Y%m") for record in records],
            "datasets": [
                LineChartLayer(
                    label="鉱工業生産指数",
                    data=[record.value for record in records],
                ).to_dict()
            ],
        }

    def cpi_timeline(self) -> dict:
        """
        消費者物価指数のシンプルなYM時系列データセットを作成します。
        Returns:
            dict: CPIのタイムラインデータです。
        参照先: https://www.chartjs.org/docs/latest/getting-started/
        """
        records = self.repository.get_cpi_timeline()
        return {
            "labels": [record.period.strftime("%Y%m") for record in records],
            "datasets": [
                LineChartLayer(
                    label="消費者物価指数",
                    data=[record.value for record in records],
                ).to_dict()
            ],
        }
            :
repository/market.py
        :
    @staticmethod
    def get_iip_timeline() -> QuerySet:
        return VietnamStatistics.objects.filter(
            element="industrial production index"
        ).order_by("period")

    @staticmethod
    def get_cpi_timeline() -> QuerySet:
        return VietnamStatistics.objects.filter(
            element="consumer price index"
        ).order_by("period")
            :
service/market.py
:
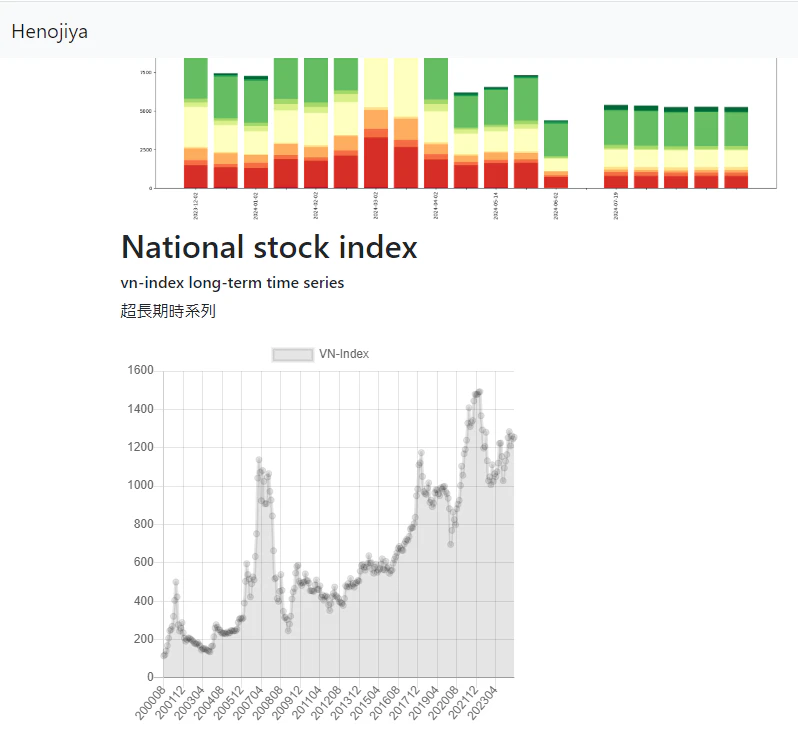
"vnindex_layers": json.dumps(
vietnam_market_data_provider.vnindex_annual_layers() vietnam_market_data_provider.vnindex_annual_layers()
), ),
+ "iip_timeline": json.dumps(vietnam_market_data_provider.iip_timeline()),
+ "cpi_timeline": json.dumps(vietnam_market_data_provider.cpi_timeline()),
"basic_info": self.repository.get_basic_info(),
:
templates/vietnam_research/index.html
:
<li><a class="btn btn-secondary btn-sm" href="#iip-chart" role="button">鉱工業生産指数</a>
</li>
<li><a class="btn btn-secondary btn-sm" href="#cpi-chart" role="button">消費者物価指数</a>
</li>
:
<div id="iip-chart" class="row">
<div class="col-sm">
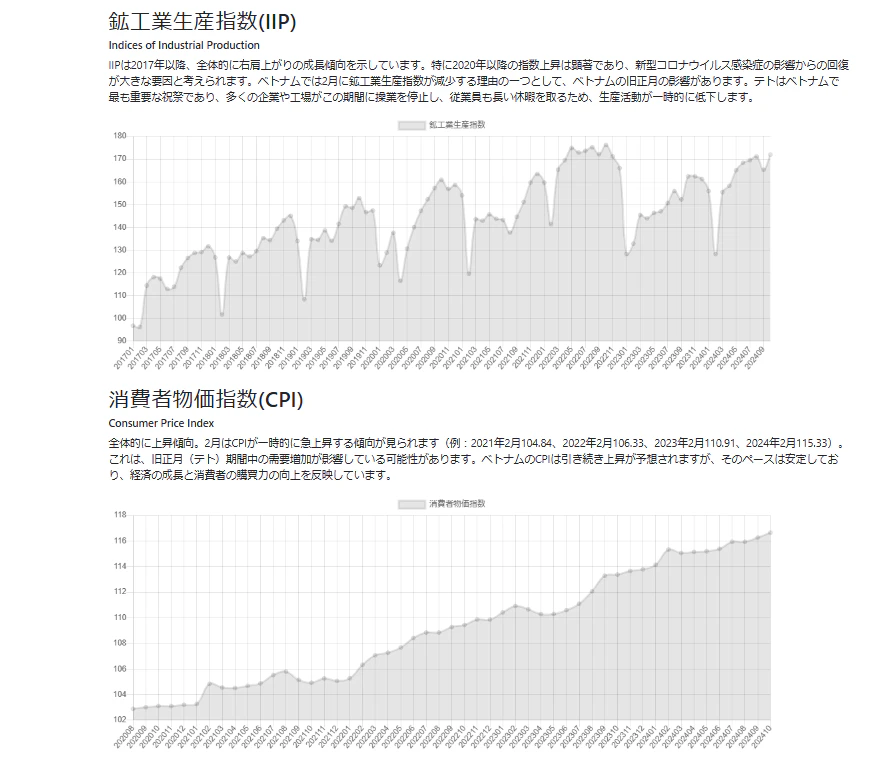
<h2>鉱工業生産指数(IIP)</h2>
<h6>Indices of Industrial Production</h6>
<p>
IIPは2017年以降、全体的に右肩上がりの成長傾向を示しています。特に2020年以降の指数上昇は顕著であり、新型コロナウイルス感染症の影響からの回復が大きな要因と考えられます。ベトナムでは2月に鉱工業生産指数が減少する理由の一つとして、ベトナムの旧正月の影響があります。テトはベトナムで最も重要な祝祭であり、多くの企業や工場がこの期間に操業を停止し、従業員も長い休暇を取るため、生産活動が一時的に低下します。</p>
<canvas id="iipChart" style="display: inline-block; width: 1000px; height: 400px;"></canvas>
</div>
</div>
<div id="cpi-chart" class="row">
<div class="col-sm">
<h2>消費者物価指数(CPI)</h2>
<h6>Consumer Price Index</h6>
<p>
全体的に上昇傾向。2月はCPIが一時的に急上昇する傾向が見られます(例:2021年2月104.84、2022年2月106.33、2023年2月110.91、2024年2月115.33)。これは、旧正月(テト)期間中の需要増加が影響している可能性があります。ベトナムのCPIは引き続き上昇が予想されますが、そのペースは安定しており、経済の成長と消費者の購買力の向上を反映しています。</p>
<canvas id="cpiChart" style="display: inline-block; width: 1000px; height: 400px;"></canvas>
</div>
</div>
:
LineChart("iipChart", JSON.parse('{{ iip_timeline|safe }}'));
LineChart("cpiChart", JSON.parse('{{ cpi_timeline|safe }}'));
</script>
確認
いいね