はじめに
前回の記事ではPythonを使ってModbus TCP通信でデータを収集する方法を紹介しました。
今回は収集したデータをエッジデバイスにインストールしたInfluxDBに格納し、Grafanaで可視化する方法を紹介します。
エッジデバイスのみで手軽に装置のデータを可視化することができます。
構成
以下の構成でデータの収集~モニタリングを行います。
-
データ収集
Modbus TCP通信を行ってエッジデバイスが装置からデータを収集します。 -
データ蓄積
収集したデータをInfluxDBに蓄積します。 -
可視化
InfluxDBに蓄積したデータをGrafanaを使って可視化します。
動作確認済みデバイス
動作確認済デバイス(OS)
- e-RT3 Plus F3RP70-2L1(Ubuntu 18.04 32bit)
- Raspberry Pi 4 Model B (Ubuntu Server 20.04 32bit)
これらのデバイスでは armhf アーキテクチャのパッケージが動作します。
準備
Grafanaのインストール
エッジデバイスにGrafanaをインストールします2。
必要なパッケージをインストールします。
sudo apt install -y apt-transport-https
sudo apt install -y software-properties-common wget
wget -q -O - https://packages.grafana.com/gpg.key | sudo apt-key add -
リポジトリを追加してGrafanaをインストールします。
echo "deb https://packages.grafana.com/oss/deb stable main" | sudo tee -a /etc/apt/sources.list.d/grafana.list
sudo apt update
sudo apt install grafana
サービスを起動して状態を確認します。
sudo systemctl daemon-reload
sudo systemctl start grafana-server
sudo systemctl status grafana-server
以下のような表示があれば成功です。
username@ubuntu:~$ sudo systemctl status grafana-server
* grafana-server.service - Grafana instance
   Loaded: loaded (/usr/lib/systemd/system/grafana-server.service; disabled; ven
   Active: active (running) since Fri 2021-12-24 07:38:20 UTC; 14s ago
     Docs: http://docs.grafana.org
 Main PID: 2756 (grafana-server)
    Tasks: 12 (limit: 2366)
   CGroup: /system.slice/grafana-server.service
           `-2756 /usr/sbin/grafana-server --config=/etc/grafana/grafana.ini --p

Dec 24 07:38:32 ubuntu grafana-server[2756]: t=2021-12-24T07:38:32+0000 lvl=info
Dec 24 07:38:32 ubuntu grafana-server[2756]: t=2021-12-24T07:38:32+0000 lvl=info
...
Note
エッジデバイスがproxy環境下にある場合はproxy設定が必要です。
InfluxDBのインストール
エッジデバイスにInfluxDBをインストールします。
PythonからInfluxDBを操作するためのパッケージをインストールします。
python3 -m pip install influxdb
InfluxDBをインストールします3。
リポジトリを追加して、インストールを行います。
curl -s https://repos.influxdata.com/influxdb.key | gpg --dearmor | sudo tee /etc/apt/trusted.gpg.d/influxdb.gpg
export DISTRIB_ID=$(lsb_release -si); export DISTRIB_CODENAME=$(lsb_release -sc)
echo "deb [signed-by=/etc/apt/trusted.gpg.d/influxdb.gpg] https://repos.influxdata.com/${DISTRIB_ID,,} ${DISTRIB_CODENAME} stable" | sudo tee /etc/apt/sources.list.d/influxdb.list
sudo apt update
sudo apt install influxdb
サービスを起動して状態を確認します。
sudo systemctl unmask influxdb.service
sudo systemctl start influxdb
sudo systemctl status influxdb
以下のような表示があれば成功です。
username@ubuntu:~$ sudo systemctl status influxdb
* influxdb.service - InfluxDB is an open-source, distributed, time series databa
   Loaded: loaded (/lib/systemd/system/influxdb.service; enabled; vendor preset:
   Active: active (running) since Fri 2021-12-24 07:51:02 UTC; 6s ago
     Docs: https://docs.influxdata.com/influxdb/
  Process: 4191 ExecStart=/usr/lib/influxdb/scripts/influxd-systemd-start.sh (co
 Main PID: 4192 (influxd)
    Tasks: 9 (limit: 2366)
   CGroup: /system.slice/influxdb.service
           `-4192 /usr/bin/influxd -config /etc/influxdb/influxdb.conf

Dec 24 07:51:01 ubuntu influxd-systemd-start.sh[4191]: ts=2021-12-24T07:51:01.75
Dec 24 07:51:01 ubuntu influxd-systemd-start.sh[4191]: ts=2021-12-24T07:51:01.75
...
データ収集
PyModbus4を使用したPythonプログラムで装置からデータを取得します。
今回は装置の代わりにPC上でModbusサーバーを起動します。
Note
PyModubsを利用したデータ収集の詳細については以前の記事をご覧ください。
Modbusサーバーの準備
PC上でModbusサーバーを起動します。
定期的に値を書き換えるために、updating_server.py(ライセンスはこちら)を一部変更したプログラムを使用します。
今回は保持レジスタに2つの時系列データを、コイルに1つの2値データを格納します。
関数updating_writerを以下のコードに変更します。
import random
def updating_writer(a):
    context = a[0]
    slave_id = 0x00

    # コイル1への書き込み
    fx = 1
    address = 0x01
    values = [bool(random.getrandbits(1))]
    log.debug("coil1: " + str(bool(random.getrandbits(1))))
    context[slave_id].setValues(fx, address, values)

    # 保持レジスタ2への書き込み
    fx = 3
    address = 0x02
    values = context[slave_id].getValues(fx, address, count=1)
    values[0] +=  random.randint(-10, 10)
    if values[0] > 100:
        values[0] = 100
    elif values[0] < 0:
        values[0] = 0
    log.debug("holding2: " + str(values[0]))
    context[slave_id].setValues(fx, address, values)

    # 保持レジスタ3への書き込み
    fx = 3
    address = 0x03
    values = context[slave_id].getValues(fx, address, count=1)
    values[0] +=  random.randint(-5, 5)
    if values[0] > 50:
        values[0] = 50
    elif values[0] < 0:
        values[0] = 0
    log.debug("holding3: " + str(values[0]))
    context[slave_id].setValues(fx, address, values)
プログラム下部の以下のコードを書き換えます。
# 変更前
StartTcpServer(context, identity=identity, address=("localhost", 5020))
# 変更後
StartTcpServer(context, identity=identity, address=("", 5020))
必要なパッケージをインストールしてプログラムを起動します。
python -m pip install twisted pymodbus
python updating_server.py
エッジデバイスでのデータ収集
エッジデバイスで以下のプログラムclient.pyを実行してサーバーのデータを5秒周期で収集します。
<IP_ADDRESS_OF_SERVER_PC>はModbusサーバーを起動しているPCのIPアドレスで置き換えてください。
#!/usr/bin/env python
from pymodbus.client.sync import ModbusTcpClient as ModbusClient
import time

# Modbusサーバーに接続
mbclient = ModbusClient('<IP_ADDRESS_OF_SERVER_PC>', port=5020)
mbclient.connect()

while True:
    try:
        # コイル1の値読み取り
        rr = mbclient.read_coils(1, 1)
        co1 = rr.bits[0]

        # 保持レジスタ2,3の値読み取り
        rr = mbclient.read_holding_registers(2, 2)
        hr2 = rr.registers[0]
        hr3 = rr.registers[1]

        print("coil1: {0}, holding2: {1}, holding3: {2}".format(co1, hr2, hr3))

        # 5秒スリープ
        time.sleep(5)

    except KeyboardInterrupt:
        # 切断
        mbclient.close()
        break

    except Exception as e:
        print(e)
プログラムを起動して、以下のような出力があれば成功です。
username@ubuntu:~$ python3 client.py
coil1: False, holding2: 89, holding3: 12
coil1: True, holding2: 85, holding3: 13
coil1: True, holding2: 78, holding3: 14
...
# Ctrl+Cで終了
Note
このプログラムによる周期的なデータ収集は簡易的なものであり、周期は正確ではありません。
より正確な周期でデータ収集を行いたい方は他の方法をご検討ください。
データ蓄積
エッジデバイスで収集したデータをInfluxDBに蓄積します。
データベースの準備
InfluxDBを起動してデータベースを作成します。
今回はsampleDBという名前でデータベースを作成します。
sudo systemctl start influxdb
username@ubuntu:~$ influx
Connected to http://localhost:8086 version 1.8.10
InfluxDB shell version: 1.8.10
> CREATE DATABASE sampleDB
> exit
データベースへの格納
収集したデータを作成したデータベースに格納します。
InfluxDBのサンプルプログラムを参考にしてエッジデバイスでのデータ収集で作成したclient.pyに、データを格納するコードを追加します。
追加後のコードは以下のようになります。
#!/usr/bin/env python
from pymodbus.client.sync import ModbusTcpClient as ModbusClient
from influxdb import InfluxDBClient
from datetime import datetime
import time

# Modbusサーバーに接続
mbclient = ModbusClient('<IP_ADDRESS_OF_SERVER_PC>', port=5020)
mbclient.connect()

# データベースに接続
dbclient = InfluxDBClient(host='localhost', port=8086, database='sampleDB')

while True:
    try:
        # コイル1の値読み取り
        rr = mbclient.read_coils(1, 1)
        co1 = rr.bits[0]

        # 保持レジスタ2,3の値読み取り
        rr = mbclient.read_holding_registers(2, 2)
        hr2 = rr.registers[0]
        hr3 = rr.registers[1]

        print("coil1: {0}, holding2: {1}, holding3: {2}".format(co1, hr2, hr3))

        # データベースへの書き込み
        json_body = [
            {
                "measurement": "sample_measurement",
                "time": datetime.utcnow(),
                "fields": {
                    "coil_1": co1,
                    "holding_register_2": hr2,
                    "holding_register_3": hr3
                }
            }
        ]
        print("Write points: {0}".format(json_body))
        dbclient.write_points(json_body)

        # 5秒スリープ
        time.sleep(5)

    except KeyboardInterrupt:
        # 切断
        mbclient.close()
        dbclient.close()
        break

    except Exception as e:
        print(e)
Note
データベースへデータを格納する度にSDカードへの書き込みが発生します。
SDカードへの高頻度な書き込みを避けたい場合は、RAMディスクやネットワークディスクなど適当なストレージを用意し、InfluxDBの設定で格納先として指定してください。
プログラムを起動して数十秒待ちます。
python3 client.py
# Ctrl+Cで終了
エッジデバイスで以下のコマンドを実行してテーブルの中身を表示します。以下のようにデータが格納されていたら成功です。
username@ubuntu:~/modbus$ influx
Connected to http://localhost:8086 version 1.8.10
InfluxDB shell version: 1.8.10
> USE sampleDB
Using database sampleDB
> SELECT * FROM "sample_measurement" LIMIT 3
name: sample_measurement
time                coil_1 holding_register_2 holding_register_3
----                ------ ------------------ ------------------
1641876882000000000 false  23                 13
1641876887000000000 false  16                 14
1641876892000000000 true   15                 13
可視化とモニタリング
InfluxDBに蓄積したデータをGrafanaで可視化します。
エッジデバイスで以下のコマンドを実行してGrafanaを起動します。
sudo systemctl start grafana-server
PCでhttp://<IP_ADDRESS_OF_EDGE_DEVICE>:3000にアクセスしてGrafanaを開きます。
ログイン画面が開きます。ユーザー名とパスワードの初期設定値はどちらもadminです。必要に応じて変更してください。

データベースの登録
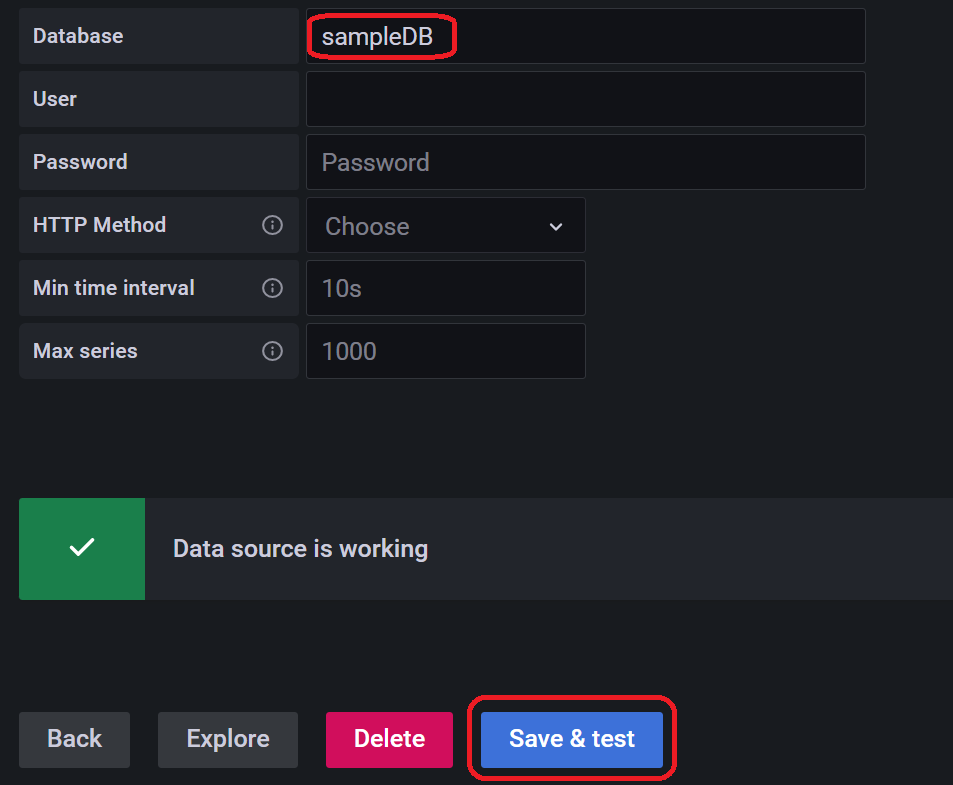
Grafanaにデータベースの準備で作成したsampleDBを登録します。
左端の歯車のアイコンをクリックしてConfiguration > Data Sourcesと進み、「Add data source」をクリックします。
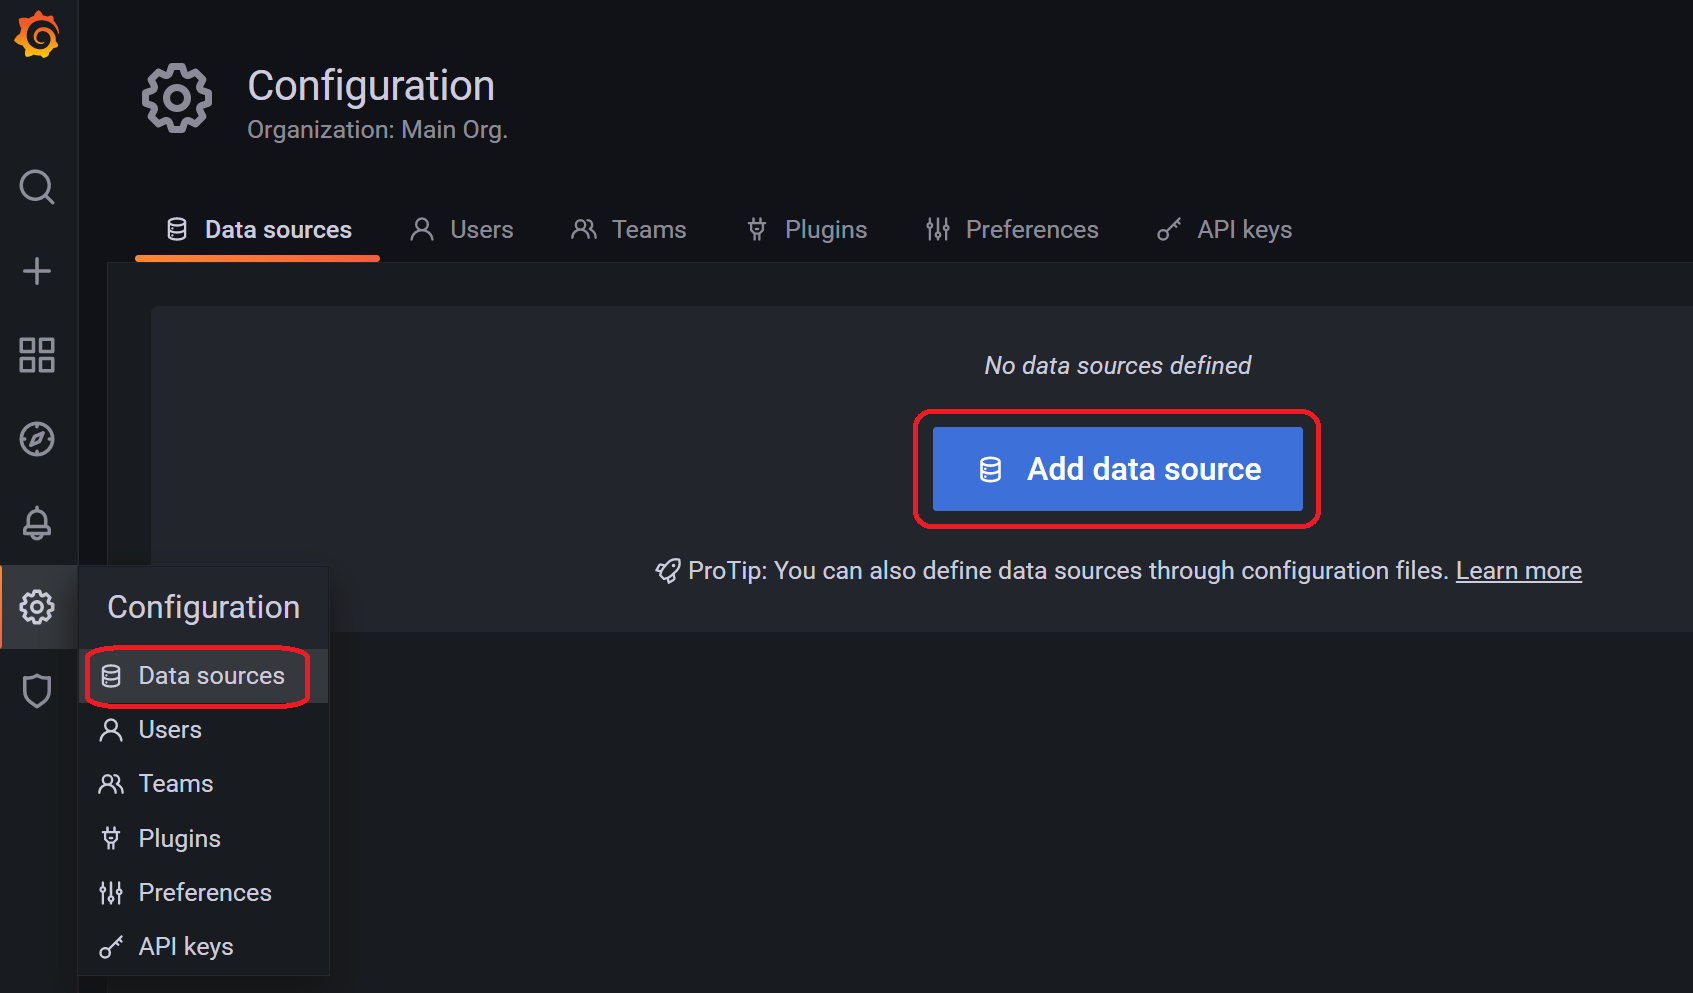
設定画面が表示されます。以下の項目を入力し、「Save & test」をクリックします。
| 項目 | 設定値 |
|---|---|
| URL | http://localhost:8086 |
| Database | sampleDB |
時系列データの可視化
ダッシュボードを作成し、収集した時系列データをグラフ化します。
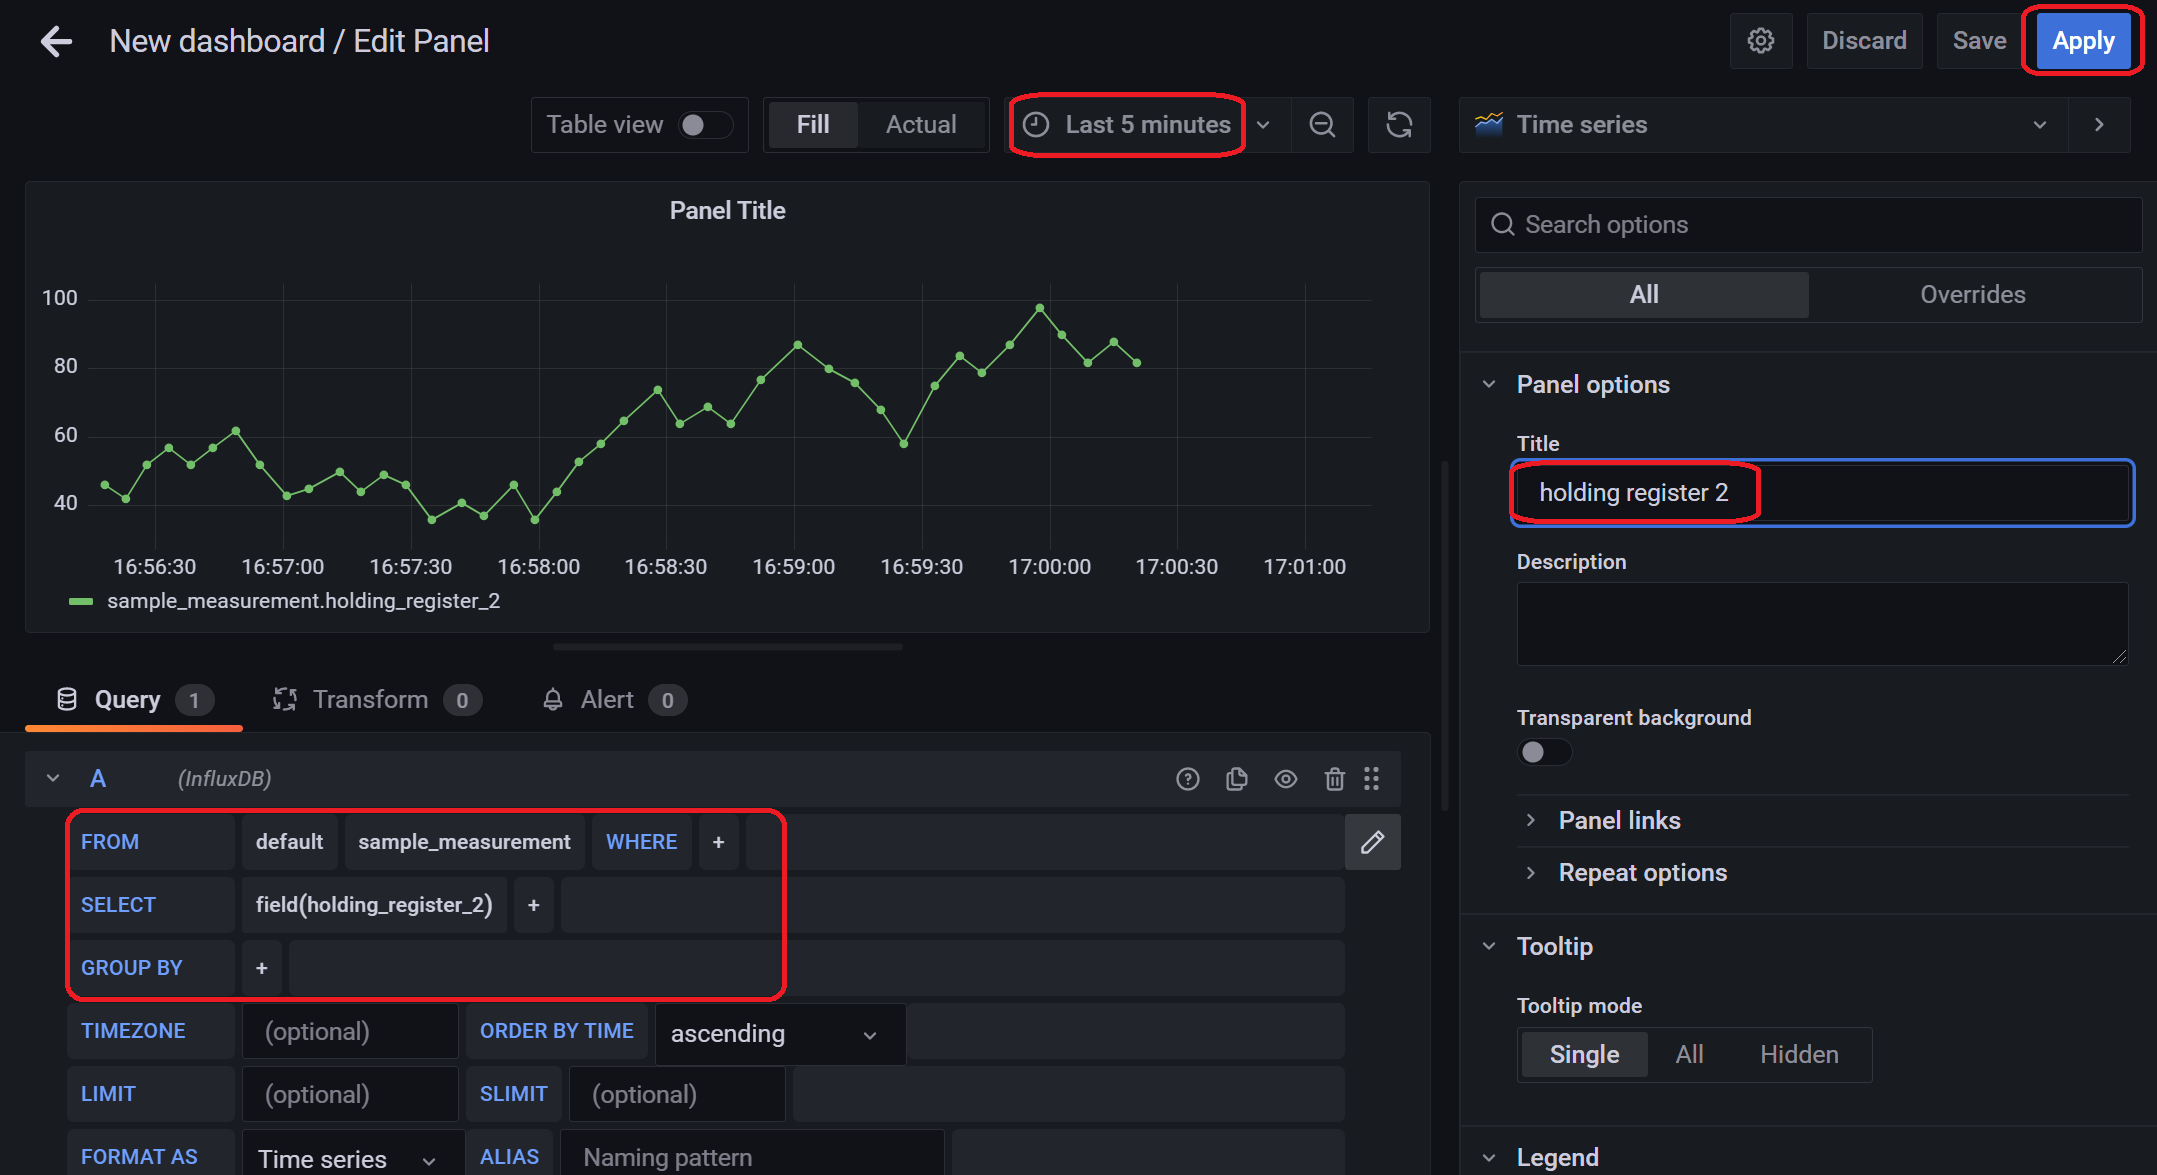
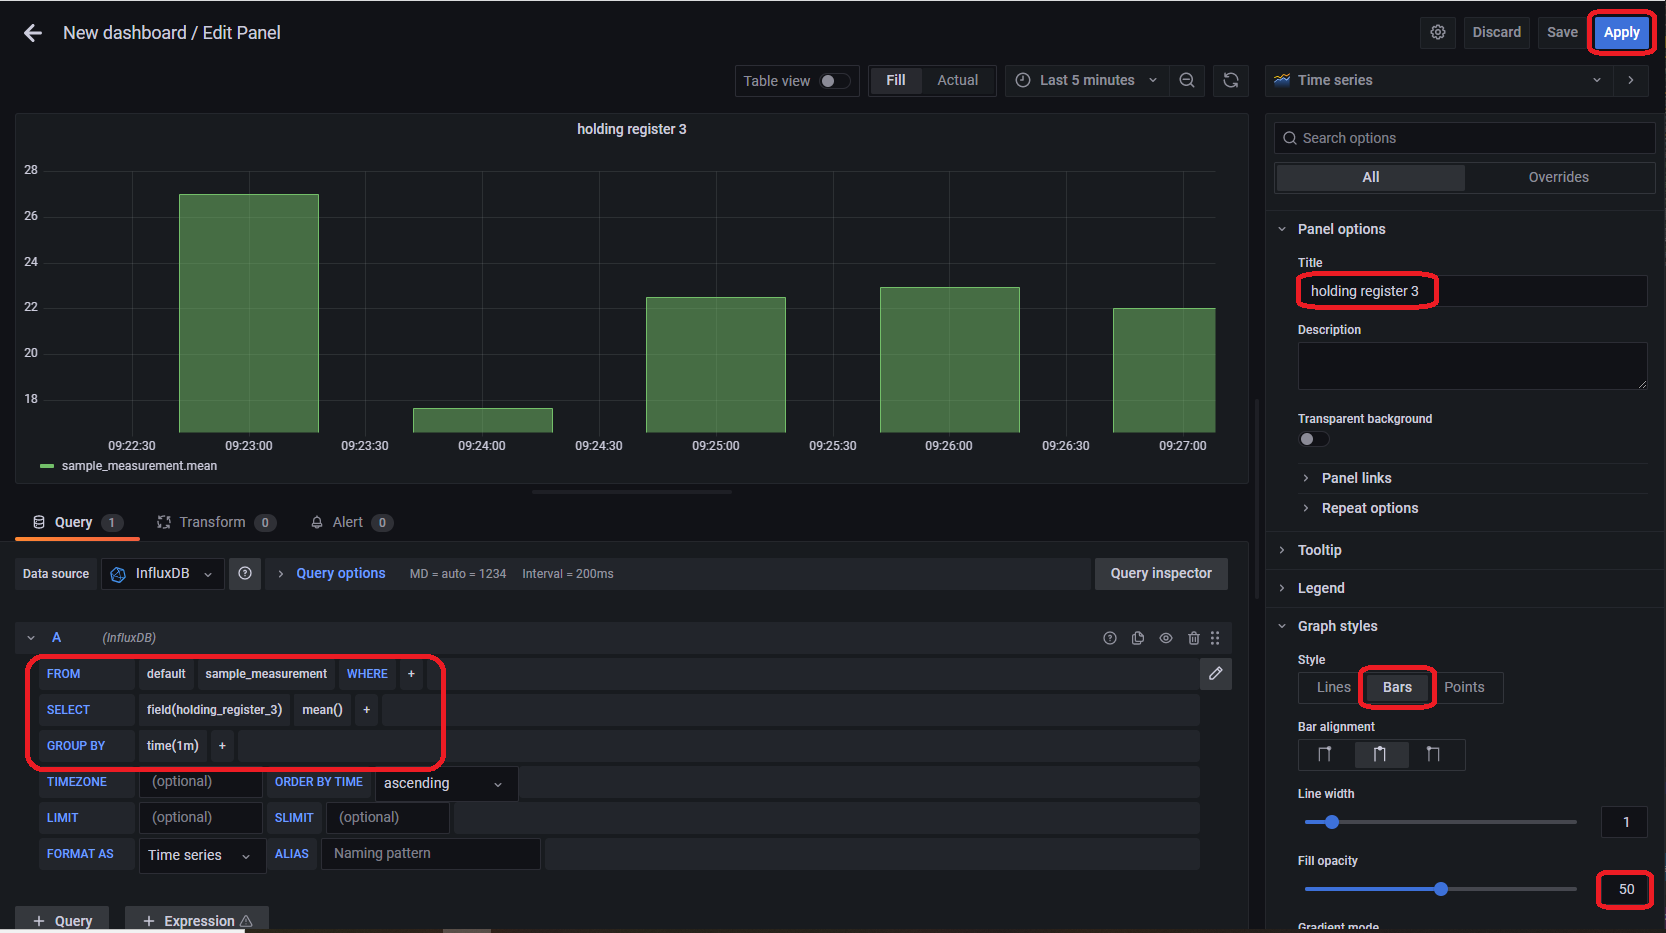
今回は保持レジスタ2の値を生データの折れ線グラフ、保持レジスタ3の値を1分毎の平均値の棒グラフで可視化します。
左端の+アイコンをクリックしてCreate > Dashboardと進み、「Add a new panel」をクリックします。
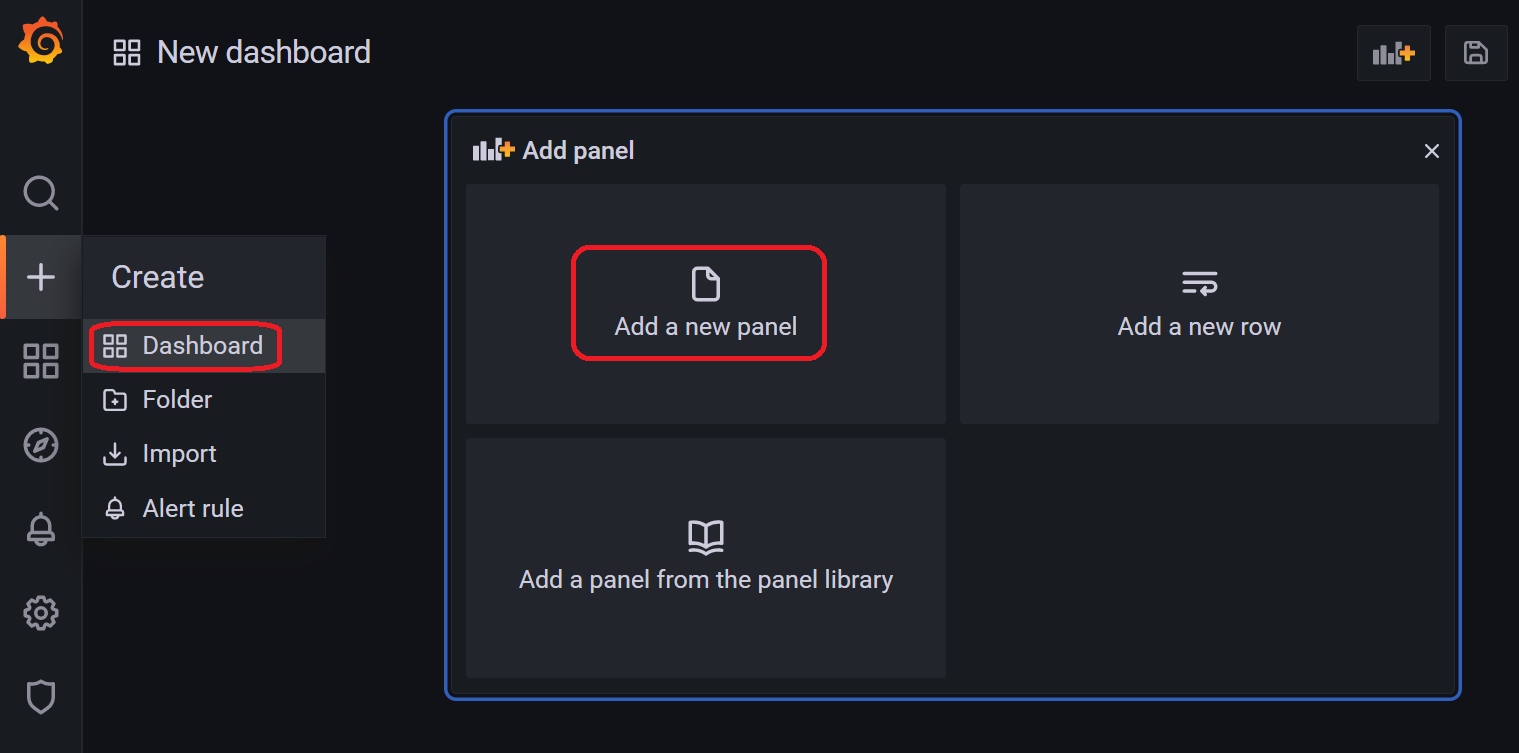
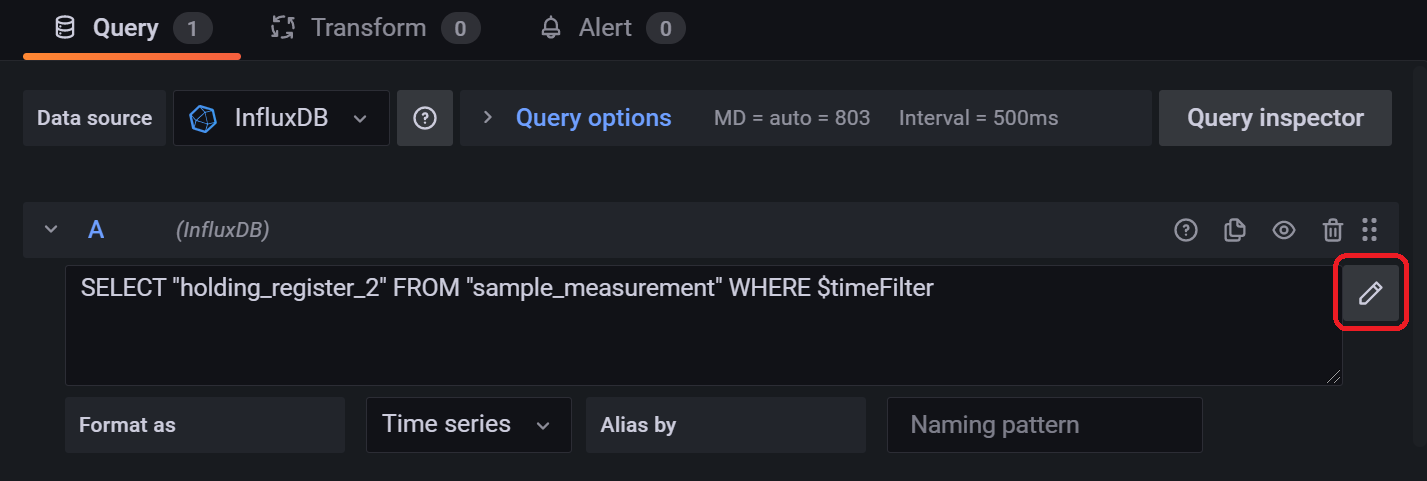
保持レジスタ2(holding_register_2)のグラフの設定を以下の画面のように設定を行い、「Apply」をクリックします。
Note
鉛筆のマークをクリックし以下のクエリ文を入力することでクエリの設定を行うこともできます。
SELECT "holding_register_2" FROM "sample_measurement" WHERE $timeFilter
「Add panel」のアイコンをクリックして同様に保持レジスタ3(holding_register_3)の棒グラフを作成します。以下の画面のように設定を行います。
Note
以下のクエリ文でクエリの設定を行うこともできます。
SELECT mean("holding_register_3") FROM "sample_measurement" WHERE $timeFilter GROUP BY time(1m)
2値データの可視化
コイル1の最新の状態をtrue/falseで表示する可視化を行います。
「Add panel」のアイコンをクリックしてパネルを追加し、右側のメニューから「Stat」を選択して以下のように設定を行います。
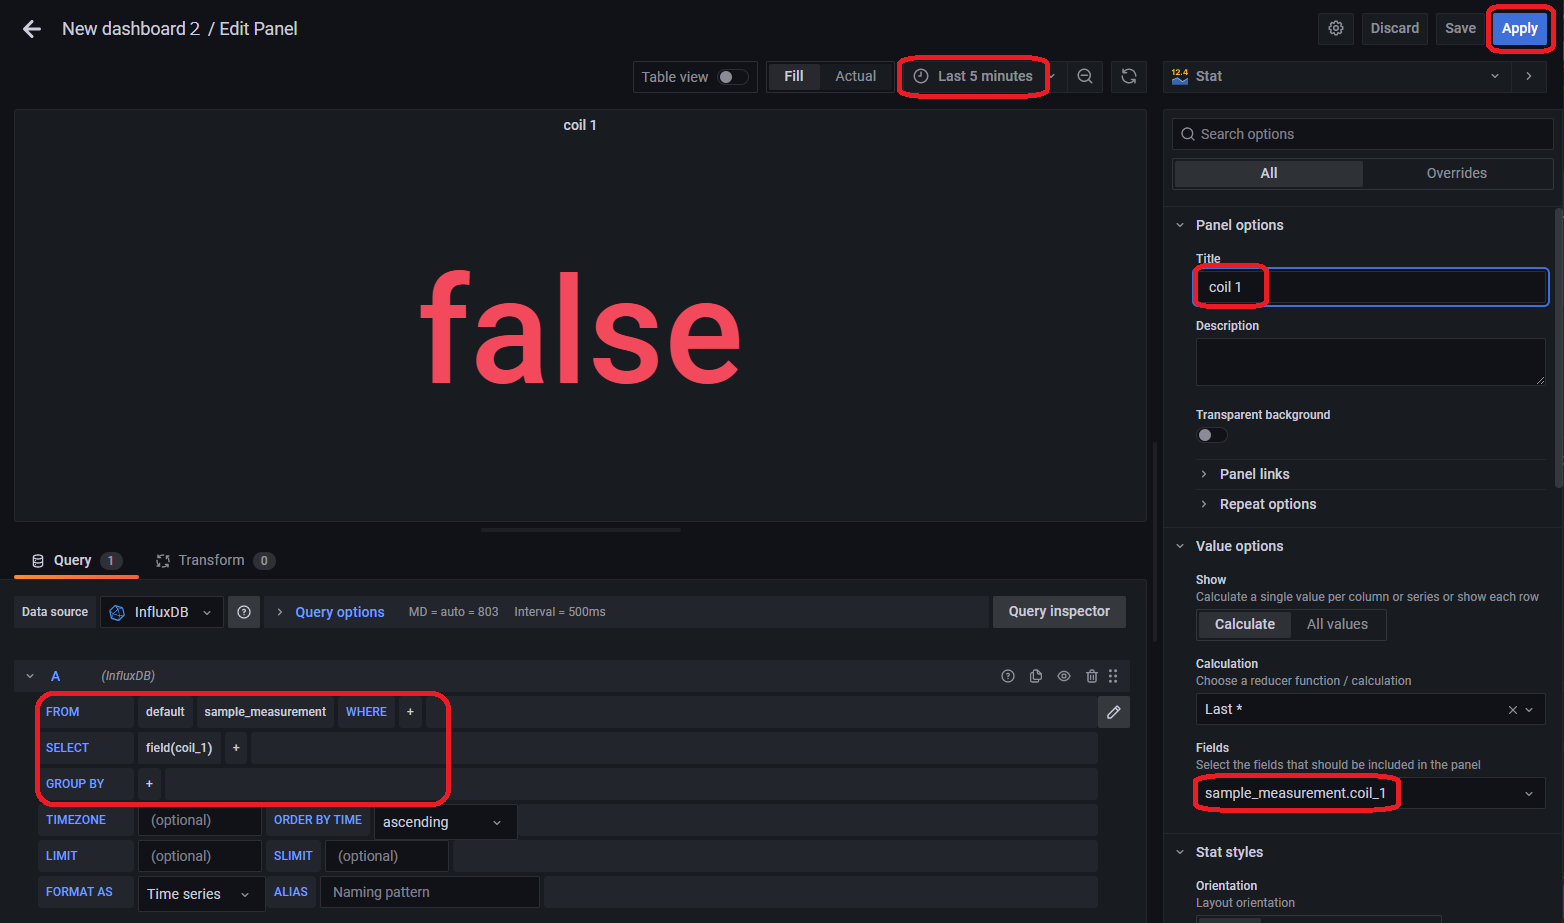
Note
以下のクエリ文ででクエリの設定を行うこともできます。
SELECT "coil_1" FROM "sample_measurement" WHERE $timeFilter
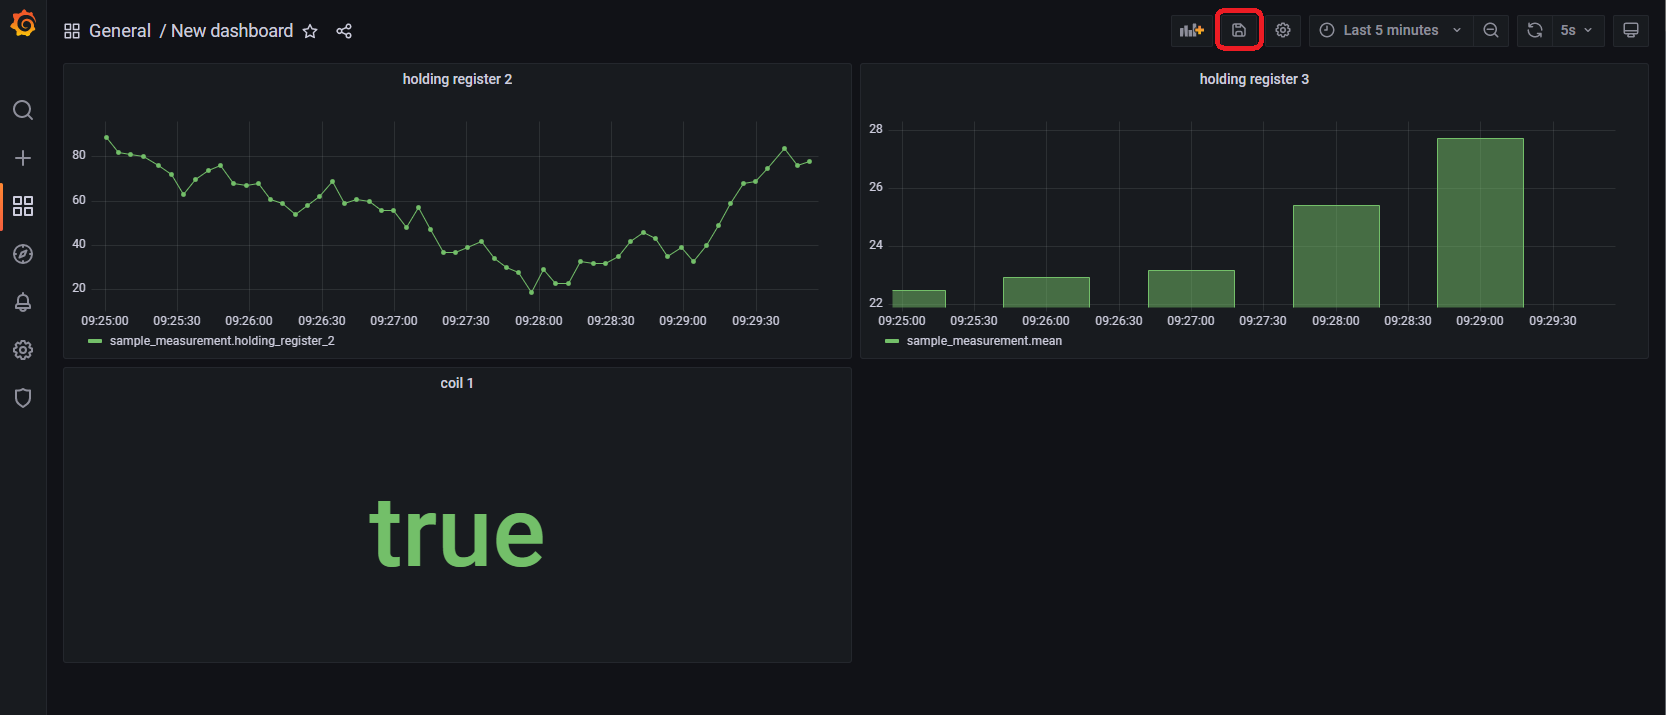
すべての作業が完了すると以下のような画面になります。「Save dashboard」をクリックしてダッシュボードを保存します。
まとめ
今回はPythonを使ったModbus通信によるデータ収集からInfluxDBでのデータ蓄積、Grafanaによる可視化までをエッジデバイス上で行いました。
クラウド等の外部のシステムに接続せずにローカルで可視化を行うことができるので、手軽に可視化を行いたいときに便利です。是非ご活用ください。


