初心者向けのレクチャーによく使われるirisデータを使って、機械学習の分類問題にトライしてみます。
使用するデータ
ireiデータ。(irisは「アヤメ」の花を意味。)
アヤメの品種のSetosa Versicolor Virginicaの3品種に関するデータ。
全部で150件のデータセット。
データセットの内容
Sepal Length:がく片の長さ
Sepal Width:がく片の幅
Petal Length:花びらの長さ
Petal Width:花びらの幅
Name:アヤメの品種データ(Iris-Setosa、Iris-Vesicolor、Iris-Virginicaの3種類)

採用するモデル
SVM(サポートベクターマシン)。
SVMは教師あり学習の分類問題に適している。
スパム判別器なども作ることが可能なモデル。
教師あり学習なので、特徴量データと目的変数が必要。
全体の流れ
1)データの下準備
2)データを可視化
3)モデルを学習・評価
実践
1)データの下準備
まずは、必要なライブラリをインポートした後、データを取り込み確認。
import numpy  as np
import pandas as pd
import seaborn as sns
sns.set_style("whitegrid")
import matplotlib.pyplot as plt
%matplotlib inline
from sklearn.model_selection import train_test_split, cross_validate

df = pd.read_csv("iris.csv")
df.head()

	SepalLength	SepalWidth	PetalLength	PetalWidth	Name
0	5.1	3.5	1.4	0.2	Iris-setosa
1	4.9	3.0	1.4	0.2	Iris-setosa
2	4.7	3.2	1.3	0.2	Iris-setosa
3	4.6	3.1	1.5	0.2	Iris-setosa
4	5.0	3.6	1.4	0.2	Iris-setosa
訓練データとテストデータに分割する。
X = df[["SepalLength","SepalWidth","PetalLength","PetalWidth"]]
y = df["Name"]

X_train, X_test, y_train, y_test = train_test_split(X, y)
X_train.shape, X_test.shape

((112, 4), (38, 4)) #分割後の行列数確認
訓練データとテストデータそれぞれでDataframeを作成。
data_train = pd.DataFrame(X_train)
data_train["Name"] = y_train
2)データを可視化
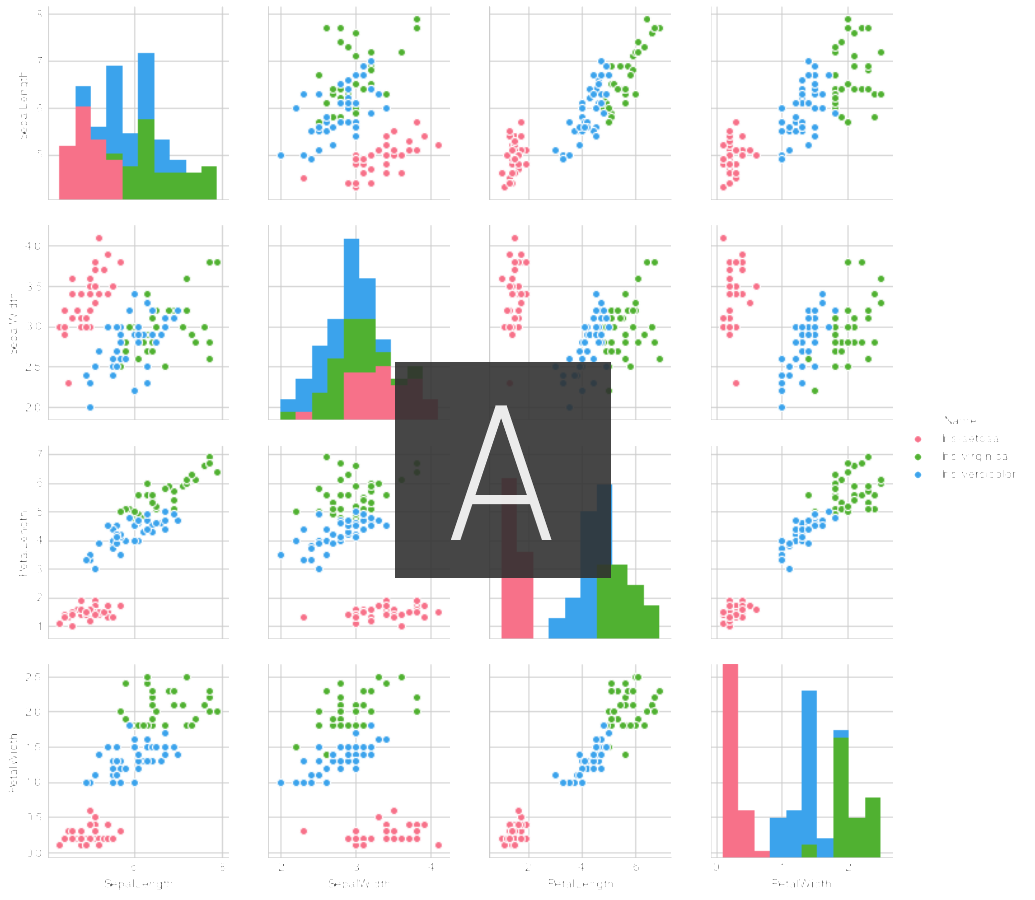
検証データでは、実際にアヤメの種類と獲得超量にどんな関係があるのか?
プロットして、種類ごとに特徴量に違いがあるのか確認してみる。
sns.pairplot(data_train, hue='Name', palette="husl")

たしかにアヤメの種類によって、各特徴量に明確に差があるように見える。
3)モデルを学習・評価
実際にSVMに検証データを入れて、モデルをつくってみる。
X_train = data_train[["SepalLength", "SepalWidth","PetalLength"]].values
y_train = data_train["Name"].values

from sklearn import svm,metrics

clf = svm.SVC()
clf.fit(X_train,y_train)
作成したモデルにテストデータを入力。
pre = clf.predict(X_test)
モデルを評価する。
ac_score = metrics.accuracy_score(y_test,pre)
print("正解率=", ac_score)

正解率= 0.9736842105263158
テストデータとモデルによって得られた結果が97%一致していることが確認できた。