はじめに
この記事では、JavaScript のデータ可視化ライブラリである D3 を Next.js App Router で利用する方法を記載します。
開発環境
開発環境は以下の通りです。
- Windows 11
- Next.js 14.2.4
- React 18.3.1
- TypeScript 5.5.2
- D3 7.9.0
インストール
まずは D3 をインストールします。
npm install d3
今回は TypeScript を利用するので、D3 の型定義もインストールします。
npm install --save-dev @types/d3
実装
D3 を利用して、シンプルな折れ線グラフコンポーネントを作成します。
データの定義
表示するデータは以下の通りです。
data.ts
const data = [
  { name: "A", value: 400 },
  { name: "B", value: 200 },
  { name: "C", value: 300 },
  { name: "D", value: 350 },
  { name: "E", value: 300 },
];
X軸、Y軸、折れ線の定義
X軸とY軸は、scaleLinear という関数を利用して定義します。
page.tsx
const x = d3
  .scaleLinear()
  .domain([0, data.length - 1])
  .range([marginLeft, width - marginRight]);

const y = d3
  .scaleLinear()
  .domain(d3.extent(data, (d) => d.value) as [number, number])
  .range([height - marginBottom, marginTop]);
折れ線の定義
折れ線は、line という関数を利用して定義します。
page.tsx
const line = d3
  .line<{ name: string; value: number }>()
  .x((d, i) => x(i))
  .y((d) => y(d.value));
折れ線グラフコンポーネントの実装
今まで定義した値を利用してコンポーネントを実装します。コンポーネントには、svg を利用します。
page.tsx
import * as d3 from "d3";
import { data } from "./data.ts";

export default function LineChart({
  width = 730,
  height = 250,
  marginTop = 20,
  marginRight = 20,
  marginBottom = 20,
  marginLeft = 20,
}: Record<
  | "width"
  | "height"
  | "marginTop"
  | "marginRight"
  | "marginBottom"
  | "marginLeft",
  number
>) {
  const x = d3
    .scaleLinear()
    .domain([0, data.length - 1])
    .range([marginLeft, width - marginRight]);

  const y = d3
    .scaleLinear()
    .domain(d3.extent(data, (d) => d.value) as [number, number])
    .range([height - marginBottom, marginTop]);

  const line = d3
    .line<{ name: string; value: number }>()
    .x((d, i) => x(i))
    .y((d) => y(d.value));

  return (
    <svg width={width} height={height}>
      <path
        fill="none"
        stroke="currentColor"
        strokeWidth="1.5"
        d={line(data) || undefined}
      />
      <g fill="white" stroke="currentColor" strokeWidth="1.5">
        {data.map((d, i) => (
          <circle key={i} cx={x(i)} cy={y(d.value)} r="2.5" />
        ))}
      </g>
    </svg>
  );
}
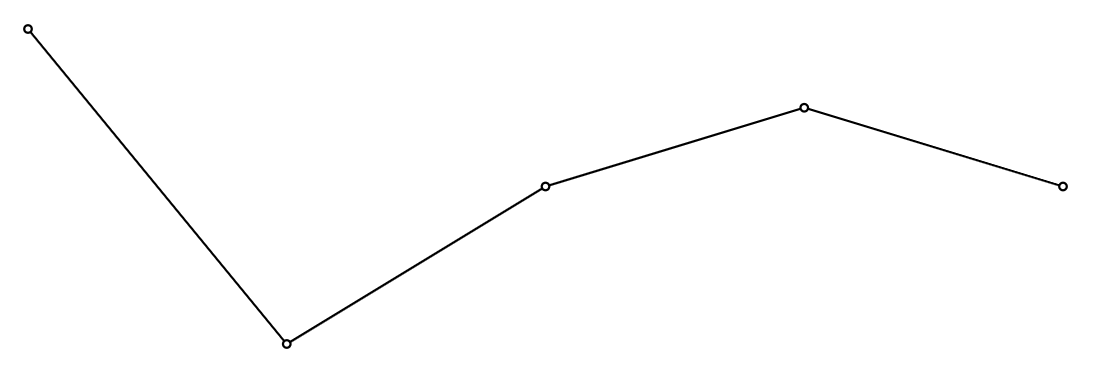
動作確認
折れ線グラフが表示されます。