はじめに
この記事では、React 向けのチャート(グラフ)ライブラリである Recharts を使って複数のチャート(Area、Bar、Line)を組み合わせて表示する方法を記載します。
開発環境
開発環境は以下の通りです。
- Windows 11
- Next.js 14.2.4
- React 18.3.1
- TypeScript 5.5.2
- Recharts 2.13.2
表示するデータ
表示するデータは以下の通りです。
X軸に name の値、Y軸に uv、pv、amt の値を表示します。
export const data = [
  {
    name: "Page A",
    uv: 4000,
    pv: 2400,
    amt: 2400,
  },
  {
    name: "Page B",
    uv: 3000,
    pv: 1398,
    amt: 2210,
  },
  {
    name: "Page C",
    uv: 2000,
    pv: 9800,
    amt: 2290,
  },
  {
    name: "Page D",
    uv: 2780,
    pv: 3908,
    amt: 2000,
  },
  {
    name: "Page E",
    uv: 1890,
    pv: 4800,
    amt: 2181,
  },
  {
    name: "Page F",
    uv: 2390,
    pv: 3800,
    amt: 2500,
  },
  {
    name: "Page G",
    uv: 3490,
    pv: 4300,
    amt: 2100,
  },
];
チャートの実装
まずはチャート表示欄の全体を ComposedChart というコンポーネントで囲みます。
props には、縦横のサイズ及びチャートに表示するデータを渡します。
"use client";

import { ComposedChart } from "recharts";
import { data } from "./data";

export default function ComposedCharts() {
  return <ComposedChart width={800} height={450} data={data}></ComposedChart>;
}
この時点では、指定した縦横サイズの SVG がレンダリングされるだけです。
Area の追加
ComposedChart コンポーネント内に Area を追加すると Area Chart が表示されます。
"use client";

import { Area, ComposedChart } from "recharts";
import { data } from "./data";

export default function ComposedCharts() {
  return (
    <ComposedChart width={800} height={450} data={data}>
      <Area dataKey="amt" fill="#adffff" stroke="#7fbfff" />
    </ComposedChart>
  );
}
Bar の追加
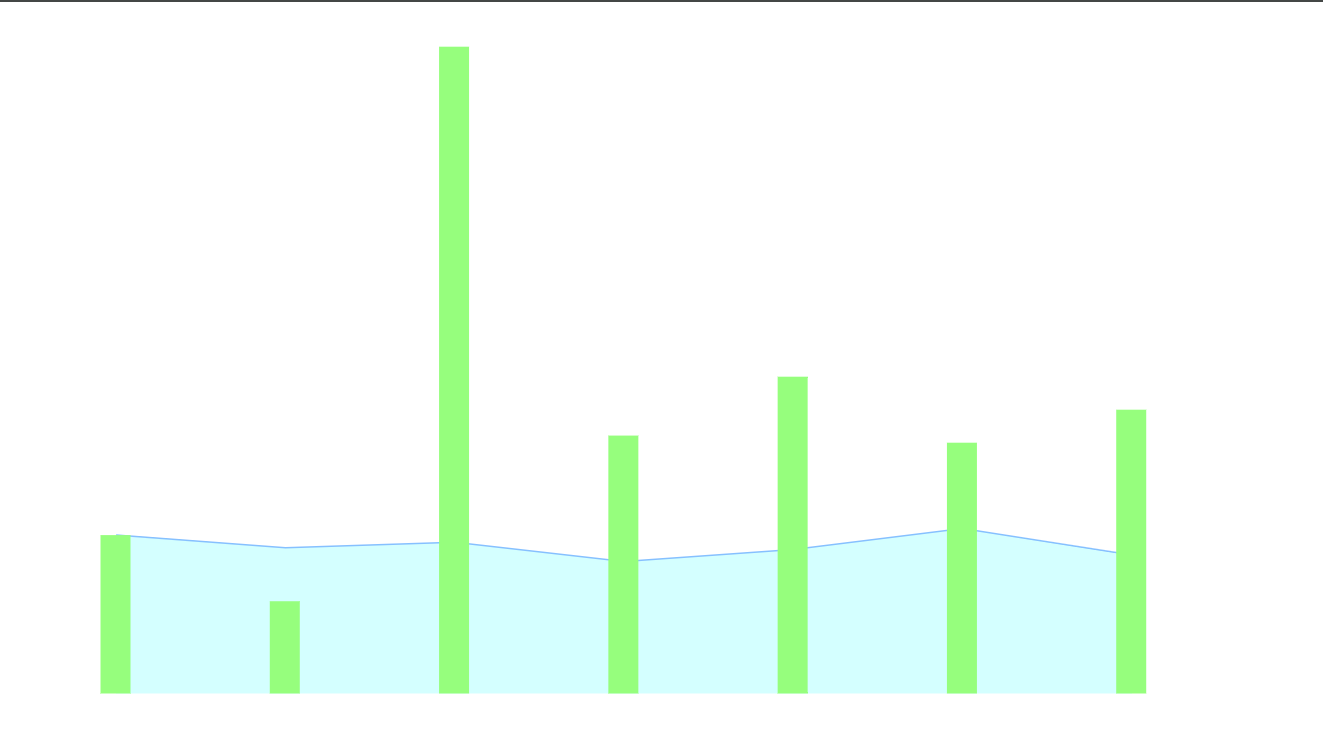
Bar を追加すると、Bar Chart が表示されます。
"use client";

import { Area, Bar, ComposedChart } from "recharts";
import { data } from "./data";

export default function ComposedCharts() {
  return (
    <ComposedChart width={800} height={450} data={data}>
      <Area dataKey="amt" fill="#adffff" stroke="#7fbfff" />
      <Bar dataKey="pv" barSize={20} fill="#7fff7f" />
    </ComposedChart>
  );
}
以下のように Area Chart と BarChart が組み合わさって表示されます。
Line の追加
Line を追加すると、Line Chart も追加されます。
"use client";

import { Area, Bar, ComposedChart, Line } from "recharts";
import { data } from "./data";

export default function ComposedCharts() {
  return (
    <ComposedChart width={800} height={450} data={data}>
      <Area dataKey="amt" fill="#adffff" stroke="#7fbfff" />
      <Bar dataKey="pv" barSize={20} fill="#7fff7f" />
      <Line dataKey="uv" stroke="#ff7f7f" />
    </ComposedChart>
  );
}
その他パーツの追加
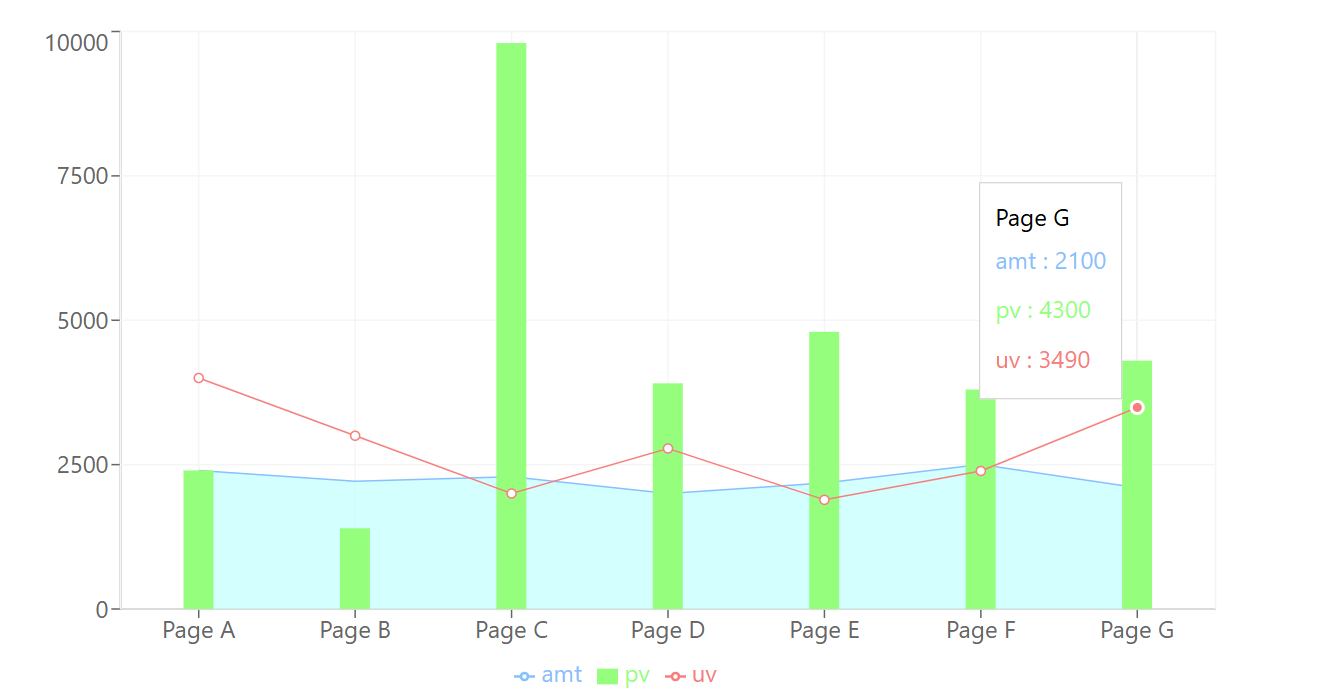
以下のようなパーツも追加できます。
- X軸
- Y軸
- ツールチップ
- 凡例
- 座標
"use client";

import {
  Area,
  Bar,
  CartesianGrid,
  ComposedChart,
  Legend,
  Line,
  Tooltip,
  XAxis,
  YAxis,
} from "recharts";
import { data } from "./data";

export default function ComposedCharts() {
  return (
    <ComposedChart width={800} height={450} data={data}>
      <XAxis dataKey="name" />
      <YAxis />
      <Tooltip />
      <Legend />
      <CartesianGrid stroke="#f5f5f5" />
      <Area dataKey="amt" fill="#adffff" stroke="#7fbfff" />
      <Bar dataKey="pv" barSize={20} fill="#7fff7f" />
      <Line dataKey="uv" stroke="#ff7f7f" />
    </ComposedChart>
  );
}


