はじめに
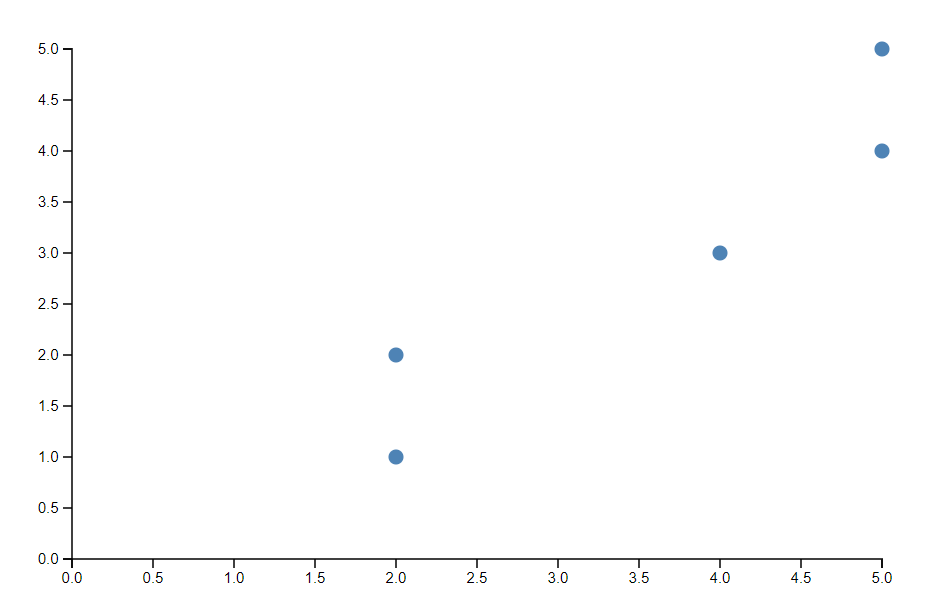
この記事では、JavaScript 向けのデータ可視化ライブラリである D3 を使って、散布図 (Scatter Chart) を実装する手順を記載します。
開発環境
開発環境は以下の通りです。
- Windows 11
- Next.js 14.2.4
- React 18.3.1
- TypeScript 5.5.2
- D3 7.9.0
- @types/d3 7.4.3
実装
要素ごとに実装を進めていきます。
固定値
これから作成する散布図では、X軸に count、Y軸に score を表示します。
export const data = [
  {
    score: 1,
    count: 2,
  },
  {
    score: 2,
    count: 2,
  },
  {
    score: 3,
    count: 4,
  },
  {
    score: 4,
    count: 5,
  },
  {
    score: 5,
    count: 5,
  },
];
  const width = 600;
  const height = 400;
  const margin = { top: 20, right: 20, bottom: 40, left: 40 };
データの出力範囲の指定
以下の関数を利用して、X方向・Y方向のデータの出力範囲を指定します。
X方向(水平方向)では、count の0から最大値までの値を margin を除いた width に表示します。
  const xScale = d3
    .scaleLinear()
    .domain([0, d3.max(data, (d) => d.count) || 0]) // `count` values mapped to x-axis
    .range([margin.left, width - margin.right]);
Y方向(垂直方向)では、score の0から最大値までの値を margin を除いた height に表示します。
  const yScale = d3
    .scaleLinear()
    .domain([0, d3.max(data, (d) => d.score) || 0])
    .range([height - margin.bottom, margin.top]);
散布図のレンダリング
データの出力範囲が指定できたので、画面上に散布図をレンダリングします。
まず、<svg> タグを利用して散布図全体のサイズを指定します。
  return (
    <svg width={width} height={height}></svg>
  );
次は <svg> タグ内に散布図のドットを表示します。各ドットは、<circle> タグを使って表示します。
<circle> タグの属性(props)には以下の値を渡します。
  return (
    <svg width={width} height={height}>
      {data.map((d, i) => (
        <circle
          key={i}
          cx={xScale(d.count)}
          cy={yScale(d.score)}
          r={5}
          fill="steelblue"
        />
      ))}
    </svg>
  );
X軸 / Y軸の作成
次は X軸 / Y軸を作成して、それぞれどのような値を表示するかわかるようにします。
SVG の <g> (group) タグ内に軸を作成します。<g> タグを使うことで、SVGキャンバス上に表示する軸の位置指定を簡単にできます。
  // Create refs for axes
  const xAxisRef = useRef<SVGGElement>(null);
  const yAxisRef = useRef<SVGGElement>(null);

  // Set up x-axis and y-axis with useEffect to handle D3 rendering
  useEffect(() => {
    if (xAxisRef.current) {
      const xAxis = d3.axisBottom(xScale);
      d3.select(xAxisRef.current).call(xAxis);
    }

    if (yAxisRef.current) {
      const yAxis = d3.axisLeft(yScale);
      d3.select(yAxisRef.current).call(yAxis);
    }
  }, [xScale, yScale]);
完成
最終的なコードを画面は以下の通りです。
"use client";

import * as d3 from "d3";
import { data } from "./data";
import { useRef, useEffect } from "react";

const width = 600;
const height = 400;
const margin = { top: 20, right: 20, bottom: 40, left: 40 };

export default function Page() {
  const xScale = d3
    .scaleLinear()
    .domain([0, d3.max(data, (d) => d.count) || 0]) // `count` values mapped to x-axis
    .range([margin.left, width - margin.right]);

  const yScale = d3
    .scaleLinear()
    .domain([0, d3.max(data, (d) => d.score) || 0]) // `score` values mapped to y-axis
    .range([height - margin.bottom, margin.top]);

  // Create refs for axes
  const xAxisRef = useRef<SVGGElement>(null);
  const yAxisRef = useRef<SVGGElement>(null);

  // Set up x-axis and y-axis with useEffect to handle D3 rendering
  useEffect(() => {
    if (xAxisRef.current) {
      const xAxis = d3.axisBottom(xScale);
      d3.select(xAxisRef.current).call(xAxis);
    }

    if (yAxisRef.current) {
      const yAxis = d3.axisLeft(yScale);
      d3.select(yAxisRef.current).call(yAxis);
    }
  }, [xScale, yScale]);

  return (
    <svg width={width} height={height}>
      {data.map((d, i) => (
        <circle
          key={i}
          cx={xScale(d.count)}
          cy={yScale(d.score)}
          r={5}
          fill="steelblue"
        />
      ))}

      {/* X-axis */}
      <g ref={xAxisRef} transform={`translate(0, ${height - margin.bottom})`} />

      {/* Y-axis */}
      <g ref={yAxisRef} transform={`translate(${margin.left}, 0)`} />
    </svg>
  );
}


