はじめに
この記事では、React 向けのチャート(グラフ)ライブラリである Recharts を Next.js App Router で利用する方法を記載します。
Recharts は JavaScript 向けデータ可視化ライブラリである D3 をベースに作成されています。
D3 に比べ、少ないコード量でチャートを実装できます。D3 を利用したチャートの実装方法については、以下の記事で記載しています。
開発環境
開発環境は以下の通りです。
- Windows 11
- Next.js 14.2.4
- React 18.3.1
- TypeScript 5.5.2
- Recharts 2.12.7
インストール
まずは Recharts をインストールします。
npm install recharts
折れ線グラフコンポーネントの作成
インストールした Recharts を利用して、シンプルな折れ線グラフコンポーネントを作成します。
表示するデータは以下の通りです。
const data = [
  { name: "A", value: 400 },
  { name: "B", value: 200 },
  { name: "C", value: 300 },
  { name: "D", value: 350 },
  { name: "E", value: 300 },
折れ線グラフ(Line Chart)を表示するためには Recharts が提供する以下2つのコンポーネントを利用します。
-
LineChart: グラフ全体 -
Line: グラフに表示する折れ線
データは LineChart の data に渡します。
Line の dataKey に折れ線として表示するデータのプロパティを渡します。
import { Line, LineChart } from "recharts";
import { data } from "./data.ts";

export default function LineCharts() {
  return (
    <LineChart width={400} height={400} data={data}>
      <Line type="monotone" dataKey="value" stroke="#8884d8" />
    </LineChart>
  );
}
当初はこれだけで実装完了!と思ったのですが、ServerComponent だとコンパイルエラーになり、折れ線グラフを表示することができません。

ClientComponent へ変更
ServerComponent ではコンパイルエラーになるため、ファイルの先頭に "use client" を追加して ClientComponent にします。
"use client"; // 追加

import { Line, LineChart } from "recharts";
import { data } from "./data.ts";

export default function LineCharts() {
  return (
    <LineChart width={400} height={400} data={data}>
      <Line type="monotone" dataKey="value" stroke="#8884d8" />
    </LineChart>
  );
}
今度はの折れ線グラフが表示されました。
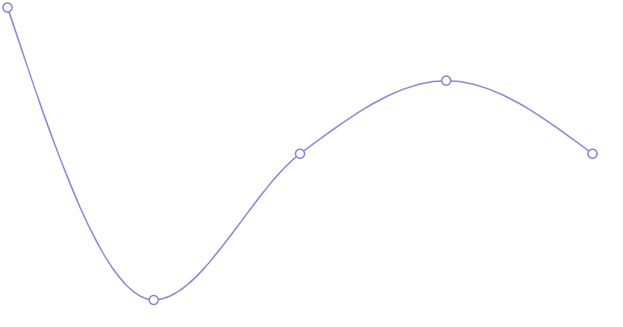
ただ、コンソールログを確認すると、app-index.js:33 Warning: Prop id did not match. Server というエラーが表示されます。

next/dynamic の利用
以下の Issue では、next/dynamic を利用し、SSR を無効にすると改善すると記載があるので、試してみます。
まず別ファイルに先ほどまで実装したコードを移動します。
"use client";

import { Line, LineChart } from "recharts";

const data = [
  { name: "A", value: 400 },
  { name: "B", value: 200 },
  { name: "C", value: 300 },
  { name: "D", value: 350 },
  { name: "E", value: 300 },
];

export default function SimpleLineChart() {
  return (
    <LineChart width={400} height={400} data={data}>
      <Line type="monotone" dataKey="value" stroke="#8884d8" />
    </LineChart>
  );
}
次に page.tsx で上記のコンポーネントを next/dynamic でインポート、レンダリングします。
import dynamic from "next/dynamic";

const DynamicSimpleLineCharts = dynamic(() => import("./SimpleLineChart"), {
  ssr: false,
});

export default function LineCharts() {
  return <DynamicSimpleLineCharts />;
}
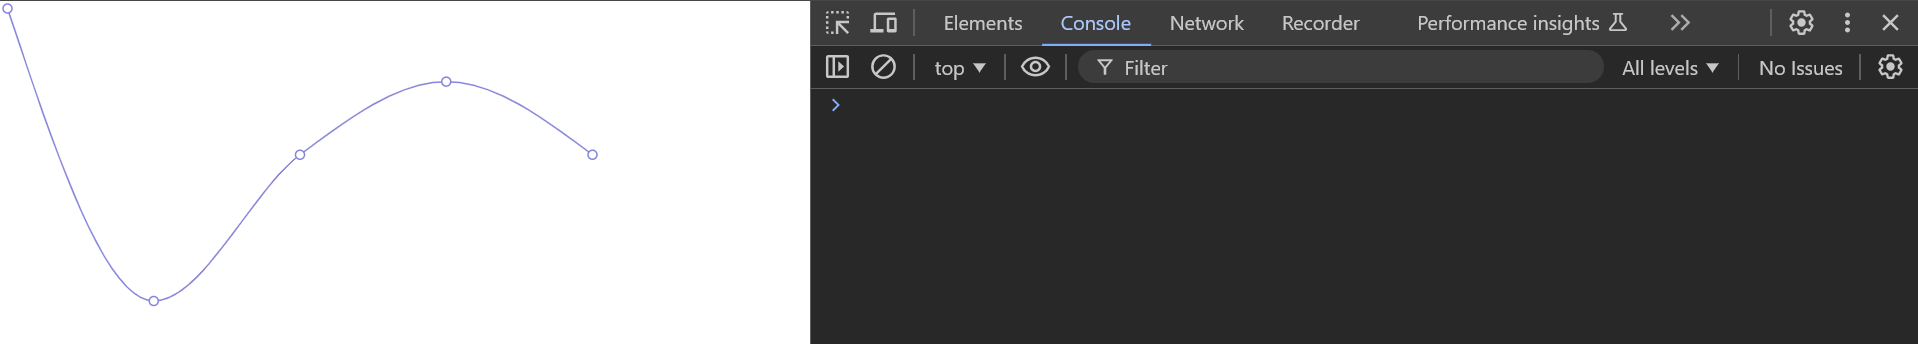
コンソールログのエラーもなく、折れ線グラフをレンダリングできました。
Recharts 2.12.7 では、X軸・Y軸(XAxis YAxis)を表示するとコンソールログにエラーが表示されます。
https://github.com/recharts/recharts/issues/3615
2.13.0 にアップデートすると解消されます。