はじめに
この記事では、MantineCharts の CompositeChart を横向きに表示する方法を記載します。
開発環境
開発環境は以下の通りです。
- Windows 11
- Next.js 14.2.4
- React 18.3.1
- TypeScript 5.5.2
- @mantine/core 7.13.4
- @mantine/hooks 7.13.4
- @mantine/charts 7.13.4
- Recharts 2.13.2
前提1: CompositeChart
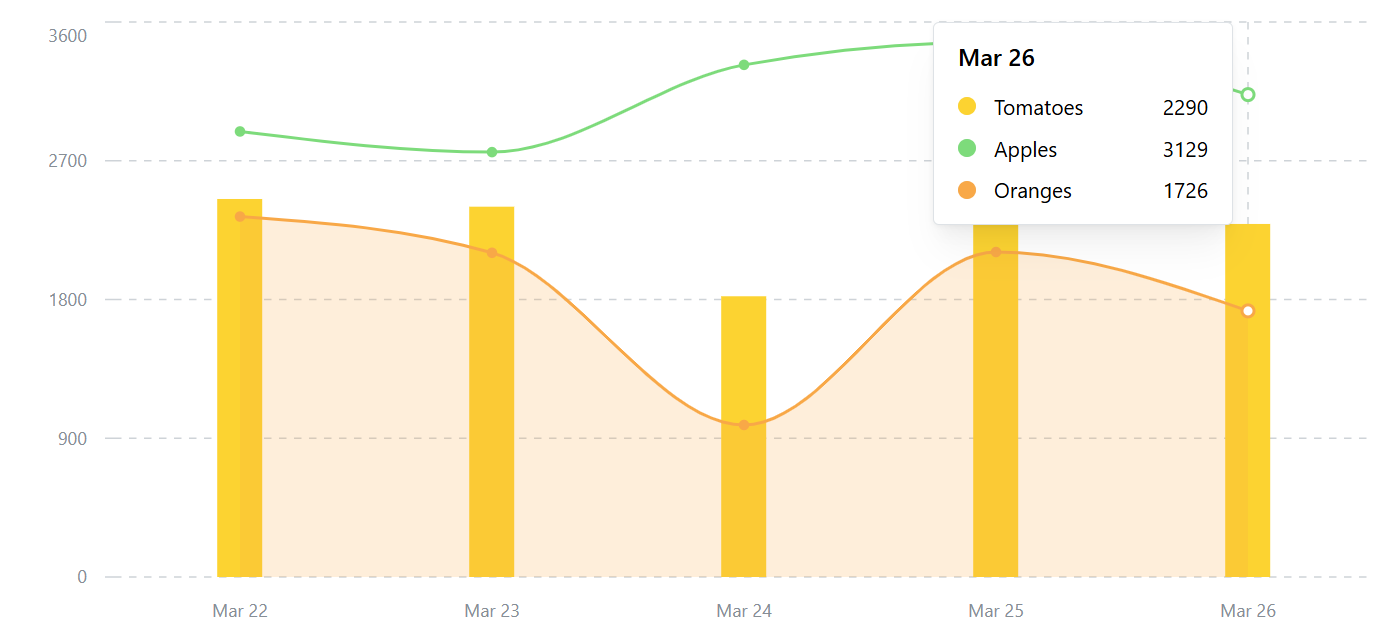
CompositeChart では、LineChart、AreaChart、BarChart をひとつのチャートにまとめて表示できます。
以下のサンプルでは、各チャートで以下の値を表示しています。
-
LineChart: Apples -
AreaChart: Oranges -
BarChart: Tomatoes
また、X軸・Y軸では以下の値を表示しています。
- X軸: date の value
- Y軸: Apples、Oranges、Tomatoes の value
export const data = [
  {
    date: "Mar 22",
    Apples: 2890,
    Oranges: 2338,
    Tomatoes: 2452,
  },
  {
    date: "Mar 23",
    Apples: 2756,
    Oranges: 2103,
    Tomatoes: 2402,
  },
  {
    date: "Mar 24",
    Apples: 3322,
    Oranges: 986,
    Tomatoes: 1821,
  },
  {
    date: "Mar 25",
    Apples: 3470,
    Oranges: 2108,
    Tomatoes: 2809,
  },
  {
    date: "Mar 26",
    Apples: 3129,
    Oranges: 1726,
    Tomatoes: 2290,
  },
];
import { CompositeChart } from "@mantine/charts";
import { data } from "./data";

export default function Page() {
  return (
    <CompositeChart
      h={400}
      data={data}
      dataKey="date"
      maxBarWidth={30}
      series={[
        { name: "Tomatoes", color: "yellow.4", type: "bar" },
        { name: "Apples", color: "green.4", type: "line" },
        { name: "Oranges", color: "orange.4", type: "area" },
      ]}
    />
  );
}
前提2: 横向きの LineChart、AreaChart、BarChart
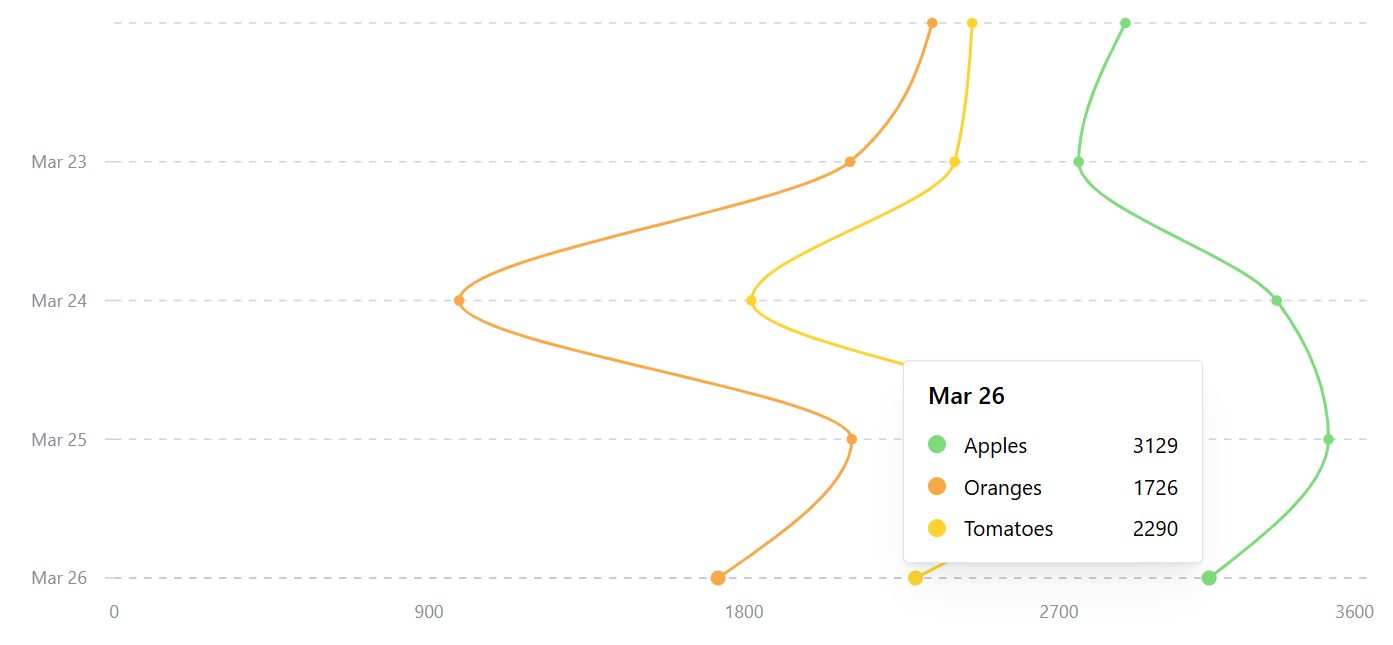
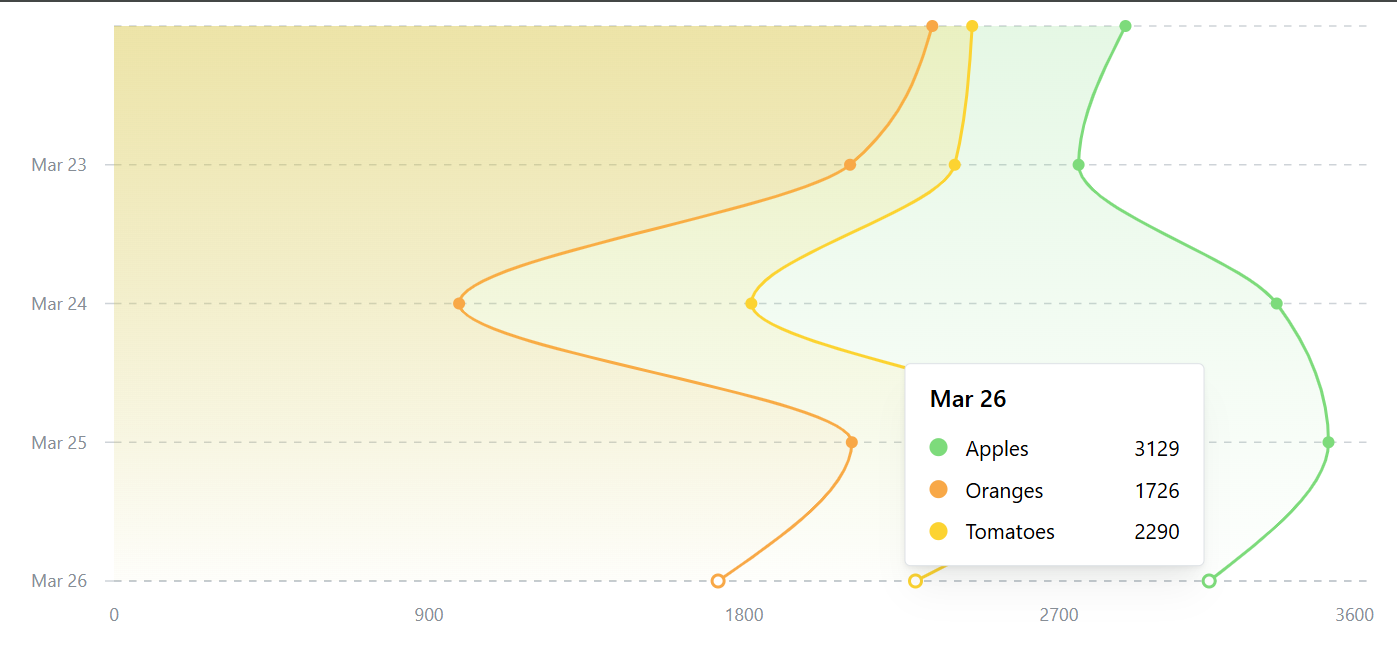
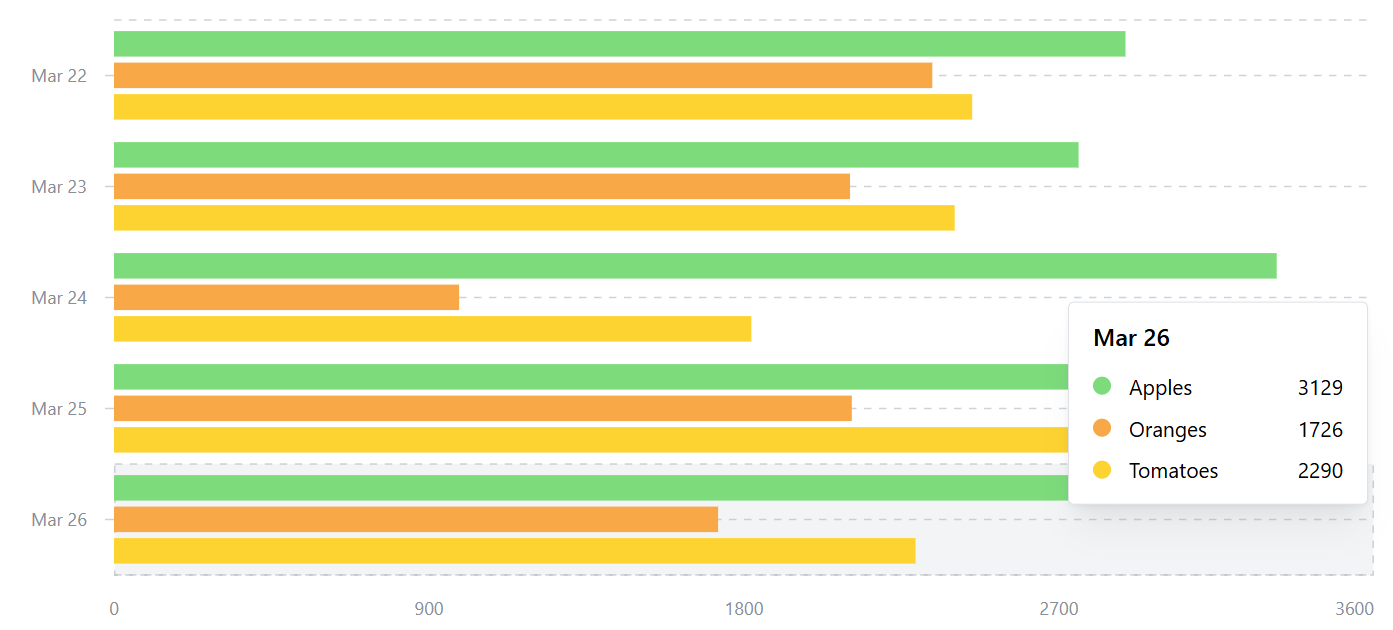
LineChart、AreaChart、BarChart では、orientation="vertical" を設定すれば、横向きのチャートが実装できます。
LineChart
import { LineChart } from "@mantine/charts";
import { data } from "./data";

export default function Page() {
  return (
    <LineChart
      h={400}
      data={data}
      dataKey="date"
      orientation="vertical"
      series={[
        { name: "Apples", color: "green.4" },
        { name: "Oranges", color: "orange.4" },
        { name: "Tomatoes", color: "yellow.4" },
      ]}
    />
  );
}
AreaChart
import { AreaChart } from "@mantine/charts";
import { data } from "./data";

export default function Page() {
  return (
    <AreaChart
      h={400}
      data={data}
      dataKey="date"
      orientation="vertical"
      series={[
        { name: "Apples", color: "green.4" },
        { name: "Oranges", color: "orange.4" },
        { name: "Tomatoes", color: "yellow.4" },
      ]}
    />
  );
}
BarChart
import { BarChart } from "@mantine/charts";
import { data } from "./data";

export default function Page() {
  return (
    <BarChart
      h={400}
      data={data}
      dataKey="date"
      orientation="vertical"
      series={[
        { name: "Apples", color: "green.4" },
        { name: "Oranges", color: "orange.4" },
        { name: "Tomatoes", color: "yellow.4" },
      ]}
    />
  );
}
横向きの CompositeChart を実装する
一方、LineChart、AreaChart、BarChart と異なり、現在のバージョン(7.13.4)では、CompositeChart には orientation prop が用意されていません。
ただ、MantineCharts のベースとなっている Recharts の ComposedChart では、以下の実装をすることで横向きのチャートにすることができます。
-
ComposedChart:layout=vertical -
XAxis:type="number" -
YAxis:type="category" dataKey="name"
※詳しくは、以下の記事に記載があります。
また、CompositeChart では、composedChartProps 経由で Recharts の ComposedChart の設定をできます。
加えて、xAxisProps、yAxisProps 経由で Recharts の Axis、YAxis の設定をできます。
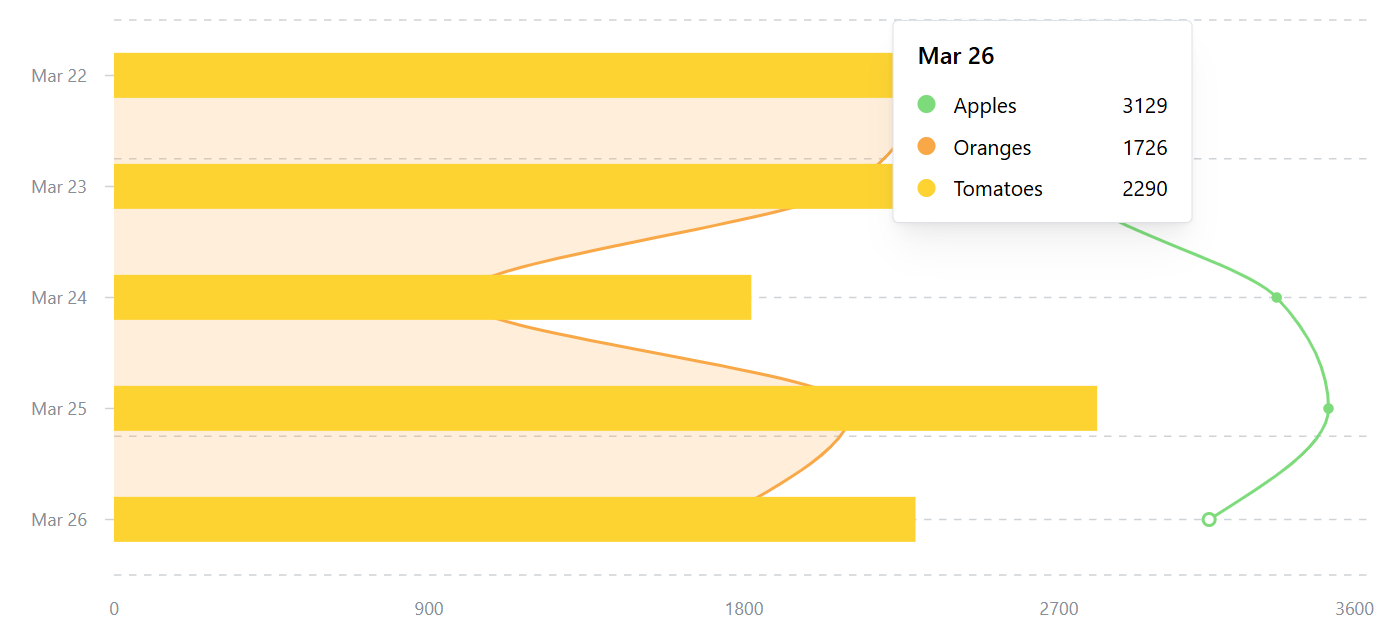
そのため、各設定値を渡すことで CompositeChart でも横向きのチャートを表示できます。
import { CompositeChart } from "@mantine/charts";
import { data } from "./data";

export default function Page() {
  return (
    <CompositeChart
      h={400}
      data={data}
      dataKey="" // dateKey は入力必須の仕様のため、空文字を渡す
      maxBarWidth={30}
      series={[
        { name: "Apples", color: "green.4", type: "line" },
        { name: "Oranges", color: "orange.4", type: "area" },
        { name: "Tomatoes", color: "yellow.4", type: "bar" },
      ]}
      composedChartProps={{ layout: "vertical" }}
      xAxisProps={{ type: "number" }}
      yAxisProps={{ type: "category", dataKey: "date" }}
    />
  );
}
まとめ
- 基本的な設定項目は、MantineCharts で提供されている
- それ以外は、
○○Propsを使って Recharts 経由で設定する
