はじめに
React 向けコンポーネントライブラリである Mantine に含まれるチャート(グラフ)機能の MantineCharts でプラス方向とマイナス方向双方の棒グラフを実装する方法を記載します。
開発環境
開発環境は以下の通りです。
- Windows 11
- Next.js 14.2.4
- React 18.3.1
- TypeScript 5.5.2
- @mantine/core 7.13.4
- @mantine/hooks 7.13.4
- @mantine/charts 7.13.4
- Recharts 2.13.2
実装
series props へ渡す値にマイナス値が含まれていれば、マイナス方向に向かうグラフも追加の実装なしで表示できます。
page.tsx
import { BarChart } from "@mantine/charts";

const data = [
  { month: "January", profit: 120 },
  { month: "February", profit: -190 },
  { month: "March", profit: 40 },
  { month: "April", profit: 100 },
  { month: "May", profit: -80 },
  { month: "June", profit: 75 },
];

export default function Page() {
  return (
    <BarChart
      h={400}
      data={data}
      dataKey="month"
      series={[{ name: "profit", color: "blue.6" }]}
    />
  );
}
動作確認をします。
値のプラス・マイナスに応じて BarChart もプラス・マイナス方向に向かって表示されます。

プラス方向・マイナス方向で色を変える
プラス方向・マイナス方向の違いを目立たせるために色を変えたい場合もあると思います。
しかし、2024年11月時点では、値で色を変えるということは難しそうです。
ただ、データの持ち方を変えることで実現することはできます。以下のようにプラスとマイナスでデータのプロパティを変え、series で各プロパティごとに色を変えることで実現できます。
page.tsx
import { BarChart } from "@mantine/charts";

const data = [
  { month: "January", plusProfit: 120 },
  { month: "February", minusProfit: -190 },
  { month: "March", plusProfit: 40 },
  { month: "April", plusProfit: 100 },
  { month: "May", minusProfit: -80 },
  { month: "June", plusProfit: 75 },
];

export default function Page() {
  return (
    <BarChart
      h={400}
      data={data}
      dataKey="month"
      series={[
        { name: "plusProfit", color: "blue.6" },
        { name: "minusProfit", color: "red.6" },
      ]}
    />
  );
}
以下のようにプラス・マイナスで色を変えることができます。ただ、以下の画像を見てわかるように各棒が中央に表示されていません。
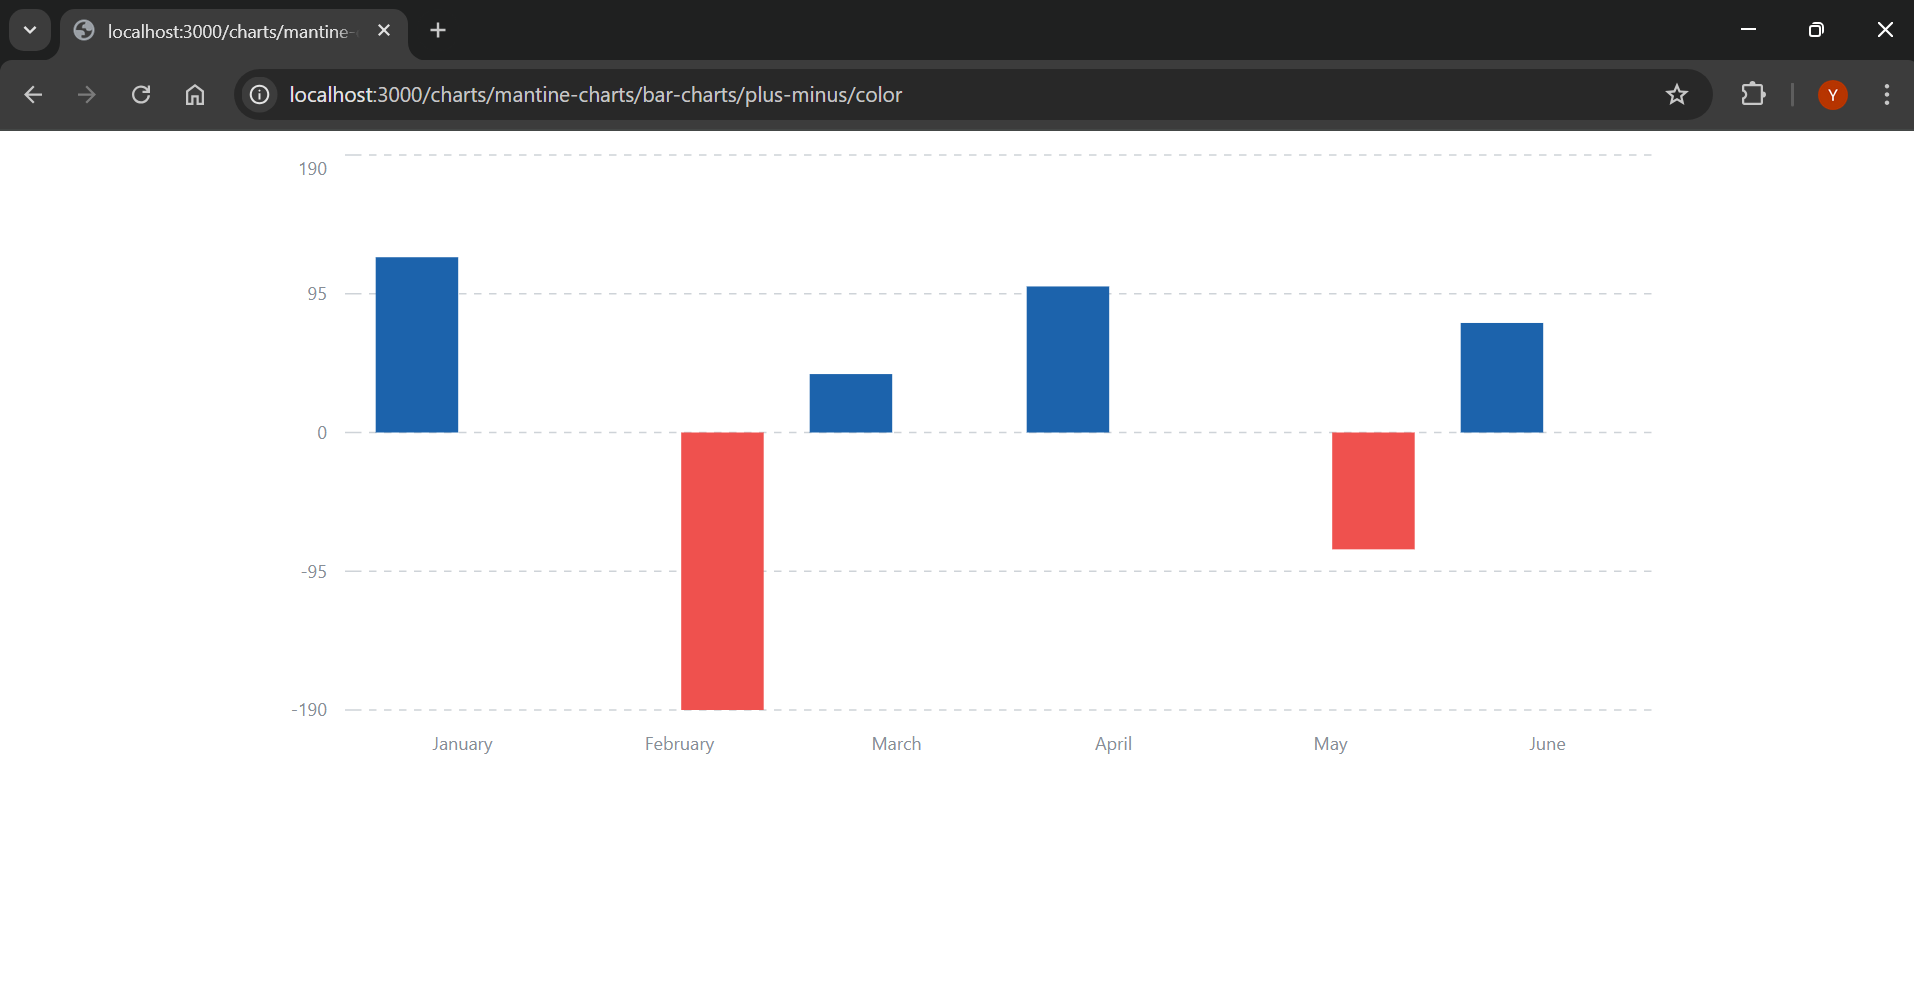
表示位置の問題を解決するため props に type="stacked" を追加します。type="stacked" は以下の記事で解説しているように seris の値を横並びではなく、縦に積み上げ式で表示します。
そのため、結果として中央表示することができます。

関連記事