はじめに
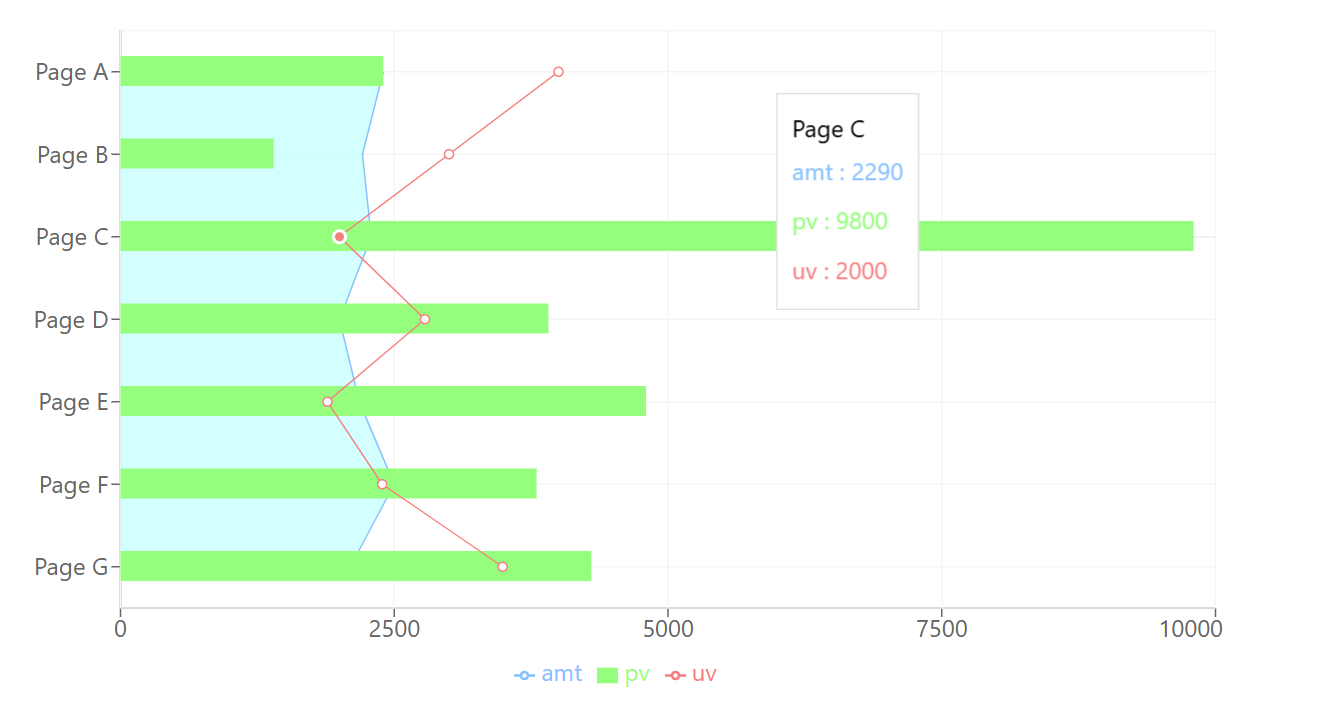
この記事では、React 向けのチャート(グラフ)ライブラリである Recharts を使い、複数のチャートを組み合わせて横向きに表示する方法を記載します。
開発環境
開発環境は以下の通りです。
- Windows 11
- Next.js 14.2.4
- React 18.3.1
- TypeScript 5.5.2
- Recharts 2.13.2
表示するデータ
表示するデータは以下の通りです。
X軸に uv、pv、amt の値、Y軸に name の値を表示します。
export const data = [
  {
    name: "Page A",
    uv: 4000,
    pv: 2400,
    amt: 2400,
  },
  {
    name: "Page B",
    uv: 3000,
    pv: 1398,
    amt: 2210,
  },
  {
    name: "Page C",
    uv: 2000,
    pv: 9800,
    amt: 2290,
  },
  {
    name: "Page D",
    uv: 2780,
    pv: 3908,
    amt: 2000,
  },
  {
    name: "Page E",
    uv: 1890,
    pv: 4800,
    amt: 2181,
  },
  {
    name: "Page F",
    uv: 2390,
    pv: 3800,
    amt: 2500,
  },
  {
    name: "Page G",
    uv: 3490,
    pv: 4300,
    amt: 2100,
  },
];
横向きのチャートを実装する
縦向きのチャートを以下の記事で実装しているので、そちらとの相違点を整理しながら実装していきます。
チャート全体のレイアウト
チャート全体のレイアウトは、ComposedChart の layout プロパティで指定します。'horizontal' と 'vertical' の2種類存在し、デフォルト値は 'horizontal' です。
縦向きのチャートでは、デフォルト値通りで問題なかったですが、横向きのチャートでは、変更する必要があります。
<ComposedChart width={800} height={450} data={data} layout="vertical">
X軸・Y軸に表示する情報
縦向きのチャートでは、それぞれ以下の通りでした。
- X軸:
nameの値(カテゴリー) - Y軸:
uv、pv、amtの値(数値)
<XAxis dataKey="name" />
<YAxis />
横向きのチャートでは、それらを入れ替える必要があります。
- X軸:
uv、pv、amtの値(数値) - Y軸:
nameの値(カテゴリー)
<XAxis />
<YAxis dataKey="name" />
また、X軸・Y軸の軸の種類(type)には、'number' と 'category' の2種類が存在します。
デフォルト値はそれぞれ以下の通りです。
-
XAxis:category -
YAxis:number
縦向きのチャートでは、デフォルト値通りで問題なかったですが、横向きのチャートでは、入れ替わるので、それぞれ props に追加する必要があります。
<XAxis type="number" />
<YAxis type="category" dataKey="name" />
完成
完成したコードは以下の通りです。
"use client";

import {
  Area,
  Bar,
  CartesianGrid,
  ComposedChart,
  Legend,
  Line,
  Tooltip,
  XAxis,
  YAxis,
} from "recharts";
import { data } from "../data";

export default function ComposedCharts() {
  return (
    <ComposedChart width={800} height={450} data={data} layout="vertical">
      <XAxis type="number" />
      <YAxis type="category" dataKey="name" />
      <Tooltip />
      <Legend />
      <CartesianGrid stroke="#f5f5f5" />
      <Area dataKey="amt" fill="#adffff" stroke="#7fbfff" />
      <Bar dataKey="pv" barSize={20} fill="#7fff7f" />
      <Line dataKey="uv" stroke="#ff7f7f" />
    </ComposedChart>
  );
}
Area Chart、Bar Chart、Line Chart を組み合わせたチャートが横向きに表示されます。
