seabornとは
Pythonのグラフ描画のためのライブラリです。。最も有名なライブラであるmatplotlibのラッパー関数(内包プログラム)という位置づけ。簡単に見た目綺麗なグラフの描画が出来る他、一括での処理などの機能もある程度充実しています。細かく指定して描画するならmatplotlib、簡単に綺麗にならseabornのです。
準備
まずは、pipでseabornのライブラリをインストールして下さい。pip?って方はこちら。
ライブラリをインポートします。seabornにsnsという名前をつけてimportします。
import seaborn as sns
サンプルはタイタニックのデータで試してみます。タイタニックがわからない人は「kaggle タイタニック」で調べて下さい。
pandasでデータフレームを作ります。
dataframe = pd.read_csv('train.csv')
データ件数集計(Countplot)
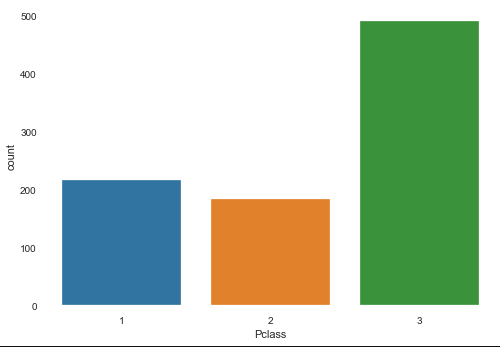
最も基本的なデータの件数の集計可視化です。これにはCountplotを使います。基本的にはY軸は件数なので、X軸のみを指定します。
例として、Pclass(部屋の等級)と件数の関係を描画します。X軸xにPclass、元データdataにdataframeを指定します。
sns.countplot(x="Pclass", data=dataframe)
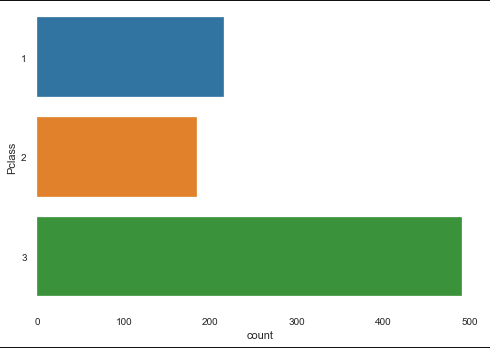
sns.countplot(y="Pclass", data=dataframe)
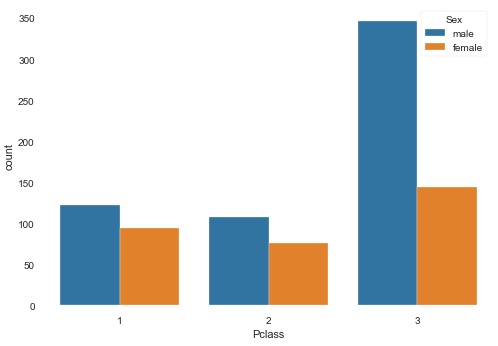
系列を追加する場合はhueを追加します。(例としてhueにSex(性別)を追加します。)
sns.countplot(y="Pclass", data=dataframe, hue='Sex')
その他にも軸の中の順序や色の変更は可能なので、興味があれば調べてみて下さい。
また、ラベルの変更などは、元ラッパー元であるmatplotlibを修正すれば可能ですが、複雑なので省略します。
Countplotだとメリットは感じにくいかもしれません。他のdistplot pairplot jointplot等の方がメリットを感じられると思います。
最後に
初心者にもわかるように、Pythonで機械学習を実施する際の必要な知識を簡便に記事としてまとめております。
目次はこちらになりますので、他の記事も参考にして頂けると幸いです。


