概要
こんにちは。とある学生です。
少しプログラムに慣れてきたので、今更ながら自分なりに簡単なプログラムを丁寧にメモしておきたいと思います。
今回は、たくさん書いている方はいらっしゃいますが、基礎として
y=sin(x)をPython3のchainerを使って学習プログラムについて書かせていただきます。
使用するモジュール(グラフなど)についてもメモしていきます。
何かご指摘・質問等ございましたら、ご遠慮なくコメント欄にお願い致します。
コード全体(GitHub)
コードはGitHubで公開しています。
https://github.com/kazu-ojisan/NN-chainer_PredictSinWave
環境(バージョン等)
MacOS 10.14.2
Anaconda3-4.4.0
python3.5.5
chainer4.0.0
学習の詳細
- $Input$ :$0 〜 2\pi$
- $Output$ :$y=\sin{(input)}$
- 学習回数:$1000$
- バッチサイズ:$10$ (ミニバッチ法)
- 学習データ数:$1000$
- テストデータ数:$200$
モデル構造
- 中間層:2層(ユニット数:10)
- 活性化関数:ReLU or Sigmoid
実装
使用モジュール
import numpy as np # 配列
import time # 時間
from matplotlib import pyplot as plt # グラフ
import os # ディレクトリを操作(意外と便利)

# chainer
from chainer import Variable, optimizers, serializers
from chainer import Link, Chain, ChainList
import chainer.functions as F
import chainer.links as L
データセット
# y=sin(x)のデータセットをN個分作成
def get_data(N, Nte):
    x = np.linspace(0, 2 * np.pi, N+Nte)
    # 学習データとテストデータに分ける
    ram = np.random.permutation(N+Nte)
    x_train = np.sort(x[ram[:N]])
    x_test = np.sort(x[ram[N:]])

    t_train = np.sin(x_train)
    t_test = np.sin(x_test)

    return x_train, t_train, x_test, t_test
Neural Network構造・順伝播等
Neural Net Classを作成。(SIN_NNクラス)
モデルに関する処理はなるべく、SIN_NNに記述する。
ChainerではVariable型というデータ型に変更して計算しなければならない。
Variable型は、np.float32, np,int32のように32ビットにしか対応していないようなので、合わせる必要がある。
class SIN_NN(Chain):
    def __init__(self, h_units, act):
        super(SIN_NN, self).__init__()
        with self.init_scope():
            self.l1=L.Linear(1, h_units[0])
            self.l2=L.Linear(h_units[0], h_units[1])
            self.l3=L.Linear(h_units[1], 1)

            if act == "relu":
                self.act = F.relu
            elif act == "sig":
                self.act = F.sigmoid

    def __call__(self, x, t):
        x = Variable(x.astype(np.float32).reshape(x.shape[0],1))
        t = Variable(t.astype(np.float32).reshape(t.shape[0],1))
        # Mean Squared Error (平均二乗誤差)
        return F.mean_squared_error(self.forward(x), t)

    def forward(self, x):
        h = self.act(self.l1(x))
        h = self.act(self.l2(h))
        h = self.l3(h)

        return h

    def predict(self, x):
        x = Variable(x.astype(np.float32).reshape(x.shape[0],1))
        y = self.forward(x)

        return y.data
回帰問題の場合、誤差の算出は、Mean Squared Error (平均二乗誤差)で行う。
        # Mean Squared Error (平均二乗誤差)
        return F.mean_squared_error(self.forward(x), t)
MSE=\frac{1}{n}\sum_{k=1}^{n}(y_i-t_i)^2
n:データ数,
y_i:出力,
t_i:教師
学習
学習の処理も関数化しているが、これは後々、中間層のユニット数や活性化関数等の変更を簡略化するためである。比較のためにのちに変更する可能性があるものを引数に設定しておく。
以下は学習部分全体。細かく見ていきます。
# (学習部分全体)
def training(N, Nte, bs, n_epoch, h_units, act):

    # データセットの取得
    x_train, t_train, x_test, t_test = get_data(N, Nte)

    # ①モデルセットアップ
    model = SIN_NN(h_units, act)
    optimizer = optimizers.Adam()
    optimizer.setup(model)

    # loss格納のための配列
    tr_loss = []
    te_loss = []

    # ディレクトリを作成
    if os.path.exists("Results/Pred") == False:
        os.makedirs("Results/Pred")

    # 時間を測定
    start_time = time.time()
    print("START")

    # ②学習ループ(ミニバッチ法)
    for epoch in range(1, n_epoch + 1):
        perm = np.random.permutation(N)
        sum_loss = 0
        for i in range(0, N, bs):
            x_batch = x_train[perm[i:i + bs]]
            t_batch = t_train[perm[i:i + bs]]

            # ③モデルのアップデート
            model. cleargrads()
            loss = model(x_batch,t_batch)
            loss.backward()
            optimizer.update()
            sum_loss += loss.data * bs

        # 学習誤差の平均を計算
        ave_loss = sum_loss / N
        tr_loss.append(ave_loss)

        # ④テスト誤差
        loss = model(x_test,t_test)
        te_loss.append(loss.data)

        # 学習過程を出力
        if epoch % 100 == 1:
            print("Ep/MaxEp     tr_loss     te_loss")

        if epoch % 10 == 0:
            print("{:4}/{}  {:10.5}   {:10.5}".format(epoch, n_epoch, ave_loss, float(loss.data)))

            # ⑤リアルタイムにグラフ表示
            plt.plot(tr_loss, label = "training")
            plt.plot(te_loss, label = "test")
            plt.yscale('log')
            plt.legend()
            plt.grid(True)
            plt.title("LOSS")
            plt.xlabel("epoch")
            plt.ylabel("loss (MSE)")
            plt.pause(0.1)  # このコードによりリアルタイムにグラフが表示されたように見える
            plt.clf()

        if epoch % 20 == 0:
            # epoch20ごとのテスト予測結果
            y_test = model.predict(x_test)
            plt.plot(x_test, t_test, label = "answer")
            plt.plot(x_test, y_test, label = "prediction")
            plt.legend()
            plt.grid(True)
            plt.xlim(0, 2 * np.pi)
            plt.ylim(-1.2, 1.2)
            plt.title("PREDICTION of TEST SAMPLES")
            plt.xlabel("x")
            plt.ylabel("y")
            plt.savefig("Results/Pred/ep{}.png".format(epoch))
            plt.clf()

    print("FINISH")

    # 経過時間
    total_time = int(time.time() - start_time)
    print("Time : {} [s]".format(total_time))

    # 誤差のグラフ作成
    plt.plot(tr_loss, label = "training")
    plt.plot(te_loss, label = "test")
    plt.yscale('log')
    plt.legend()
    plt.grid(True)
    plt.title("LOSS")
    plt.xlabel("epoch")
    plt.ylabel("loss (MSE)")
    plt.savefig("Results/loss_history.png")
    plt.clf()

    # 最終のテスト予測結果
    y_test = model.predict(x_test)
    plt.plot(x_test, t_test, label = "answer")
    plt.plot(x_test, y_test, label = "prediction")
    plt.legend()
    plt.grid(True)
    plt.xlim(0, 2 * np.pi)
    plt.ylim(-1.2, 1.2)
    plt.title("PREDICTION of TEST SAMPLES")
    plt.xlabel("x")
    plt.ylabel("y")
    plt.savefig("Results/Pred/ep{}.png".format(epoch))
    plt.clf()

    # 学習済みモデルの保存
    serializers.save_npz("Results/Model.model",model)


if __name__ == "__main__":

    # 設定
    N = 1000             # 学習データ
    Nte = 200           # テストデータ数
    bs = 10             # バッチサイズ
    n_epoch = 1000       # 学習回数
    h_units = [10, 10]  # ユニット数 [中間層1 中間層2]
    act = "relu"        # 活性化関数

    training(N, Nte, bs, n_epoch, h_units, act)
①モデルのセットアップ
ここでSIN_NNクラスのインスタンスを作成。
そして、最適化手法をセットする。
    model = SIN_NN(h_units, act)
    optimizer = optimizers.Adam()
    optimizer.setup(model)
②学習ループ(ミニバッチ法)
ミニバッチ法を適用し、学習回数分ループする。
データ列はエポックごとにシャッフルする。
    for epoch in range(1, n_epoch + 1):
        perm = np.random.permutation(N)
        sum_loss = 0
        for i in range(0, N, bs):
            x_batch = x_train[perm[i:i + bs]]
            t_batch = t_train[perm[i:i + bs]]
③モデルのアップデート
ここのコードによって、モデルのパラメータが更新されてゆく。
- 勾配の初期化
- 誤差の取得
- バックプロパゲーション
- モデルのアップデート
上記でも書いたように、chainerで処理するにはVariable型でなければいけない。
ここで、lossがnumpy型であると、更新は上手くいかない上に、エラーが表示されない。
    model. cleargrads()
    loss = model(x_batch,t_batch)
    loss.backward()
    optimizer.update()
④テスト誤差
無論、ここで入力するデータに、学習データを混ぜてはいけない。
また、Dropout関数を学習中に使用している場合、ここのテストでは使用すべきではない。
     loss = model(x_test,t_test)
     te_loss.append(loss.data)
⑤リアルタイムにグラフ表示
リアルタイムに誤差グラフをチェックしたく、いつもこのように記述している。
ループ中のplt.pause()によって実現可能。
      plt.plot(tr_loss, label = "training")
      plt.plot(te_loss, label = "test")
      plt.yscale('log')
      plt.legend()
      plt.grid(True)
      plt.title("LOSS")
      plt.xlabel("epoch")
      plt.ylabel("loss (MSE)")
      plt.pause(0.1)  # このコードによりリアルタイムにグラフが表示されたように見える
      plt.clf()
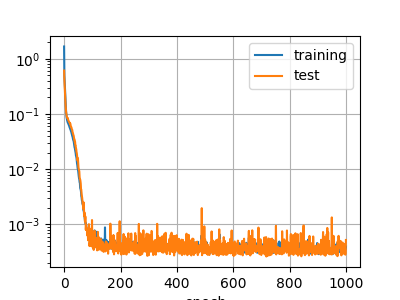
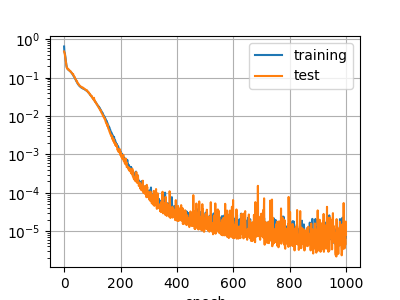
結果
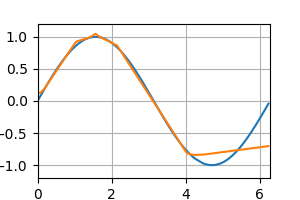
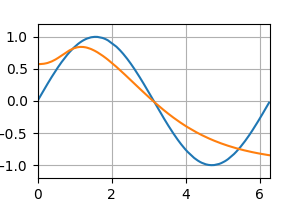
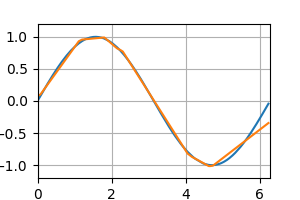
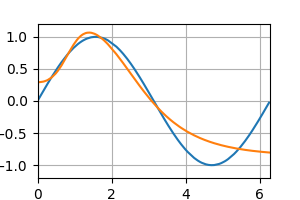
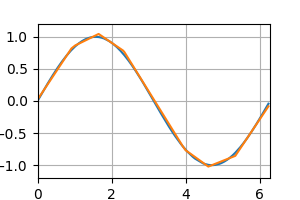
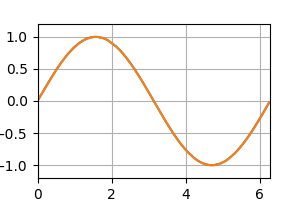
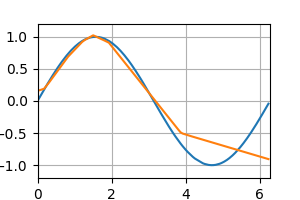
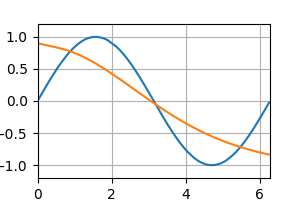
テストデータの予測 [左:ReLU, 右:Sigmoid]
epoch : 20
My tips
- 配列のappendを使用する場合は、numpyよりlistの方が速いので、ループ中はlistでappendを使用した方が良い。
- バッチサイズは少なすぎると、学習誤差の収束が早くなり、過学習を起こしやすくなるイメージあり。
- Sigmoid関数といった微分値が小さい活性化関数は勾配消失問題の原因となっているが、それは画像などを扱うような中間層が多い場合のことで、本記事で扱った規模のNNにはあまり関係しない。
終わりに
実際に記事を書いてみると、まだまだわかってないことがあることに気づきます。
また気づきがあれば、追加していきます。
コード全体(GitHub)
GitHubで公開しています。
https://github.com/kazu-ojisan/NN-chainer_PredictSinWave
