3月5日更新:グラフ追加
Rでアニメーションで動くグラフが作れるらしいということで、メモ。
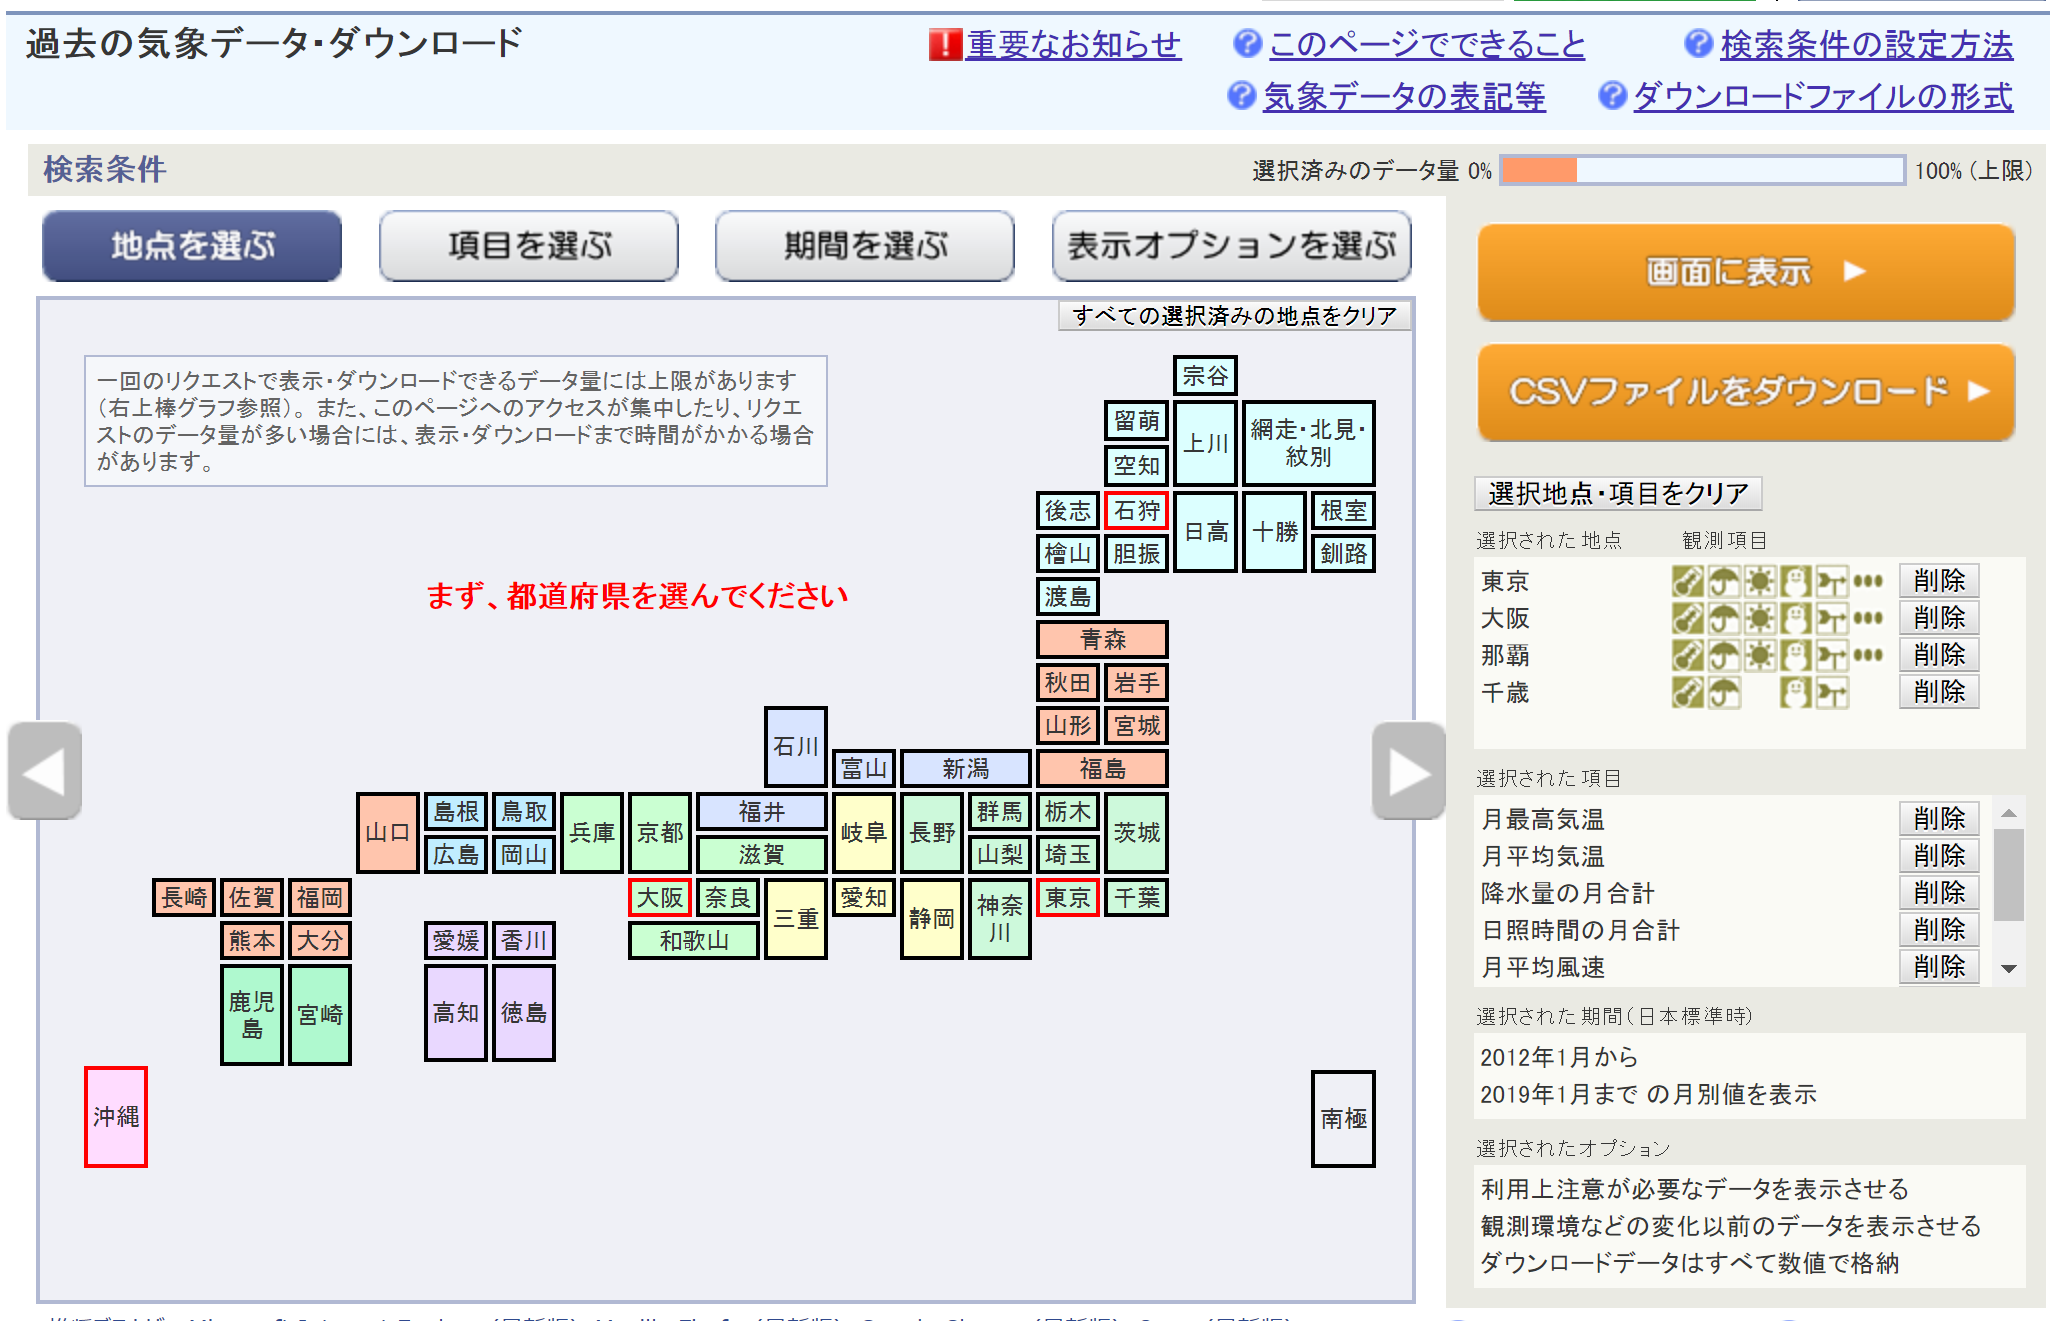
画像は気象庁からDLしたデータから作成した適当グラフです。

パッケージ
gganimateというパッケージでアニメーションによるグラフ作成が可能。
詳細は下記のページを参考
installしたパッケージ
- gganimate
- transformr
- magick
- tweenr
- gifski
詳細はこちら
- [gganimate: A Grammar of Animated Graphics]
(https://cloud.r-project.org/web/packages/gganimate/index.html)
使用したデータ
気象庁から日本の気象データをサンプルで引っ張ってみました。
気温や降水量や風速など様々な気象情報を地区別で選択してcsvでダウンロードできます。
容量には上限があるようです。

不要な情報を削除、操作して下記のようなggplot2で可視化するためにlongデータに加工しました。(kisho_long)
対象地区は4地区、
現象列は、6項目を抽出
> head(kisho_long,10)
         年月 地区 気象情報         現象
1  2012-01-01 東京     11.1 .最高気温...
2  2012-02-01 東京     15.4 .最高気温...
3  2012-03-01 東京     19.4 .最高気温...
4  2012-04-01 東京     26.0 .最高気温...
5  2012-05-01 東京     27.2 .最高気温...
6  2012-06-01 東京     30.2 .最高気温...
7  2012-07-01 東京     35.4 .最高気温...
8  2012-08-01 東京     35.7 .最高気温...
9  2012-09-01 東京     33.8 .最高気温...
10 2012-10-01 東京     31.0 .最高気温...

> unique(kisho_long$地区)
[1] "東京" "大阪" "那覇" "千歳"

> unique(kisho_long$現象)
[1] ".最高気温..."      ".平均気温..."      ".降水量の合計.mm."
[4] ".日照時間.時間."   ".平均風速.m.s."    ".平均雲量.10分比."

> str(kisho_long)
'data.frame':	2040 obs. of  4 variables:
 $ 年月    : Date, format: "2012-01-01" "2012-02-01" ...
 $ 地区    : chr  "東京" "東京" "東京" "東京" ...
 $ 気象情報: num  11.1 15.4 19.4 26 27.2 30.2 35.4 35.7 33.8 31 ...
 $ 現象    : chr  ".最高気温..." ".最高気温..." ".最高気温..." ".最高気温..." ...
コード
以下コード。
library(tidyverse)
library(ggplot2)
library(gganimate)
library(transformr)
library(magrittr)

graph1 <- ggplot(aes(y = 気象情報, x = 年月, colour = 地区), data = kisho_long) +
  geom_path(size = 0.5) +
  theme(axis.text = element_text(size = 30),
        axis.title = element_text(size = 40),
        text = element_text(size = 30),
        axis.text.x = element_text(size = 28),
        axis.text.y = element_text(size = 28),
        legend.title = element_text(size = 30))

# 通常と違うのはtransirion~のみ
graph1 <- graph1 + facet_wrap(~現象, scales = "free") + transition_reveal(年月)

animate(graph1, width = 1200, height = 1000)
通常のggplotにtransition_revealを加えるだけでアニメーションになります。

もう少しお試し。
# 年月・地区はlong、その他をwideに展開
kisho_wide <- kisho_long %>% spread(key = 現象, value = 気象情報, fill = NA)

>str(kisho_wide)
  'data.frame':	340 obs. of  8 variables:
 $ 年月             : Date, format: "2012-01-01" "2012-01-01" "2012-01-01" ...
 $ 地区             : chr  "千歳" "大阪" "東京" "那覇" ...
 $ .降水量の合計.mm.: num  31.5 34 50 119 13 ...
 $ .最高気温...     : num  2 11.5 11.1 23.6 2.6 13.5 15.4 25 9.6 21 ...
 $ .日照時間.時間.  : num  NA 147.3 183 54.4 NA ...
 $ .平均雲量.10分比.: num  NA 6.9 5 8.8 NA 7 6.4 9 NA 6.9 ...
 $ .平均気温...     : num  -8.7 5.6 4.8 17 -8.1 5.1 5.4 17.5 -1.7 9.1 ...
 $ .平均風速.m.s.   : num  2.8 2.7 2.7 5.3 3.3 2.7 2.9 5.2 4 2.7 ...

# グラフ化(ラベル、適当なままですみません)
graph2 <- ggplot(aes(y = kisho_wide[,3], x = kisho_wide[,4], size = .平均風速.m.s., colour = 地区), data = kisho_wide) +
 geom_point() + xlab("最高気温℃") + ylab("降水量㎣") + labs(size = "平均風速m/s")

# {frame_time}でラベルに変化。shadow_wakeで残像の時間を設定できる。
graph2 <- graph2 + transition_time(年月) + labs(title = "Year: {frame_time}") +
  shadow_wake(wake_length = 0.15, alpha = FALSE) + facet_wrap(~地区)

animate(graph2, width = 1000, height = 800)

おわりに
ドキュメントを読み込めばもっといろいろできそうです。
ただ、作ってみたはいいものの、今回のデータなら素直に静止画面で見たほうが情報をしっかり把握できそう。
見る側はただのグラフ出すより注目しそうですが、使い道は場合によって選んだほうが良いですね。