はじめに
OpenShiftの勉強中に調べて、残しておきたいと思ったものを記事にしました。
「CodeReady Containers」ではクラスタモニタリング(prometheus,alertmanager,grafana,kube-state-metrics,node-exporter)が無効になっているのですが、「Getting Started Guide」を参考にして有効にしました。
あと、永続ストレージの割り当ても試しています。
環境
- macOS Big Sur v11.2.3
- CodeReady Containers v1.23.1 (OpenShift 4.7)
手順
いつもあやふやになるのですが、setupしてからconfigです。(覚えとけよ、自分)
setupすると、匿名で利用状況の送信するか聞いてきますが、うちの環境はあまりリソース潤沢でパフォーマンスが良いわけではないので「N」にしています。※協力できずにごめんなさい
あと、初回setup時は途中でイメージのダウンロードとインストールをするので、MacOS側のパスワードを聞かれます。
% ./crc setup
CodeReady Containers is constantly improving and we would like to know more about usage (more details at https://developers.redhat.com/article/tool-data-collection)
Your preference can be changed manually if desired using 'crc config set consent-telemetry <yes/no>'
Would you like to contribute anonymous usage statistics? [y/N]: N
No worry, you can still enable telemetry manually with the command 'crc config set consent-telemetry yes'.
INFO Checking if running as non-root
INFO Checking if podman remote executable is cached
INFO Checking if admin-helper executable is cached
INFO Caching admin-helper executable
INFO Using root access: Changing ownership of /Users/haomei/.crc/bin/admin-helper-darwin
Password:
INFO Using root access: Setting suid for /Users/haomei/.crc/bin/admin-helper-darwin
INFO Checking minimum RAM requirements
INFO Checking if HyperKit is installed
INFO Setting up virtualization with HyperKit
INFO Using root access: Changing ownership of /Users/haomei/.crc/bin/hyperkit
INFO Using root access: Setting suid for /Users/haomei/.crc/bin/hyperkit
INFO Checking if crc-driver-hyperkit is installed
INFO Installing crc-machine-hyperkit
INFO Using root access: Changing ownership of /Users/haomei/.crc/bin/crc-driver-hyperkit
INFO Using root access: Setting suid for /Users/haomei/.crc/bin/crc-driver-hyperkit
INFO Checking file permissions for /etc/hosts
INFO Checking file permissions for /etc/resolver/testing
INFO Checking if CRC bundle is extracted in '$HOME/.crc'
INFO Checking if /Users/haomei/.crc/cache/crc_hyperkit_4.7.0.crcbundle exists
INFO Extracting bundle from the CRC executable
INFO Ensuring directory /Users/haomei/.crc/cache exists
INFO Extracting embedded bundle crc_hyperkit_4.7.0.crcbundle to /Users/haomei/.crc/cache
INFO Uncompressing crc_hyperkit_4.7.0.crcbundle
crc.qcow2: 9.97 GiB / 9.97 GiB [-------------------------------------------------------------------------------------------------------------------------------------------] 100.00%
Setup is complete, you can now run 'crc start' to start the OpenShift cluster
つぎはconfigです。
CRCでは使用可能なメモリの値がデフォルトで9GB(9216MiB)になっていますが、クラスタモニタリングを有効にするには、14GiB(14336MiB)以上が推奨となっています。
% ./crc config set memory 16384
Changes to configuration property 'memory' are only applied when the CRC instance is started.
If you already have a running CRC instance, then for this configuration change to take effect, stop the CRC instance with 'crc stop' and restart it with 'crc start'.
便利になったもので、クラスタモニタリングの有効もconfigコマンドでできるようになっています。※かなり嬉しい
% ./crc config set enable-cluster-monitoring true
Successfully configured enable-cluster-monitoring to true
設定したconfigの一覧は、config viewで参照できます。
% ./crc config view
- consent-telemetry                     : no
- enable-cluster-monitoring             : true
- memory                                : 16384
あとは、startで起動させるだけです。
初回起動時は「-p」オプションでpull secretの指定が必要です。
「pull-secret.txt」は事前にデベロッパーサイトから自身のものをダウロードしておいてください。
% ./crc start -p ../pull-secret.txt
INFO Checking if running as non-root
INFO Checking if podman remote executable is cached
INFO Checking if admin-helper executable is cached
INFO Checking minimum RAM requirements
INFO Checking if HyperKit is installed
INFO Checking if crc-driver-hyperkit is installed
INFO Checking file permissions for /etc/hosts
INFO Checking file permissions for /etc/resolver/testing
INFO Loading bundle: crc_hyperkit_4.7.0.crcbundle ...
INFO Creating CodeReady Containers VM for OpenShift 4.7.0...
INFO CodeReady Containers VM is running
INFO Generating new SSH Key pair ...
INFO Updating authorized keys ...
INFO Copying kubeconfig file to instance dir ...
INFO Starting network time synchronization in CodeReady Containers VM
INFO Network restart not needed
INFO Check internal and public DNS query ...
INFO Check DNS query from host ...
INFO Adding user's pull secret to instance disk...
INFO Verifying validity of the kubelet certificates ...
INFO Starting OpenShift kubelet service
INFO Waiting for kube-apiserver availability... [takes around 2min]
INFO Adding user's pull secret to the cluster ...
INFO Updating cluster ID ...
INFO Enabling cluster monitoring operator...
INFO Starting OpenShift cluster ... [waiting for the cluster to stabilize]
INFO 6 operators are progressing: dns, image-registry, network, openshift-controller-manager, operator-lifecycle-manager-packageserver, service-ca
INFO 6 operators are progressing: dns, image-registry, network, openshift-controller-manager, operator-lifecycle-manager-packageserver, service-ca
INFO 6 operators are progressing: dns, image-registry, network, openshift-controller-manager, operator-lifecycle-manager-packageserver, service-ca
INFO 3 operators are progressing: image-registry, openshift-controller-manager, service-ca
INFO 4 operators are progressing: image-registry, monitoring, openshift-controller-manager, service-ca
INFO 2 operators are progressing: console, monitoring
INFO 2 operators are progressing: monitoring, openshift-controller-manager
INFO 2 operators are progressing: kube-apiserver, openshift-controller-manager
INFO 2 operators are progressing: kube-apiserver, openshift-controller-manager
INFO Operator kube-apiserver is progressing
INFO 2 operators are progressing: kube-apiserver, operator-lifecycle-manager-packageserver
INFO 3 operators are progressing: kube-apiserver, monitoring, operator-lifecycle-manager-packageserver
INFO 2 operators are progressing: kube-apiserver, monitoring
INFO All operators are available. Ensuring stability ...
INFO Operators are stable (2/3) ...
INFO Operators are stable (3/3) ...
INFO Updating kubeconfig
WARN The cluster might report a degraded or error state. This is expected since several operators have been disabled to lower the resource usage. For more information, please consult the documentation
Started the OpenShift cluster.

The server is accessible via web console at:
  https://console-openshift-console.apps-crc.testing

Log in as administrator:
  Username: kubeadmin
  Password: T3sJD-jjueE-2BnHe-ftNBw

Log in as user:
  Username: developer
  Password: developer

Use the 'oc' command line interface:
  $ eval $(crc oc-env)
  $ oc login -u developer https://api.crc.testing:6443
ocコマンドを使えるように環境設定します。
% eval $(./crc oc-env)
kubeadminでログインします。
% oc login -u kubeadmin -p T3sJD-jjueE-2BnHe-ftNBw https://api.crc.testing:6443
Login successful.

You have access to 61 projects, the list has been suppressed. You can list all projects with 'oc projects'

Using project "default".
OpenShiftのクラスタモニタリングは「openshift-monitoring」プロジェクト(ネームスペース)にデプロイされます。
% oc get pods -n openshift-monitoring
NAME                                           READY   STATUS    RESTARTS   AGE
alertmanager-main-0                            5/5     Running   0          11m
alertmanager-main-1                            5/5     Running   0          11m
alertmanager-main-2                            5/5     Running   0          11m
cluster-monitoring-operator-686555c948-chw9v   2/2     Running   4          12m
grafana-6f4d96d7fd-kp2dt                       2/2     Running   0          11m
kube-state-metrics-749954d685-sjslc            3/3     Running   0          11m
node-exporter-jfxw4                            2/2     Running   0          11m
openshift-state-metrics-587d97bb47-tsnpd       3/3     Running   0          11m
prometheus-adapter-664dfbdf7b-frrnw            1/1     Running   0          10m
prometheus-adapter-664dfbdf7b-wkshz            1/1     Running   0          10m
prometheus-k8s-0                               7/7     Running   1          11m
prometheus-k8s-1                               7/7     Running   1          11m
prometheus-operator-658ccb589c-686cf           2/2     Running   1          11m
telemeter-client-599864d5f-h6xjp               3/3     Running   0          11m
thanos-querier-665b8bc578-8bj8q                5/5     Running   0          11m
thanos-querier-665b8bc578-cmfqx                5/5     Running   0          11m
動作確認
node単位でメトリクスを参照する場合は、「oc adm top node」を実行します。
% oc adm top nodes
NAME                 CPU(cores)   CPU%   MEMORY(bytes)   MEMORY%
crc-l6qvn-master-0   1397m        34%    10494Mi         65%
pod単位のメトリクスは「oc adm top pod」を実行します。
% oc adm top pods -n openshift-monitoring
NAME                                           CPU(cores)   MEMORY(bytes)
alertmanager-main-0                            2m           73Mi
alertmanager-main-1                            1m           75Mi
alertmanager-main-2                            2m           78Mi
cluster-monitoring-operator-686555c948-chw9v   0m           64Mi
grafana-6f4d96d7fd-kp2dt                       2m           50Mi
kube-state-metrics-749954d685-sjslc            0m           72Mi
node-exporter-jfxw4                            18m          26Mi
openshift-state-metrics-587d97bb47-tsnpd       0m           44Mi
prometheus-adapter-664dfbdf7b-frrnw            5m           38Mi
prometheus-adapter-664dfbdf7b-wkshz            2m           36Mi
prometheus-k8s-0                               37m          828Mi
prometheus-k8s-1                               41m          797Mi
prometheus-operator-658ccb589c-686cf           1m           135Mi
telemeter-client-599864d5f-h6xjp               0m           47Mi
thanos-querier-665b8bc578-8bj8q                4m           74Mi
thanos-querier-665b8bc578-cmfqx                2m           84Mi
Web Consoleで確認します。Web Consoleは、crcコマンドに「console」オプションを指定して実行します。
% ./crc console
Opening the OpenShift Web Console in the default browser...
kubeadminでログインすると、「概要」に各メトリクス値がグラフと共に表示されます。
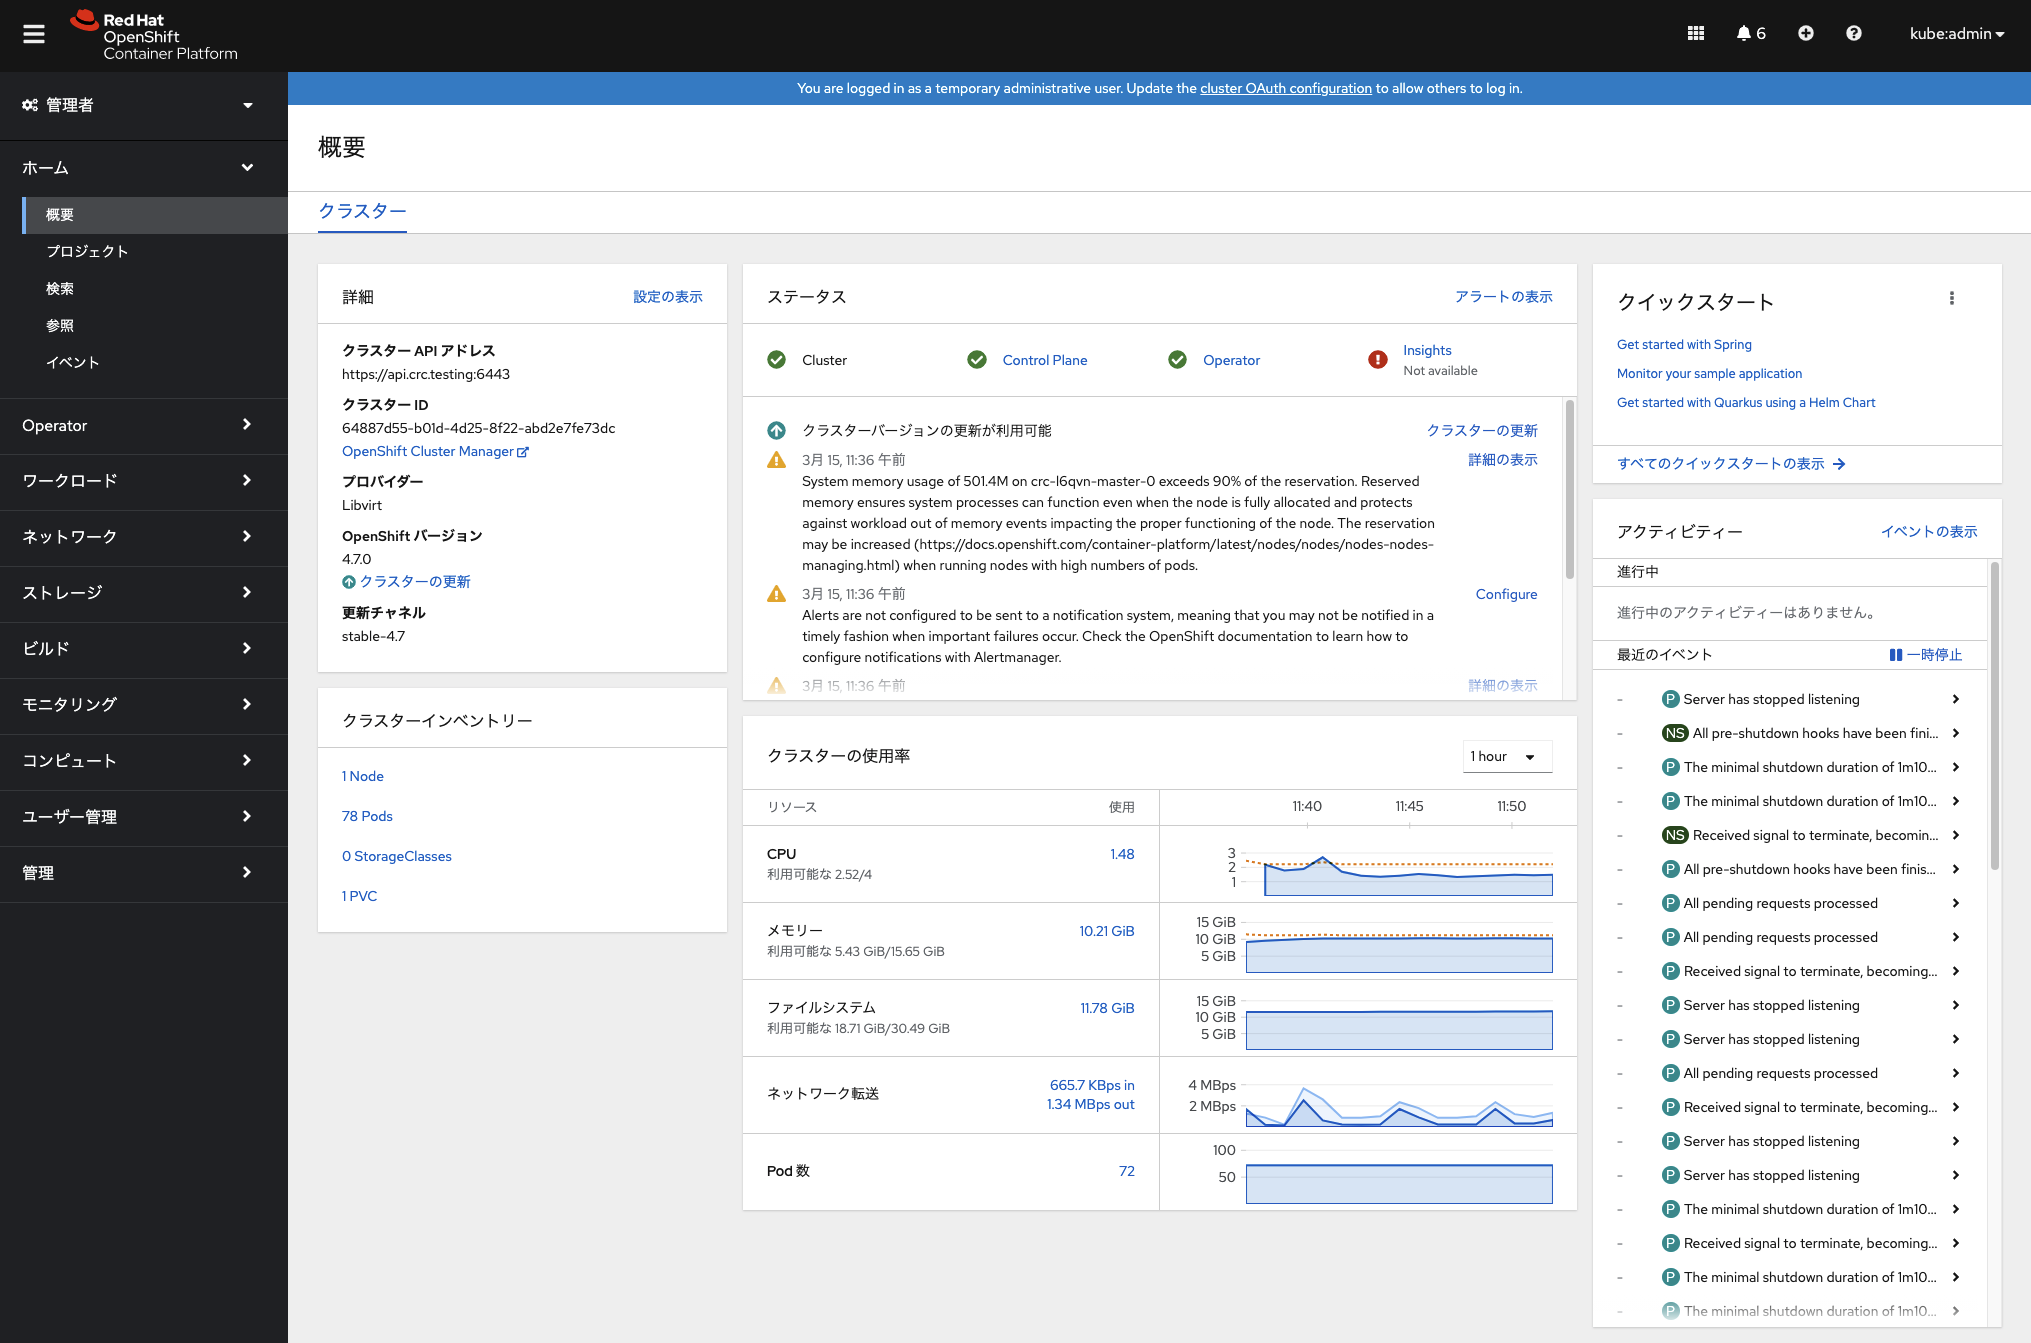
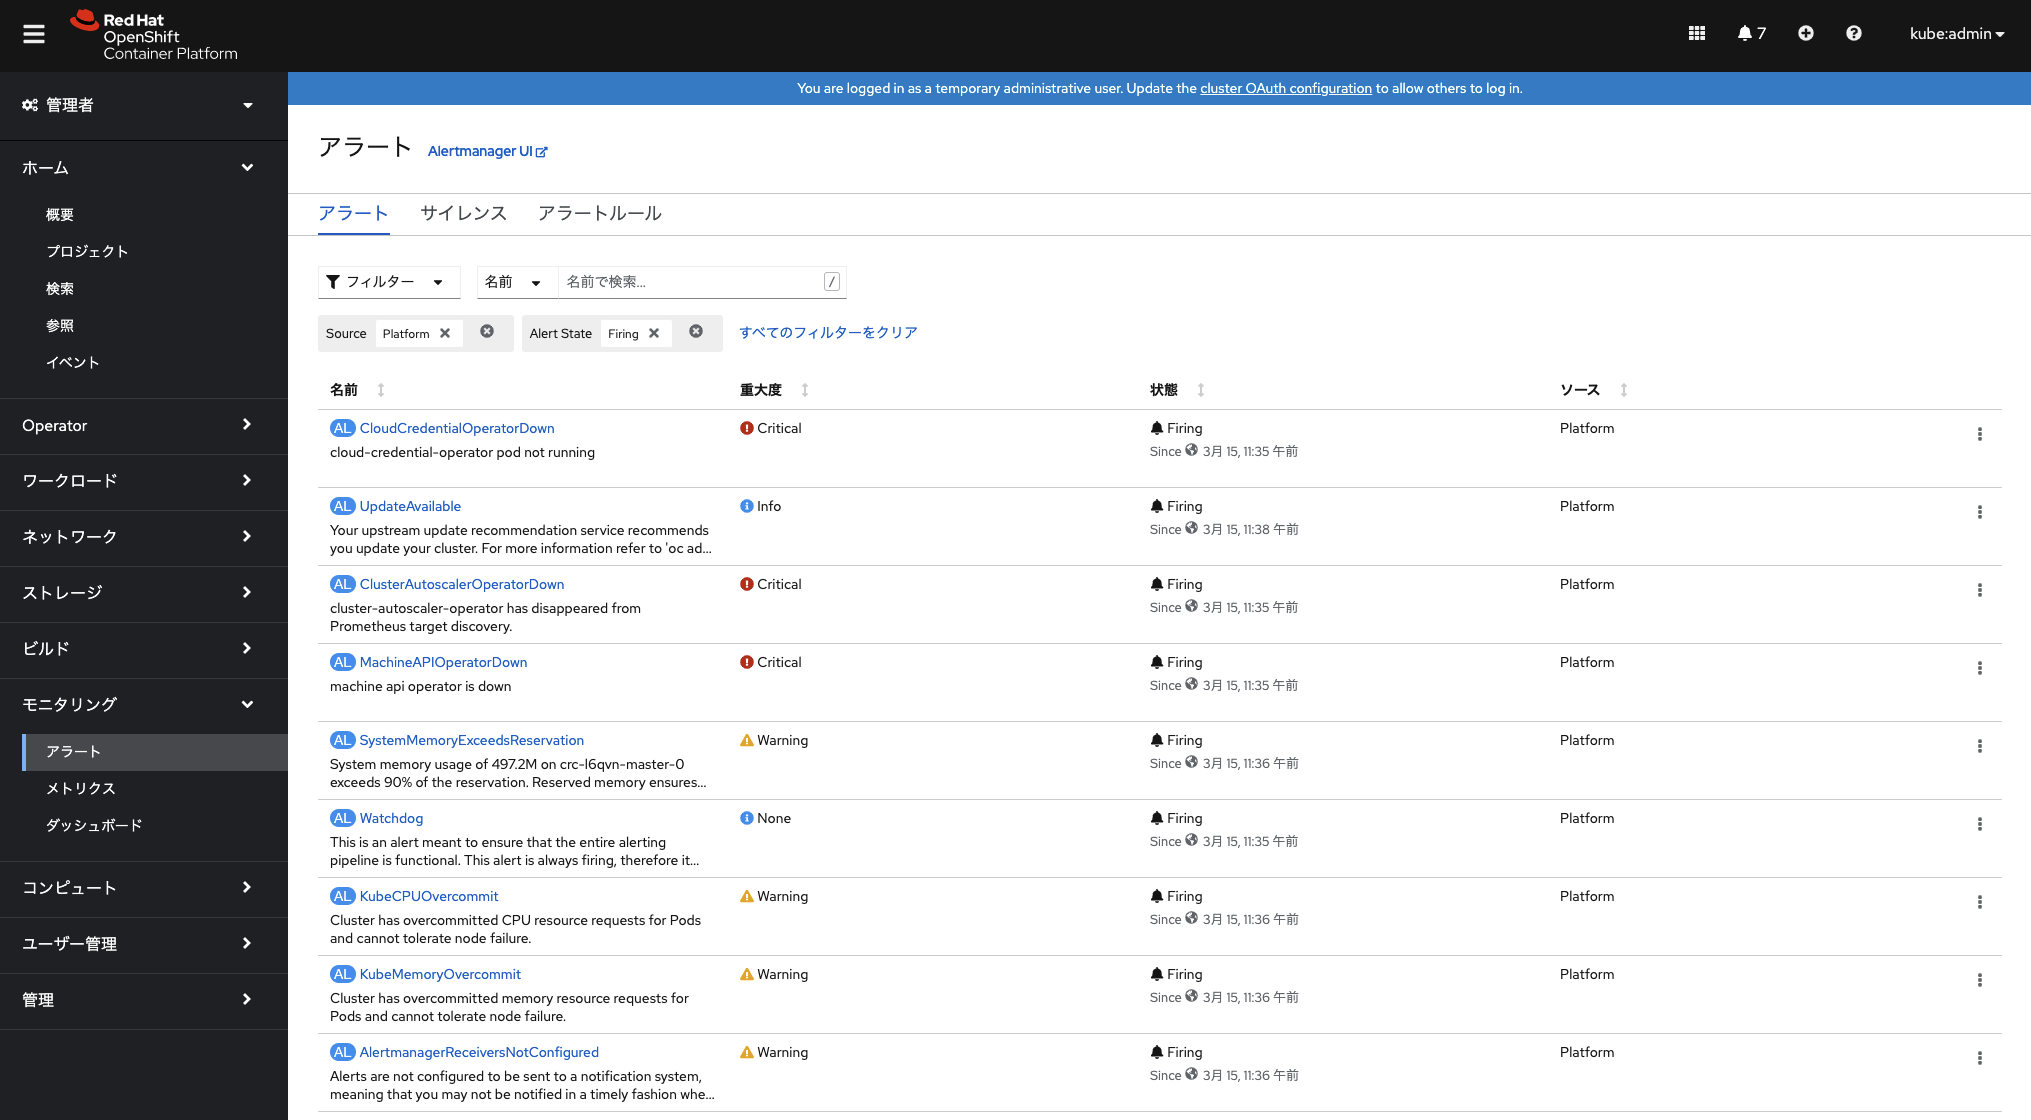
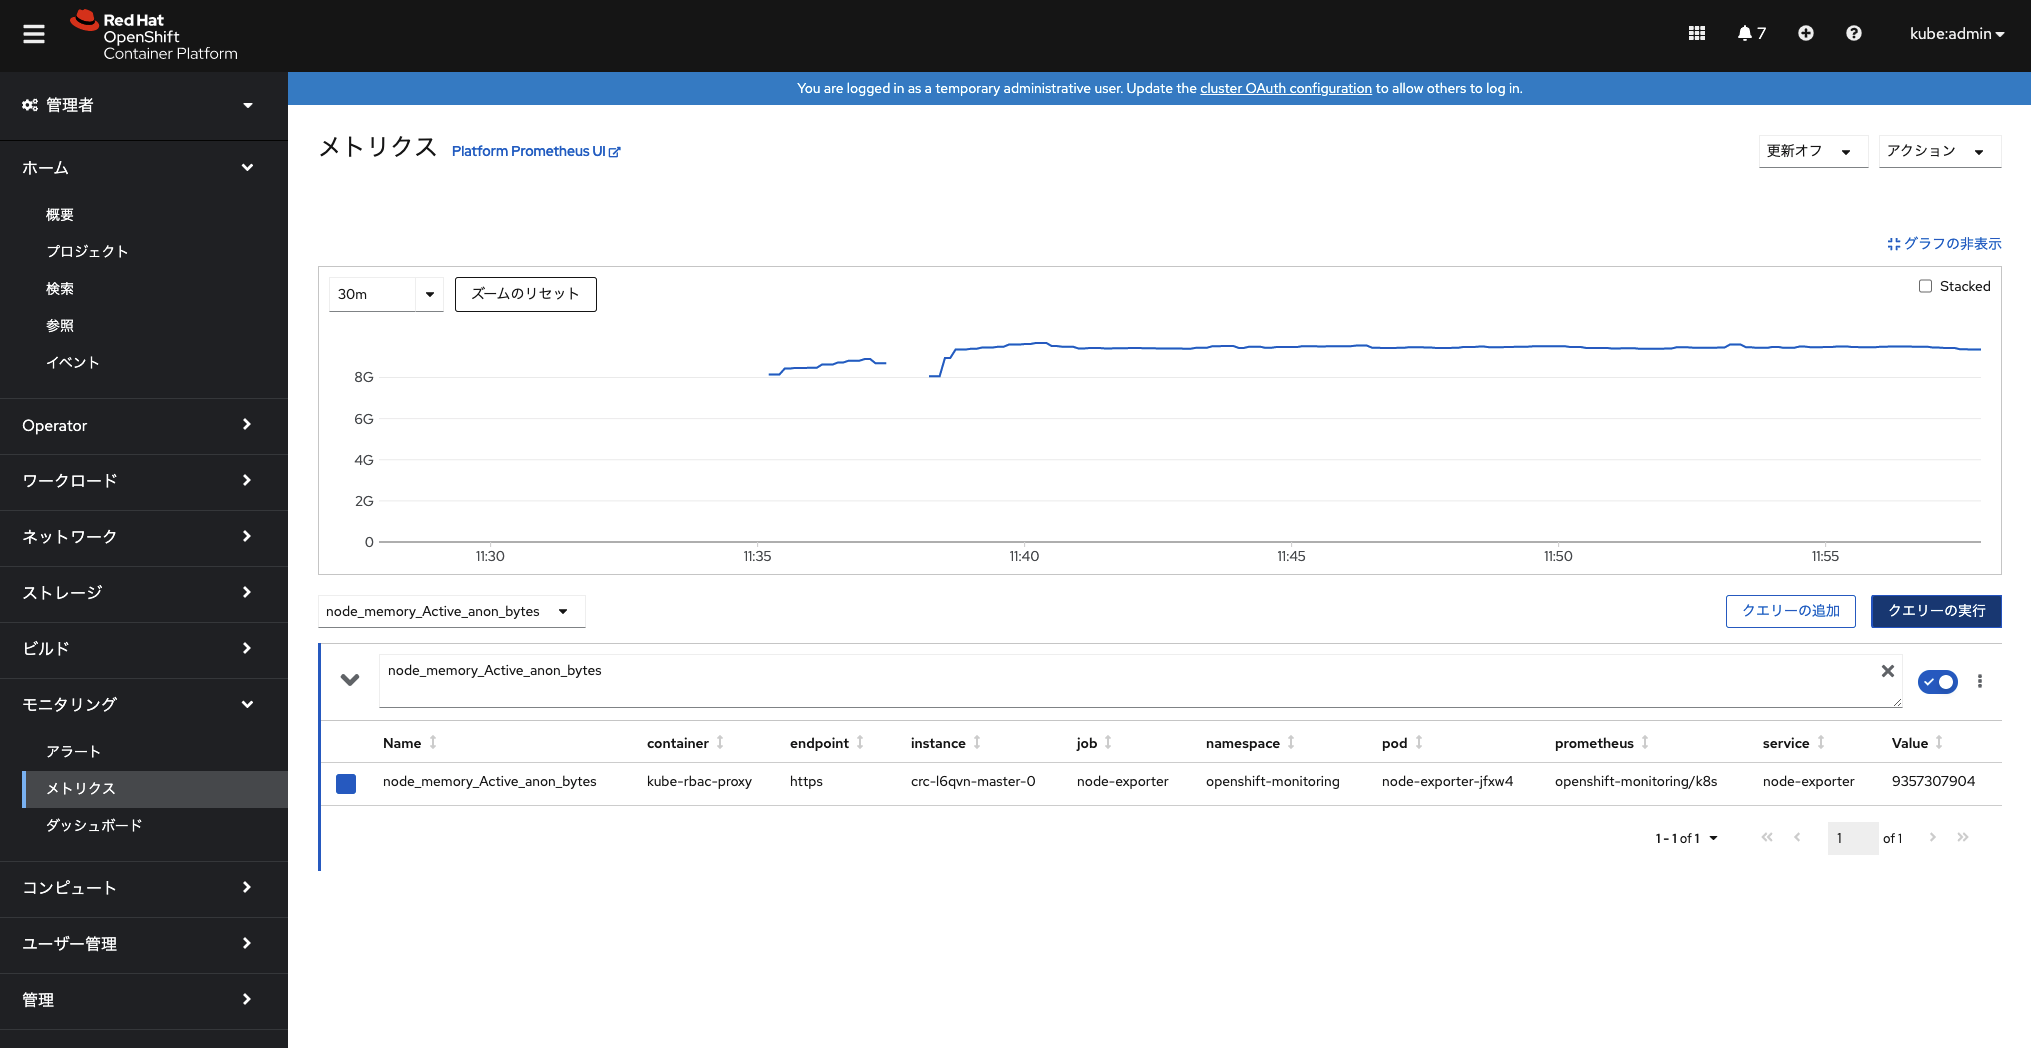
左メニューの「モニタリング」セクションの機能も利用できるようになっています。
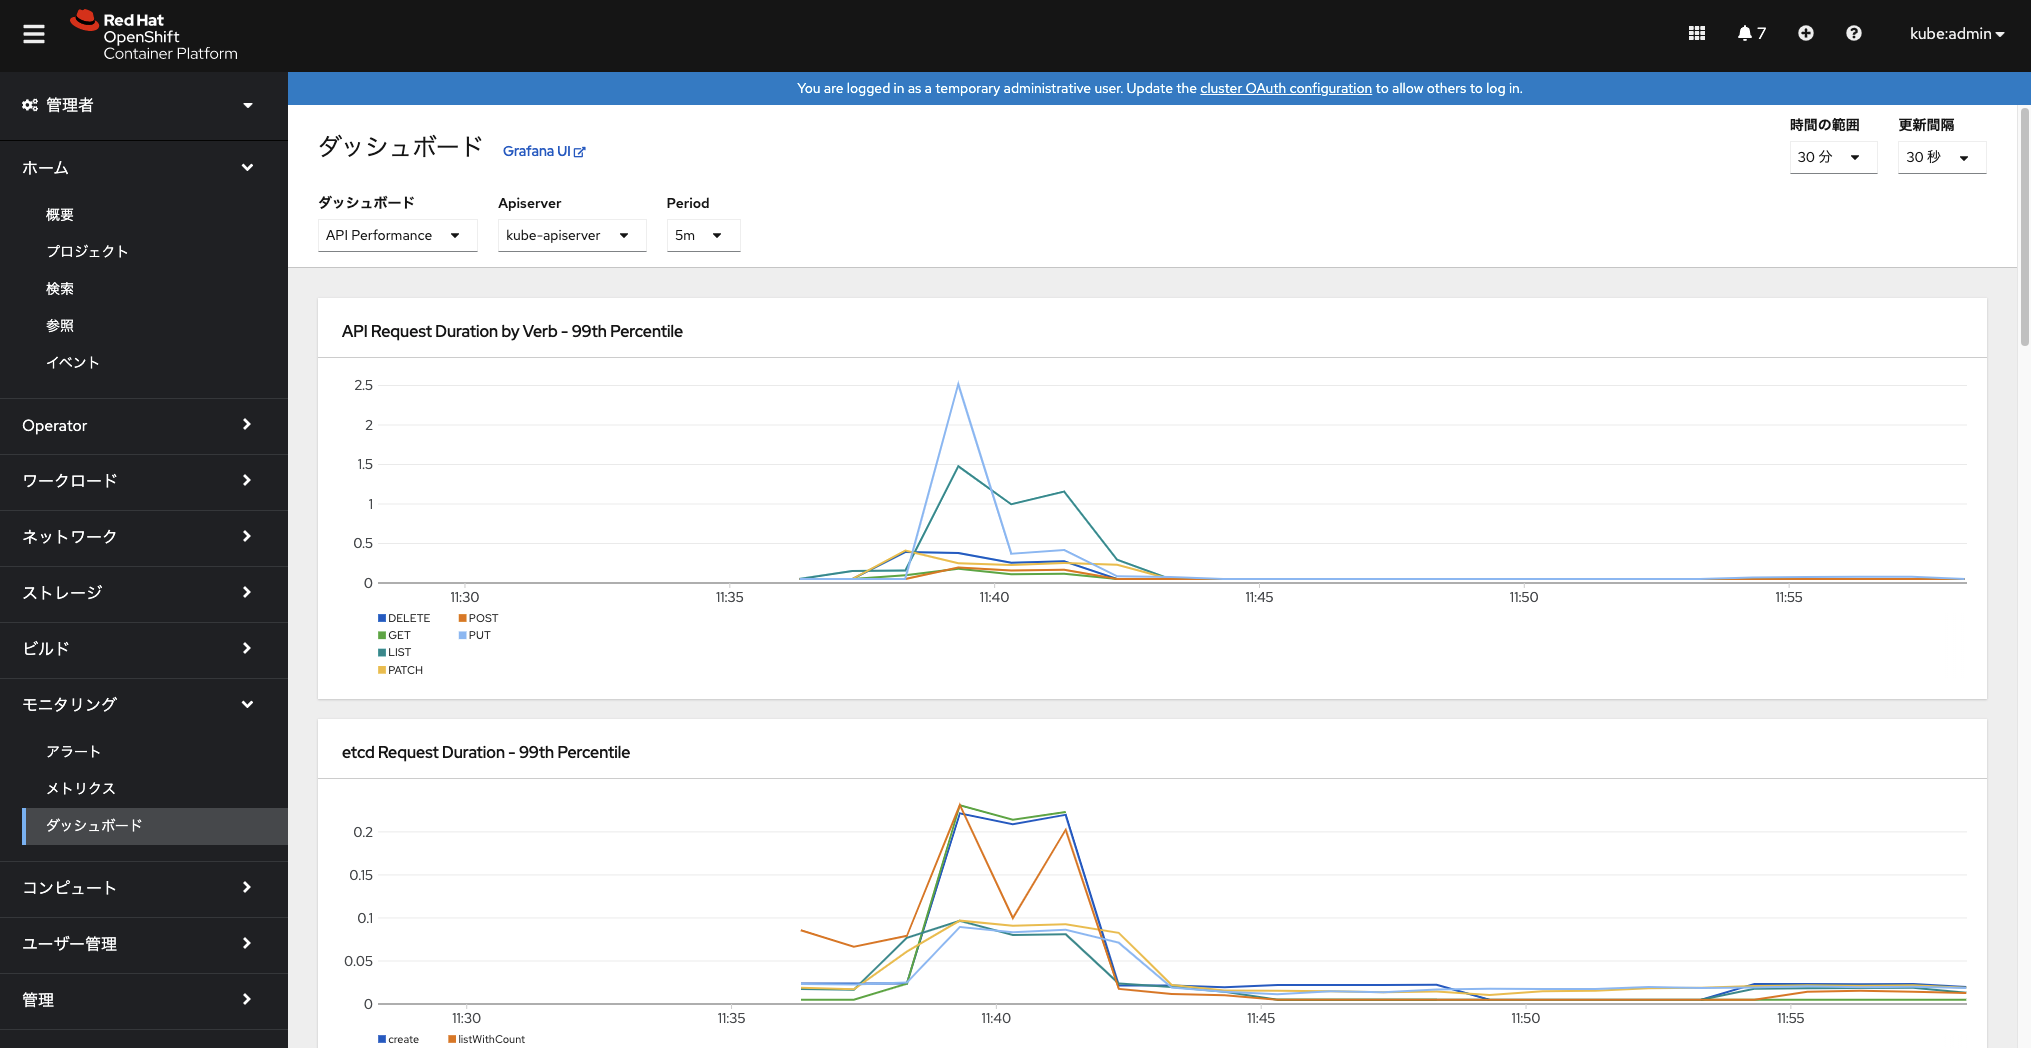
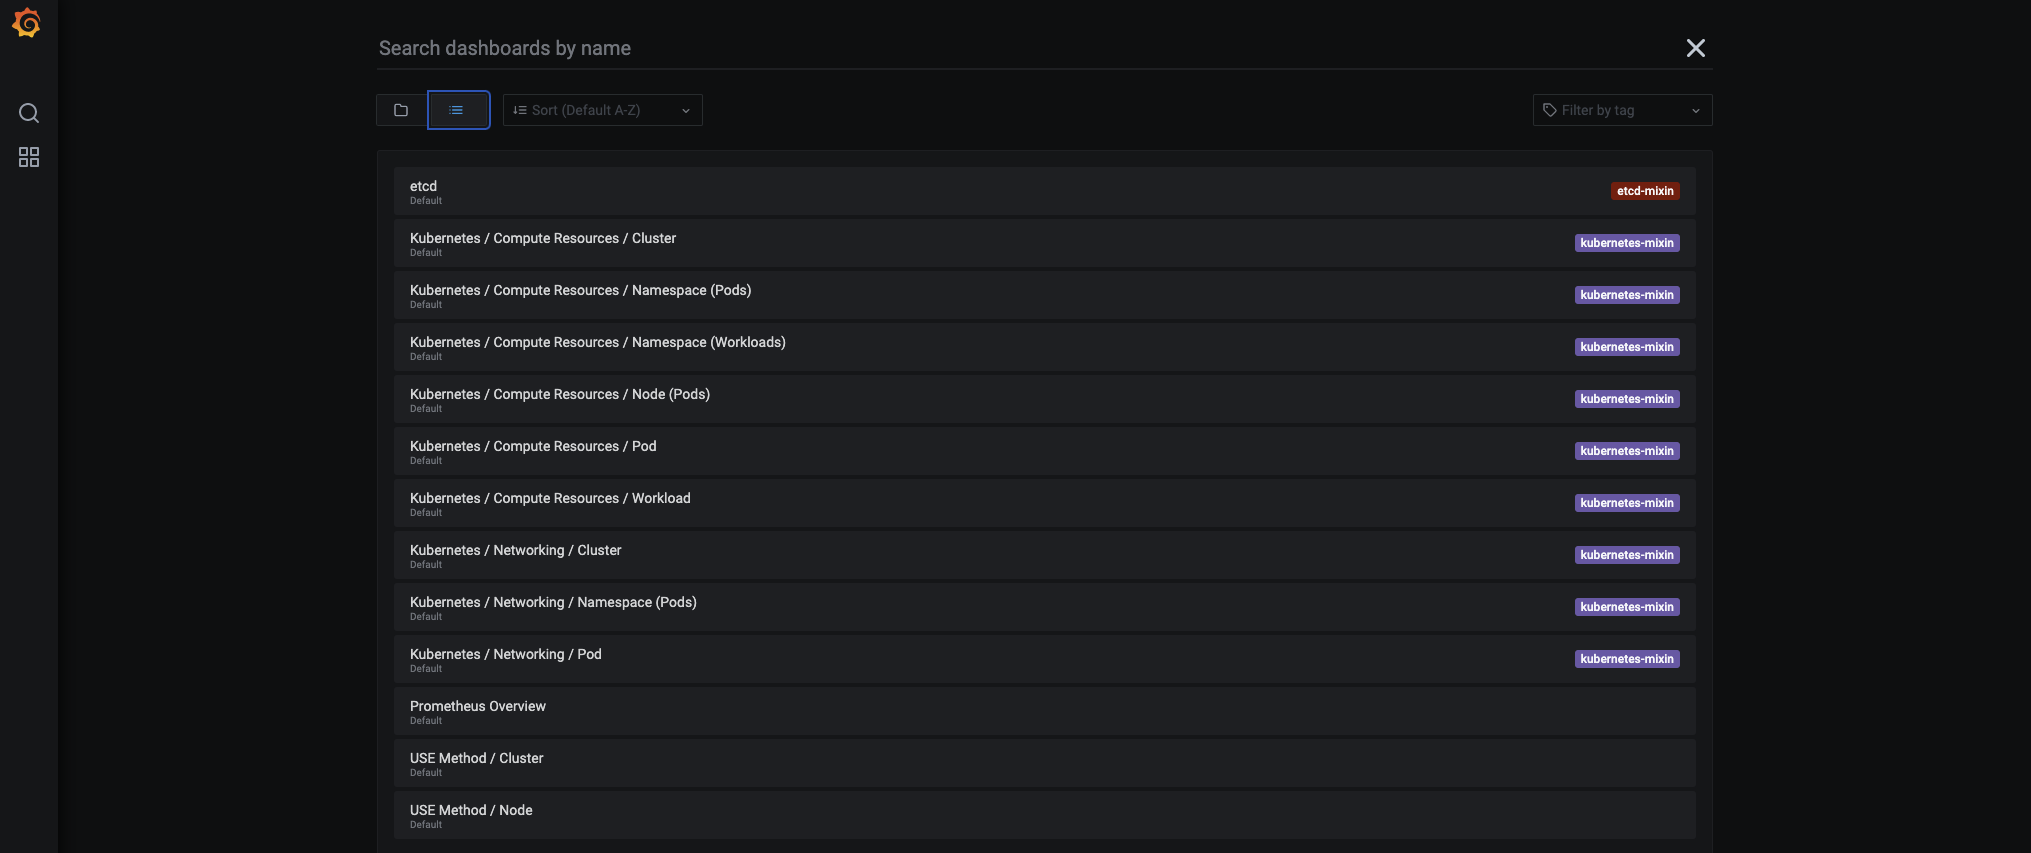
grafanaはsearch(虫眼鏡アイコン)の「一覧」っぽいアイコンの選択でインストールされているダッシュボードの一覧表示ができます。
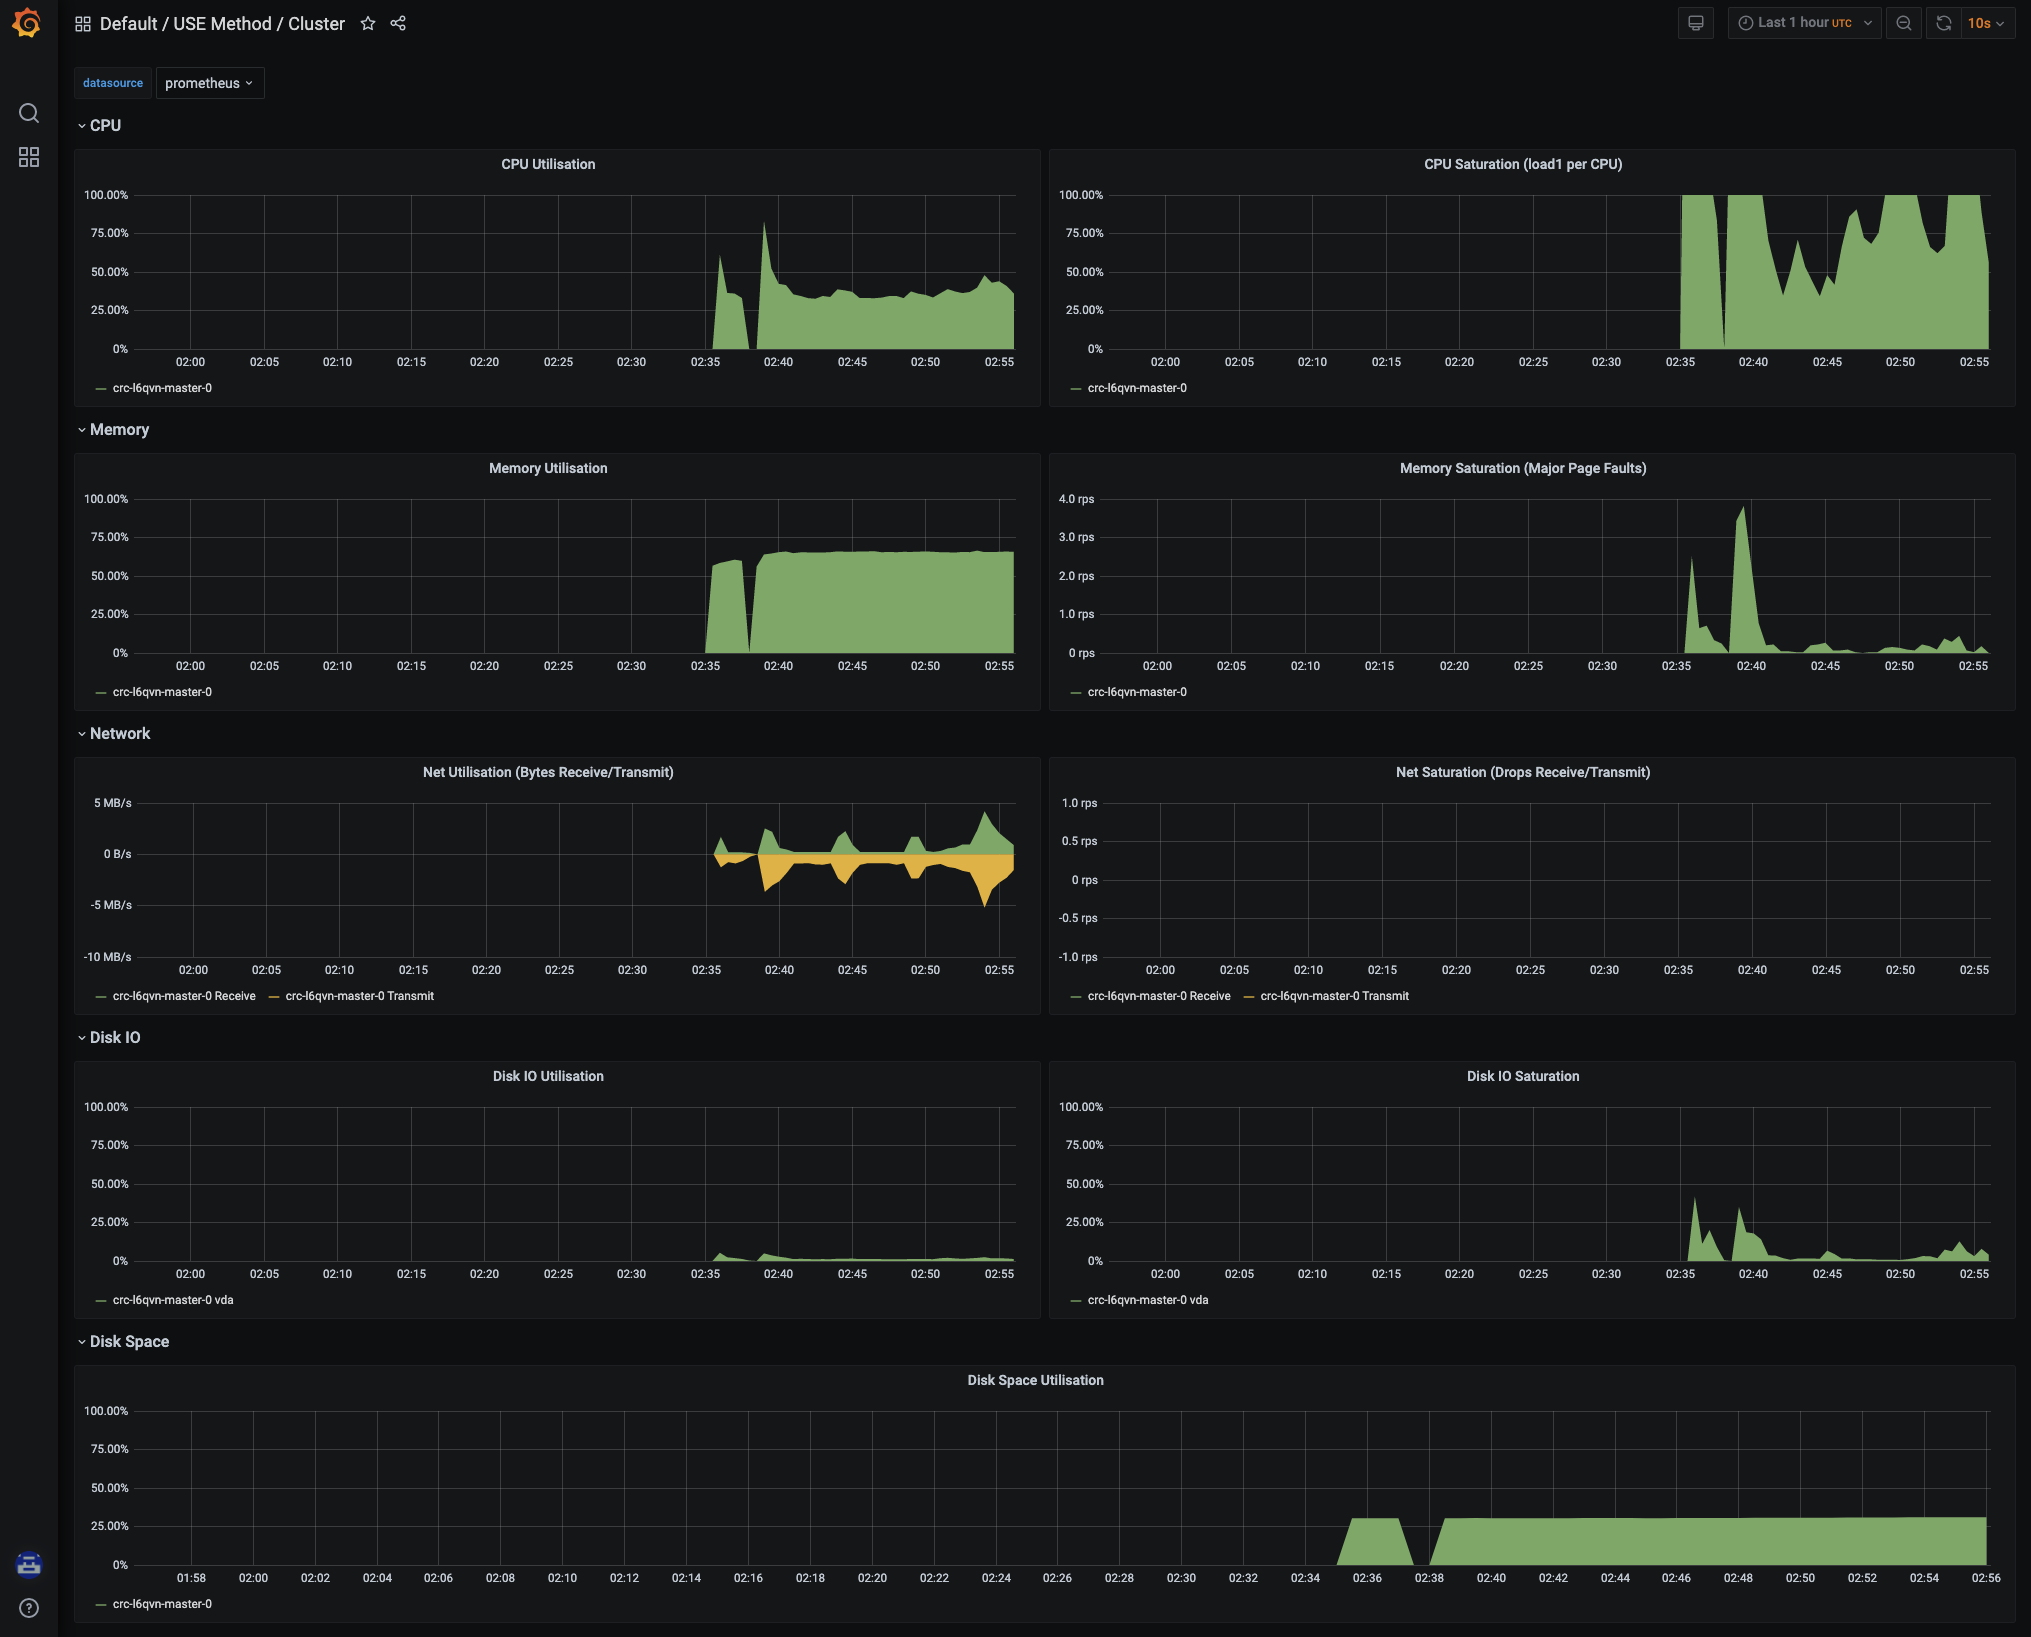
「Default/USE Method/Cluster」を選ぶと以下のように綺麗なグラフが表示されます。
永続ストレージの割り当て
以前のバージョンではデフォルトでローカルPVへのダイナミックプロビジョナーがあったと思うのですが、いつの間にか無くなっており、色々調べたところ以下のwikiで解決できました。
https://github.com/code-ready/crc/wiki/Dynamic-volume-provisioning
ここの「local-path-provisioner」の部分をデプロイします。
そのままコピペで大丈夫でした。
% oc new-project local-path-storage
% oc create serviceaccount local-path-provisioner-service-account -n local-path-storage
% oc adm policy add-scc-to-user hostaccess -z local-path-provisioner-service-account -n local-path-storage
% cat <<EOF | oc apply -f -
apiVersion: rbac.authorization.k8s.io/v1
kind: ClusterRole
metadata:
  name: local-path-provisioner-role
rules:
- apiGroups: [""]
  resources: ["nodes", "persistentvolumeclaims"]
  verbs: ["get", "list", "watch"]
- apiGroups: [""]
  resources: ["endpoints", "persistentvolumes", "pods"]
  verbs: ["*"]
- apiGroups: [""]
  resources: ["events"]
  verbs: ["create", "patch"]
- apiGroups: ["storage.k8s.io"]
  resources: ["storageclasses"]
  verbs: ["get", "list", "watch"]
---
apiVersion: rbac.authorization.k8s.io/v1
kind: ClusterRoleBinding
metadata:
  name: local-path-provisioner-bind
roleRef:
  apiGroup: rbac.authorization.k8s.io
  kind: ClusterRole
  name: local-path-provisioner-role
subjects:
- kind: ServiceAccount
  name: local-path-provisioner-service-account
  namespace: local-path-storage
---
apiVersion: apps/v1
kind: Deployment
metadata:
  name: local-path-provisioner
  namespace: local-path-storage
spec:
  replicas: 1
  selector:
    matchLabels:
      app: local-path-provisioner
  template:
    metadata:
      labels:
        app: local-path-provisioner
    spec:
      serviceAccountName: local-path-provisioner-service-account
      containers:
      - name: local-path-provisioner
        image: rancher/local-path-provisioner:v0.0.12
        imagePullPolicy: IfNotPresent
        command:
        - local-path-provisioner
        - --debug
        - start
        - --config
        - /etc/config/config.json
        volumeMounts:
        - name: config-volume
          mountPath: /etc/config/
        env:
        - name: POD_NAMESPACE
          valueFrom:
            fieldRef:
              fieldPath: metadata.namespace
      volumes:
        - name: config-volume
          configMap:
            name: local-path-config
---
apiVersion: storage.k8s.io/v1
kind: StorageClass
metadata:
  name: local-path
provisioner: rancher.io/local-path
volumeBindingMode: WaitForFirstConsumer
reclaimPolicy: Delete
---
kind: ConfigMap
apiVersion: v1
metadata:
  name: local-path-config
  namespace: local-path-storage
data:
  config.json: |-
        {
                "nodePathMap":[
                {
                        "node":"DEFAULT_PATH_FOR_NON_LISTED_NODES",
                        "paths":["/mnt/pv-data"]
                }
                ]
        }
EOF
そうすると、「local-path」というStorageClassが使えるようになります。
あとはクラスタモニタリングのconfigmapでストレージ設定をします。
最初はconfigmap自体存在しないので作成します。名前は「cluster-monitoring-config」です。
% oc create configmap cluster-monitoring-config -n openshift-monitoring
configmap/cluster-monitoring-config created
作成できたら、editで編集します。
% oc edit configmap cluster-monitoring-config -n openshift-monitoring
viでyamlの編集モードになるので、「data:」行含む以降の設定を追記します。
prometheusのデータ保持期間は「retention: 24h」で設定しています。ストレージ容量合わせて、お好みで変えてください。
# Please edit the object below. Lines beginning with a '#' will be ignored,
# and an empty file will abort the edit. If an error occurs while saving this file will be
# reopened with the relevant failures.
#
apiVersion: v1
kind: ConfigMap
metadata:
  creationTimestamp: "2021-03-15T06:31:08Z"
  name: cluster-monitoring-config
  namespace: openshift-monitoring
  resourceVersion: "53959"
  selfLink: /api/v1/namespaces/openshift-monitoring/configmaps/cluster-monitoring-config
  uid: 755425ba-c5b7-48bd-a29f-d375cd29a694
data:
  config.yaml: |
    prometheusK8s:
      volumeClaimTemplate:
        spec:
          storageClassName: local-path
          resources:
            requests:
              storage: 40Gi
      retention: 24h
    alertmanagerMain:
      volumeClaimTemplate:
        spec:
          storageClassName: local-path
          resources:
            requests:
              storage: 40Gi
「:wq」で保存すると、編集完了のメッセージが出力されます。
configmap/cluster-monitoring-config edited
configmapを設定・編集すると内容に応じてprometheusとalertmanagerが再起動します。
% oc get pod -n openshift-monitoring -w
NAME                                         READY   STATUS    RESTARTS   AGE
alertmanager-main-0                           5/5     Running   0          31m
alertmanager-main-1                           5/5     Running   0          31m
alertmanager-main-2                           5/5     Running   0          31m
cluster-monitoring-operator-686555c948-g7frt  2/2     Running   4          32m
grafana-6f4d96d7fd-6bz9x                      2/2     Running   0          32m
kube-state-metrics-749954d685-2rj98           3/3     Running   0          32m
node-exporter-qf9kt                           2/2     Running   0          32m
openshift-state-metrics-587d97bb47-tv9qm      3/3     Running   0          32m
prometheus-adapter-78f4dff485-b97lk           1/1     Running   0          30m
prometheus-adapter-78f4dff485-ctjr2           1/1     Running   0          30m
prometheus-k8s-0                              7/7     Running   1          31m
prometheus-k8s-1                              7/7     Running   1          31m
prometheus-operator-658ccb589c-zkhjs          2/2     Running   1          32m
telemeter-client-5c9f466b48-2qfw5             3/3     Running   0          32m
thanos-querier-74f6ff8cd6-bmkzg               5/5     Running   0          32m
thanos-querier-74f6ff8cd6-djm75               5/5     Running   0          32m
alertmanager-main-0                           5/5     Terminating   0          30m  ←alertmanagerの停止処理開始
alertmanager-main-1                           5/5     Terminating   0          30m
            :
prometheus-k8s-0                              7/7     Terminating         1          30m ←prometheusの停止処理開始
prometheus-k8s-1                              7/7     Terminating         1          30m
            :
alertmanager-main-0                           5/5     Running             0          8s ←alertmanagerの起動完了
alertmanager-main-1                           5/5     Running             0          7s
alertmanager-main-2                           5/5     Running             0          7s
            :
prometheus-k8s-1                              7/7     Running             1          9s ←prometheusの起動完了
prometheus-k8s-0                              7/7     Running             1          12s
pvc,pvがちゃんと割り当てられているかを確認します。
% oc get pvc -n openshift-monitoring
NAME                                       STATUS   VOLUME                                     CAPACITY   ACCESS MODES   STORAGECLASS   AGE
alertmanager-main-db-alertmanager-main-0   Bound    pvc-96694b93-ec7a-4c10-b80c-6880f3104d70   40Gi       RWO            local-path     17m
alertmanager-main-db-alertmanager-main-1   Bound    pvc-130939d0-5a1d-4eac-8a9d-c0b3dfb5a1b1   40Gi       RWO            local-path     17m
alertmanager-main-db-alertmanager-main-2   Bound    pvc-c27a7084-ef29-4429-8aee-1f3bd8d843f8   40Gi       RWO            local-path     17m
prometheus-k8s-db-prometheus-k8s-0         Bound    pvc-250c335f-ec8a-43e1-8f21-af5ac8635016   40Gi       RWO            local-path     3m30s
prometheus-k8s-db-prometheus-k8s-1         Bound    pvc-df236008-9d14-4acc-b1f4-7fd9ab9feeee   40Gi       RWO            local-path     3m29s
% oc get pv | grep openshift-monitoring
pvc-130939d0-5a1d-4eac-8a9d-c0b3dfb5a1b1   40Gi       RWO            Delete           Bound       openshift-monitoring/alertmanager-main-db-alertmanager-main-1   local-path              17m
pvc-250c335f-ec8a-43e1-8f21-af5ac8635016   40Gi       RWO            Delete           Bound       openshift-monitoring/prometheus-k8s-db-prometheus-k8s-0         local-path              3m57s
pvc-96694b93-ec7a-4c10-b80c-6880f3104d70   40Gi       RWO            Delete           Bound       openshift-monitoring/alertmanager-main-db-alertmanager-main-0   local-path              17m
pvc-c27a7084-ef29-4429-8aee-1f3bd8d843f8   40Gi       RWO            Delete           Bound       openshift-monitoring/alertmanager-main-db-alertmanager-main-2   local-path              17m
pvc-df236008-9d14-4acc-b1f4-7fd9ab9feeee   40Gi       RWO            Delete           Bound       openshift-monitoring/prometheus-k8s-db-prometheus-k8s-1         local-path              3m57s
おわりに
参考にしたドキュメントは以下です。
■Red Hat CodeReady Containers 1.23 の製品ドキュメント
https://access.redhat.com/documentation/en-us/red_hat_codeready_containers/1.23/html-single/getting_started_guide/index
■code-ready.github.ioの「Getting Started Guide」
https://code-ready.github.io/crc/
■Red Hat OpenShift 4.7 の製品ドキュメント クラスタモニタリングの永続ストレージ設定
https://access.redhat.com/documentation/ja-jp/openshift_container_platform/4.7/html-single/monitoring/index#configuring-persistent-storage
■CRCのWiki 「Dynamic volume provisioning」が今回参考にした記事
https://github.com/code-ready/crc/wiki