はじめに
Pythonはコードの可読性や開発効率の高さのほか、様々な分野に対応した豊富なライブラリが存在することから、初心者からプロフェッショナルまで幅広い層に支持されています。しかし一方で、実行速度の面では多言語に劣ることが多々あるということも事実です。そんなPythonのパフォーマンスを効果的に改善するためには、まず実行速度を遅くする要因となる部分(ボトルネック)を特定することが不可欠です。ボトルネックを特定し、改善することで、プログラムの実行時間を大幅に短縮することができます。本記事では、そのボトルネック特定に役立つプロファイリングツールを紹介します。
プロファイリングツール
1. cProfile
cProfileは、関数ごとの実行時間や呼び出し回数などを計測します。スクリプト全体や、特定の関数に対してプロファイリングを行うことができるため、パフォーマンスの全体把握をするのに役立ちます。また、Pythonの標準ライブラリに含まれているため、追加のインストールが必要ありません。
cProfileの使い方
import time

def time_sleep1():
    for i in range(0, 6, 1):
        time.sleep(1)
    print("time_sleep(1)")

def time_sleep2():
    for i in range(0, 6, 2):
        time.sleep(2)
    print("time_sleep(2)")

def time_sleep3():
    for i in range(0, 6, 3):
        time.sleep(3)
    print("time_sleep(3)")

def main():
    time_sleep1()
    time_sleep2()
    time_sleep3()

if __name__ == "__main__":
    main()
スクリプト全体に対してプロファイルする
コマンドラインから-mオプションを用いてcProfileモジュールを指定し、以下のように実行します。
python -m cProfile example.py
また、-oオプションを用いることで、結果をファイルに出力するができます。
python -m cProfile -o example.prof example.py
出力されたexample.profは可視化ツールを用いて解析することができます。(後述)
特定の関数に対してプロファイルする
以下のように、プロファイリングしたい部分をcProfile.Profile()で囲み、実行します。
import cProfile

profiler = cProfile.Profile()
profiler.enable()       # プロファイリング開始
time_sleep1()           # 対象の関数
profiler.disable()      # プロファイリング終了
profiler.print_stats()  # 結果の表示
結果の見方
         21 function calls in 18.076 seconds

   Ordered by: standard name

   ncalls  tottime  percall  cumtime  percall filename:lineno(function)
        1    0.000    0.000   18.076   18.076 example.py:1(<module>)
        1    0.000    0.000    6.023    6.023 example.py:13(time_sleep3)
        1    0.000    0.000   18.076   18.076 example.py:18(main)
        1    0.000    0.000    6.026    6.026 example.py:3(time_sleep1)
        1    0.000    0.000    6.027    6.027 example.py:8(time_sleep2)
        1    0.000    0.000   18.076   18.076 {built-in method builtins.exec}
        3    0.001    0.000    0.001    0.000 {built-in method builtins.print}
       11   18.075    1.643   18.075    1.643 {built-in method time.sleep}
        1    0.000    0.000    0.000    0.000 {method 'disable' of '_lsprof.Profiler' objects}
ncalls:関数の呼び出し回数
tottime:実行時間(他の関数呼び出しは含まない)
percall:平均の実行時間(tottime/ncalls)
cumtime:他の関数の呼び出しを含めた累積実行時間
filename:関数の定義場所
ncallsが多い関数は、プログラムがその関数を頻繁に呼び出していることを表していて、ボトルネックの候補になります。また、tottimeやcumtimeが長い関数は、実行時間が長くなっている可能性があるため、こちらも注意が必要です。
2. Pyinstrument
Pyinstrumentは、関数の実行時間を計測します。cProfileと同様に、スクリプト全体や、特定の関数に対してプロファイリングを行うことができます。結果は、関数の呼び出し関係がツリー構造で表示されるため、どの部分に時間がかかっているのか直感的に把握しやすいのが特徴です。ただ、プロファイリング対象の実行時間が短い場合は、サンプルを取得できず、結果が出力されない場合もあります。また、Pythonの標準ライブラリではないので、インストールが必要です。
Pyinstrumentの使い方
スクリプト全体に対してプロファイルする
コマンドラインから以下のように実行します。
pyinstrument example.py
また、-oオプションを用いることで、結果をファイルに出力することができます。
pyinstrument -o example.txt example.py
特定の関数に対してプロファイルする
以下のように、プロファイリングしたい部分をpyinstrument.Profiler()で囲み、実行します。
from pyinstrument import Profiler

profiler = Profiler()
profiler.start()   # プロファイリング開始
time_sleep1()      # 対象の関数
profiler.stop()    # プロファイリング終了
print(profiler.output_text(unicode=True)) # 結果の表示
結果の見方
  _     ._   __/__   _ _  _  _ _/_   Recorded: 19:16:32  Samples:  11
 /_//_/// /_\ / //_// / //_'/ //     Duration: 18.090    CPU time: 0.000
/   _/                      v4.6.2

Program: C:\..\ example.py

18.077 <module>  example.py:1
└─ 18.077 main  example.py:18
   ├─ 6.027 time_sleep3  example.py:13
   │  └─ 6.027 sleep  <built-in>
   ├─ 6.025 time_sleep2  example.py:8
   │  └─ 6.025 sleep  <built-in>
   └─ 6.024 time_sleep1  example.py:3
      └─ 6.024 sleep  <built-in>

To view this report with different options, run:
    pyinstrument --load-prev 2025-02-18T19-16-32 [options]
例)18.077 main example.py:18
18.077(時間):その関数が実行されるのにかかった総時間(sec)
main(関数名):どの部分のコードが実行されているか
main example.py:18:関数の定義場所と行番号
実行時間が長い関数は、ボトルネックのある可能性が高いため、特に注意が必要です。
3. line_profiler
line_profilerは、関数内の各行の実行時間を計測します。関数単位の実行時間を計測するcProfileやPyinstrumentよりも細かくプロファイリングできるため、ボトルネックとなる箇所をピンポイントで特定できます。ただ、Pythonの標準ライブラリではないので、インストールが必要です。
line_profilerの使い方
まず、以下のようにプロファイリングしたい関数に@profileデコレータを追加します。同時に複数個追加しても構いません。
import time

@profile
def time_sleep1():
    for i in range(0, 6, 1):
        time.sleep(1)
    print("time_sleep(1)")

@profile
def time_sleep2():
    for i in range(0, 6, 2):
        time.sleep(2)
    print("time_sleep(2)")

@profile
def time_sleep3():
    for i in range(0, 6, 3):
        time.sleep(3)
    print("time_sleep(3)")

def main():
    time_sleep1()
    time_sleep2()
    time_sleep3()

if __name__ == "__main__":
    main()
コマンドラインから、以下のようにスクリプトを実行します。
kernprof -l -v example.py
プロファイルの結果と同時に"example.py.lprof"というバイナリファイルが生成されます。以下のコマンドを実行することで、いつでも結果を表示することができます。
python -m line_profiler example.py.lprof
結果の見方
Wrote profile results to example.py.lprof
Timer unit: 1e-06 s

Total time: 6.01165 s
File: example.py
Function: time_sleep1 at line 3

Line #      Hits         Time  Per Hit   % Time  Line Contents
==============================================================
     3                                           @profile
     4                                           def time_sleep1():
     5         7         19.0      2.7      0.0      for i in range(0, 6, 1):
     6         6    6011383.4    1e+06    100.0          time.sleep(1)
     7         1        247.6    247.6      0.0      print("time_sleep(1)")
Line:行番号
Hits:その行が実行された回数
Time:その行の総実行時間(ms)
Per Hit:平均の実行時間(Time/Hits)
% Time:その行の実行時間が関数全体に対して占める割合
Line Contents:その行のコード
% Timeが高い行は、その行が全体の実行時間に大きな影響を与えていることを表していて、ボトルネックの候補になります。また、Per Hitが大きい行は、実行効率が悪くなっている可能性があるため、こちらも注意が必要です。
可視化ツール(おまけ)
snakeviz
snakevizはプロファイリング結果を視覚的に表示するためのツールで、cProfileなどで得られたプロファイリング結果をHTMLフォーマットに変換し、ブラウザで表示することができます。Pythonの標準ライブラリではないので、インストールが必要です。
snakevizの使い方
プロファイリング結果を出力した後、コマンドラインから、以下のように実行します。
snakeviz example.prof
出力例
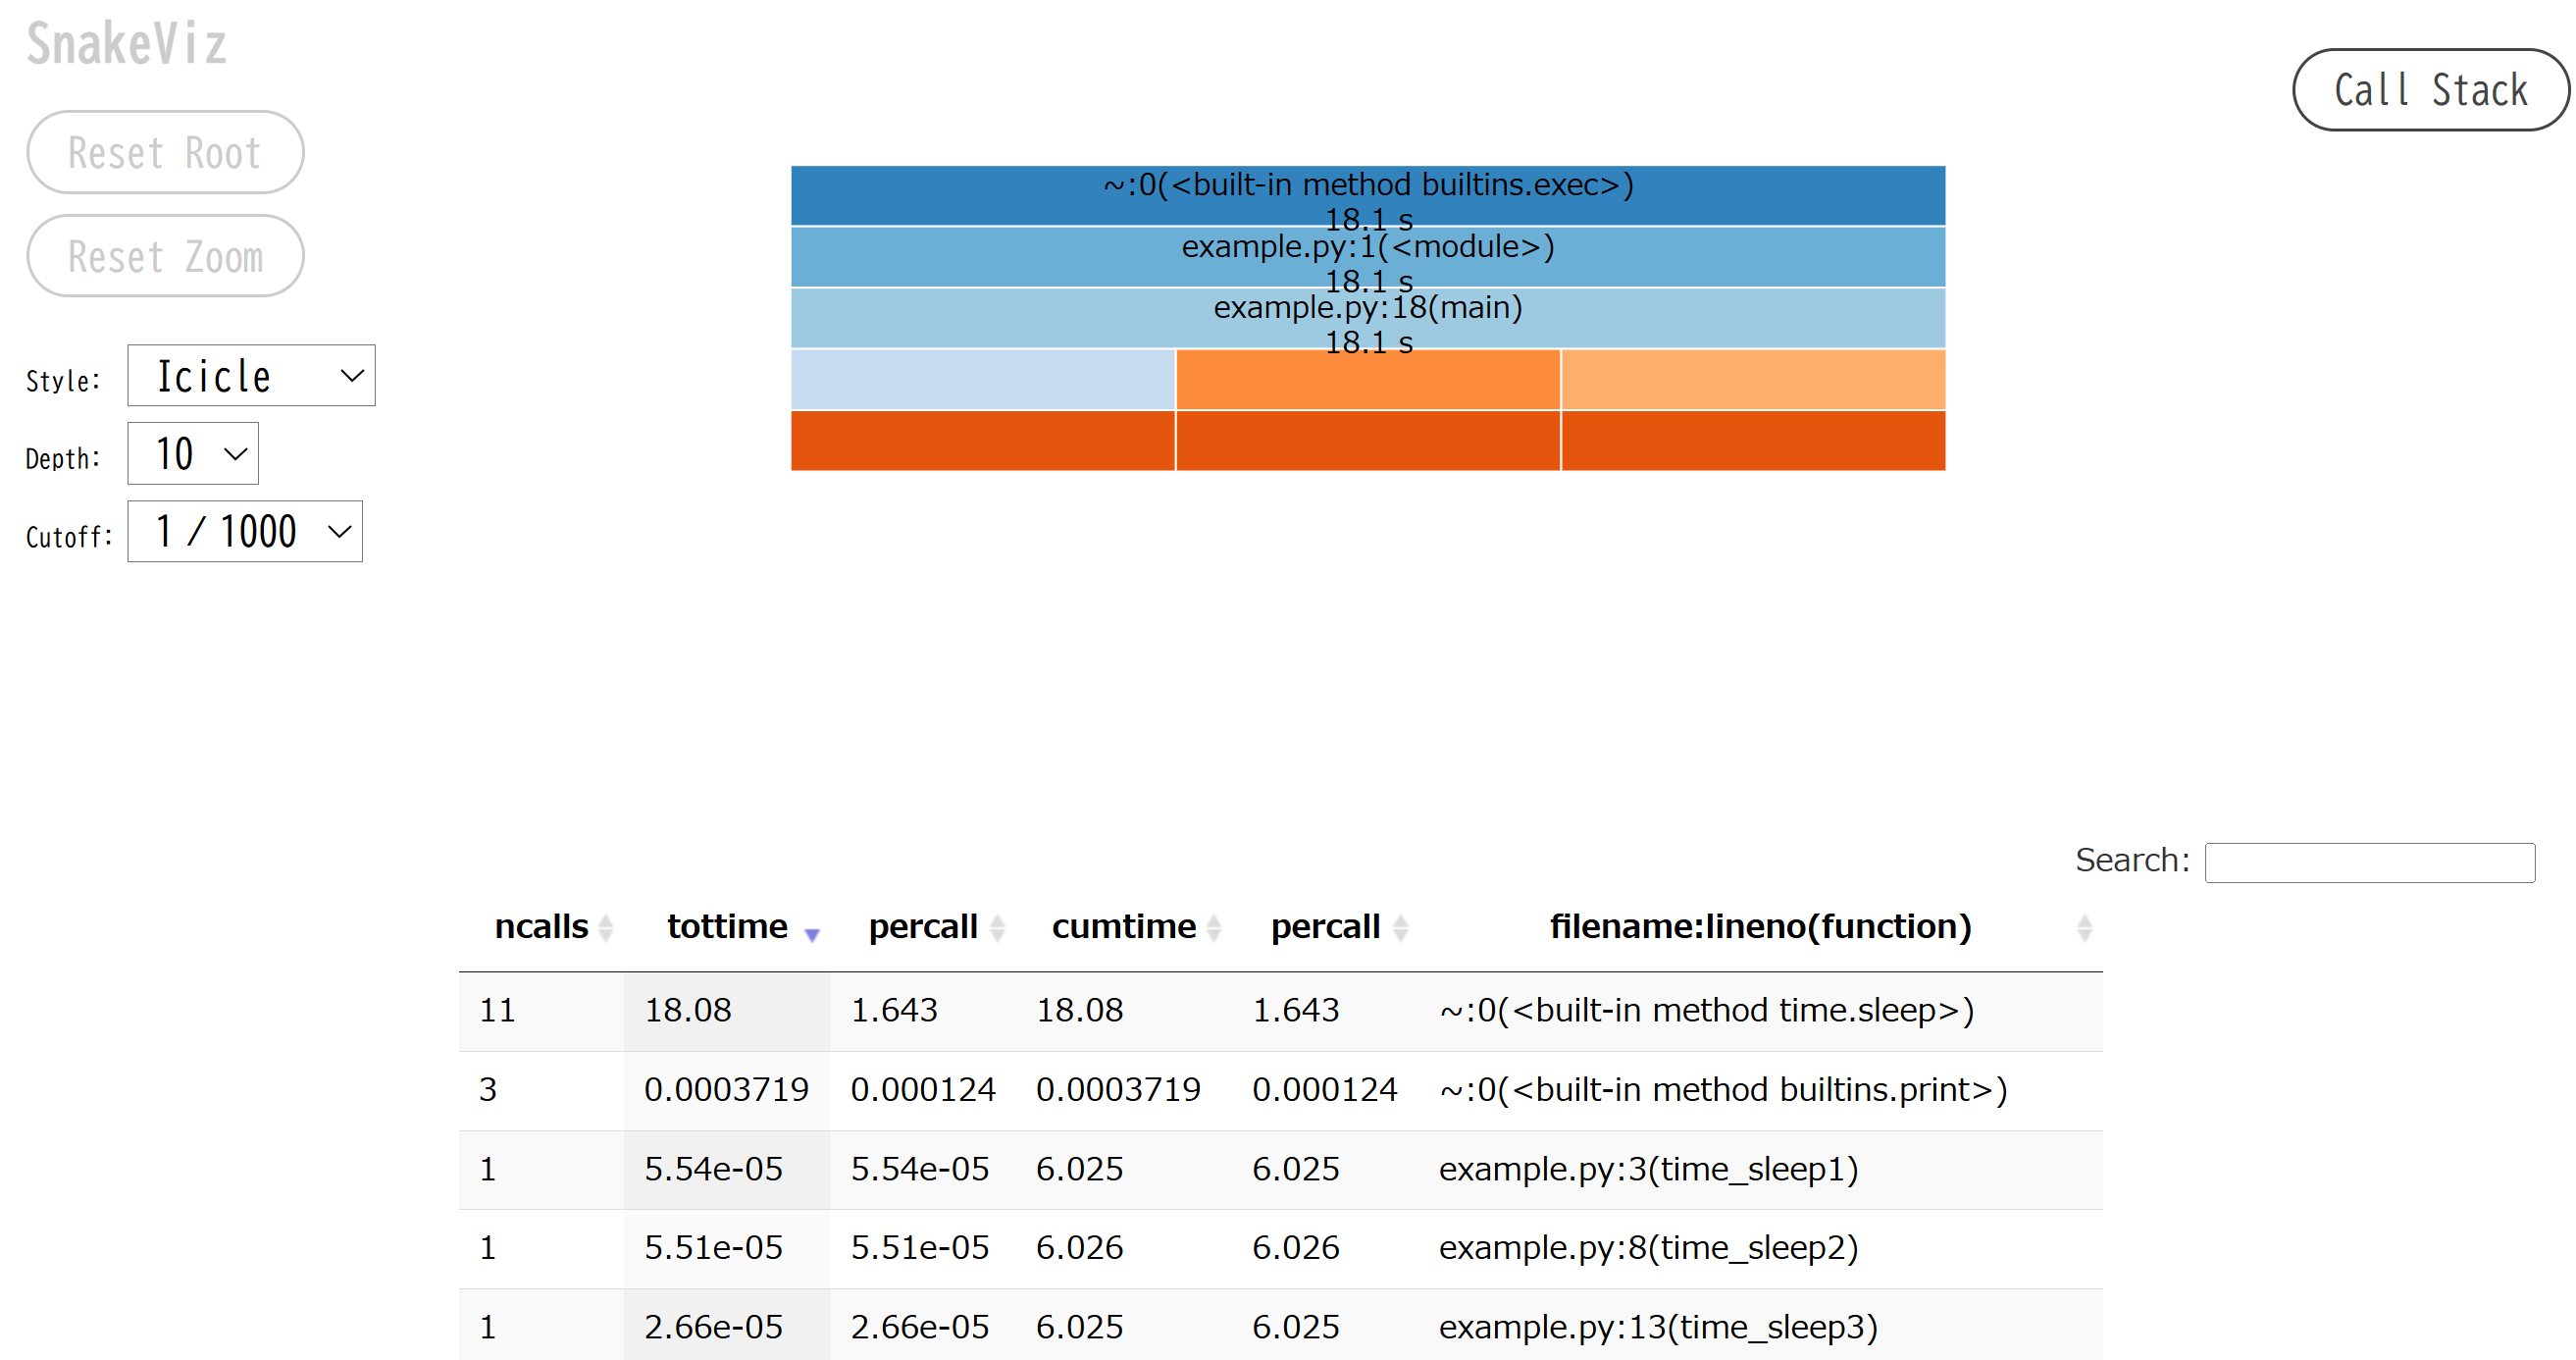
上段では、処理の呼び出し階層が表示され、どの関数がどれだけの時間を消費しているのかを確認できます。また下段では、関数の呼び出し回数や実行時間などが表示されます。▲▼をクリックすると対象項目の昇降順を切り替えられ,検索機能も付いています。
まとめ
本記事では、Pythonスクリプトの高速化をする前段階で使用できる、ボトルネック特定のためのプロファイリングツールを紹介しました。本記事がスクリプト解析のお役に立てば幸いです。