Octave で図を描く基本
1. plot()
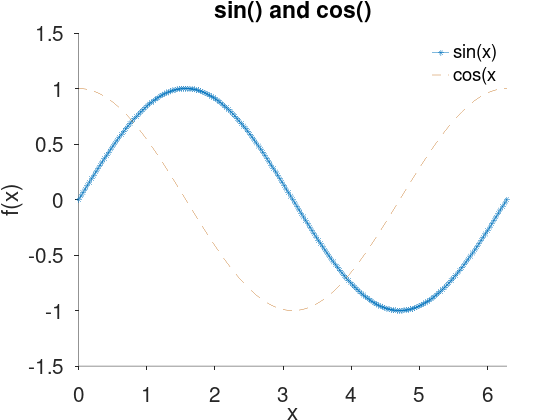
x = 0:pi/100:2*pi;
plot(x, sin(x), "linewidth", 0.5, "marker", "*")
hold on
plot(x, cos(x), "linestyle", "--", "color", [0.8 0.5 0.2])
title("sin() and cos()")
xlabel("x")
ylabel("f(x)")
xlim([0, 2*pi])
ylim([-1.5, 1.5])
legend("sin(x)", "cos(x")
set(gca, "fontsize", 18) %   一括して変更するとき
set(gca, "tickdir", "out") % ティックマークを外側に描く
legend("boxoff") %           凡例の外枠を描かない
box off  % default is on     図の外枠を描かない
grid off % default is off    グリッドを描かない
print fig.pdf %              pdf で保存
2. plot() のプロパティと値
色,ラインスタイル,マーカースタイルは fmt(format) として指定できる。ex. "or--"
2.1. 色
| プロパティ | 値 |
|---|---|
| "color" | [0, 1] の 3 個の数値(RGB トリプレット) "k", "r", "g", "y", "m", "c", "w" "blue", "black", "cyan", "green" "magenta","red", "white", "yellow" |
2.2. ライン スタイル
| プロパティ | 値 |
|---|---|
| "linestyle" | "-", "--", ":", "-.", "none" |
| "linewidth" | デフォルトは 1 |
2.3. マーカー スタイル
| プロパティ | 値 |
|---|---|
| "marker" | "+", "o", "*", ".", "x", "s", "d", "^", "v", ">", "<", "p", h", "none" |
| "markerfacecolor" | "color" で指定できるもの |
| "markeredgecolor" | "auto"(デフォルト) の場合は "markerfacecolor" で指定したものと同じ |
| "markersize" | デフォルトは 1 |
3. 保存
pdf ファイルで保存するときは print fig.pdf のようにすればよい。