第一回はこちらです。
1.グラフ作成
実際にグラフを作っていきます。
まず以下コマンドをたたきます。
> ggplot(data = murders)
これによってデータセットとプロットオブジェクトが関連づけられる(associateされる)らしいのですが、パッと見は何も起こらないのでわかりません。
次にパイプラインでデータを送ってレンダリングします。
> murders %>% ggplot()
今回も何も起こりません。我慢我慢...。
実際にグラフを画面に出すには以下のコマンドが必要になります。
> print(p)
> p
何も出てこない.....。
2.レイヤーを追加して(今度こそ)グラフ作成
プロットする際には以下のようにレイヤーを追加していく必要があるようです。
> murders %>% ggplot()
     +レイヤー1+ レイヤー2 + レイヤー3 + レイヤー4.....
多分ggplotの話だと思いますが、レイヤーは以下のようにgeom_○○ と表記します。geom はgeometoryの略ですね。
# 一行?で書くやり方
> murders %>% ggplot()+
+     geom_point(aes(x = population/10^6, y = total))

# 先にプロットの部分だけ割当しておくやり方。
> p <- murders %>% ggplot()
> p + geom_point(aes(x = population/10^6, y = total))
x軸y軸の値はデフォルトでセットしてくれるらしいです。便利ですね。
そしてよく使う関数ということで「aes」を紹介してくれました。aesthetic mappings と言ってたのですが「美的」としか訳が出てこないです。それでいいのだろうか...。このやり方はaes独特のやり方なのでほかの関数では通用しないので注意しましょうとのこと。aesはデータセットから中のオブジェクト名を見に行ってくれますが、aesの中以外でpopulationとか使うとエラーになるということかな?
> p + geom_point(aes(x = population/10^6, y = total)) +
+     geom_text(aes(population/10^6, total, label = abb))
これで州の名前が点ごとにつくようになりました。
こんな感じでaesの外側でabbのようなmurdersのオブジェクトを使おうとするとエラーになります。直前で言っていたやつですね。
geom_text(aes(population/10^6, total), label = abb)
# 点を大きくする。
> p + geom_point(aes(x = population/10^6, y = total), size =3 ) +
+     geom_text(aes(population/10^6, total, label = abb))

# X軸に沿って少しずらす
> p + geom_point(aes(x = population/10^6, y = total), size =3 ) +
+     geom_text(aes(population/10^6, total, label = abb), nudge_x = 1)

# aes部分をまとめる
> p <- murders %>% ggplot(aes(population/10^6, total, label = abb))
> p + geom_point(size = 3) + geom_text(nudge_x = 1.5)

# 空きスペースにコメントを入れる。(州の略名は消える)
> p + geom_point(size = 3) + geom_text(aes(x = 10, y = 800, label = "Hello there!"))

# 空きスペースのコメントと州の略名両方出力
> p + geom_point(size = 3) + geom_text(aes(x = 10, y = 800, label = "Hello there!")) + geom_text(nudge_x = 1.5)
3.ラベル、色、軸のスケール
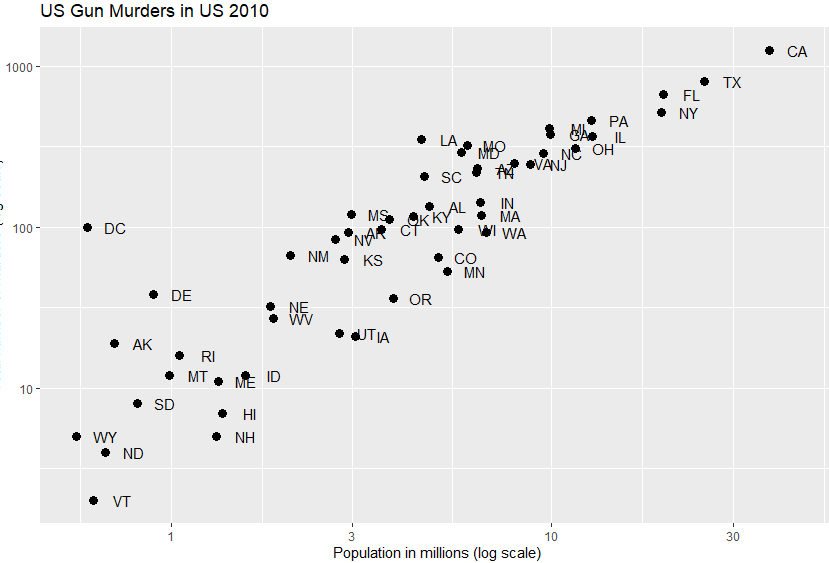
だいぶ形になってきました。続けてX軸とY軸を対数にしてみます。
> p + geom_point(size = 3) +
+     geom_text(nudge_x = 0.05)+
+     scale_x_continuous(trans = "log10") +
+     scale_y_continuous(trans = "log10")

# 同じやり方で少し省略
> p + geom_point(size = 3) +
+     geom_text(nudge_x = 0.075)+
+     scale_x_log10() +
+     scale_y_log10()
※0.075に変えているのはグラフを再描画したことが分かるようにするためです。
変えてみてわかったんですが、細かいところの順位がはっきりと見えるようになりました。
さて、タイトルを加える時が来ました。特に難しいことはなく+でコンポーネントを追加していくだけです。
> p + geom_point(size = 3) +
+     geom_text(nudge_x = 0.075)+
+     scale_x_log10() +
+     scale_y_log10() +
+     xlab("Population in millions (log scale)") +
+     ylab("Total number of murders (log scale)") +
+     ggtitle("US Gun Murders in US 2010")
では、続いて点だけを操作したいので、他はすべてPに再割り当てしてひとまとめにしてしまいます。
> p <- murders %>% ggplot(aes(population/10^6, total, label = abb)) +
+     geom_text(nudge_x = 0.075)+
+     scale_x_log10() +
+     scale_y_log10() +
+     xlab("Population in millions (log scale)") +
+     ylab("Total number of murders (log scale)") +
+     ggtitle("US Gun Murders in US 2010")

# 点を青くする。
> p + geom_point(size = 3, color = "blue")
色を変えられることはわかりましたが、見やすくなったわけではありません。カテゴリカルな分類によって色を分けられたら便利ですよね。ってことでそのまま以下のように書いてみます。
> p + geom_point(size = 3,aes(col = region))
先生は第一引数にaesがあるのが意味があるよって言ってたのですが、ヘソ曲がりなのであえて逆にやってみました。
人口当たりの殺人件数の目安として人口100万人当たり何件殺人が起きるかという比率を使います。以下のように人口と発生件数をSUMして。ただ、この書き方は自分もよくわかってないです。なんでパイプライン二つ使うんだろう?とか。
# 人口100万人あたりの発生率を求める
> r <- murders %>% summarize(rate = sum(total)/ sum(population)* 10^6) %>% .$rate

# 基準線を引く
> p + geom_point(size = 3,aes(col = region)) + geom_abline(intercept = log10(r))

# 基準線を灰色かつ点線にする。
> p + geom_point(size = 3,aes(col = region)) + geom_abline(intercept = log10(r), lty =2, color = "darkgrey")
scale_color_discrete というのも教えてもらったが、使い方いまいちわからず....。
4.テーマを変更する。
ほぼ完成品に近づきましたが、もう少し見栄えをよくしましょう。
以下のコマンドでテーマを変更します。
> ds_theme_set()
> library(ggthemes)
 library(ggthemes) でエラー:
   ‘ggthemes’ という名前のパッケージはありません
むむ。先生は何事もなかったかのように使っていましたが、インストールされていないような気がします。前回の終わりでも外部のものを使って見栄えをよくします見たいなこと言ってたし。特にエラーメッセージ出なかったら下のインストールは飛ばしてください。
> install.packages("ggthemes")
> install.packages("ggrepel")
で、改めて以下コマンドを実行。もう一つのggrepelは後で使います。
> library(ggthemes)
> p + theme_economist()
今までのを全てひとまとめにすると
# ライブラリを読み込む
> library(ggthemes)
> library(ggrepel)
# 補助線に必要なrを作る。
> r <- murders %>%
+     summarize(rate = sum(total)/ sum(population)* 10^6) %>% .$rate
# グラフを描画する。
> murders %>% ggplot(aes(population/10^6, total, label = abb))+
+     geom_abline(intercept = log10(r),lty = 2, color = "darkgrey") +
+     geom_point(aes(col=region), size = 3) +
+     geom_text_repel() +
+     scale_x_log10() +
+     scale_y_log10() +
+     xlab("Populations in millions(log scale)") +
+     ylab("Total number of murders(log scale)") +
+     ggtitle("US Gun Murders in US 2010") +
+     scale_color_discrete(name= "Region") +
+     theme_economist()
になります。rの作り方がわかってないのは相変わらずです。

