SAS ViyaはAIプラットフォームを提供しています。デモもあるのですが、全体が英語なので利用するまでに躊躇してしまう人も多いかと思います。そこで、PythonでFactorization Machineの基本的な使い方を体験する流れを紹介します。
利用開始まで
まず SASの開発者サイトにアクセスします。開発者サイトは https://developer.sas.com/home.html です。
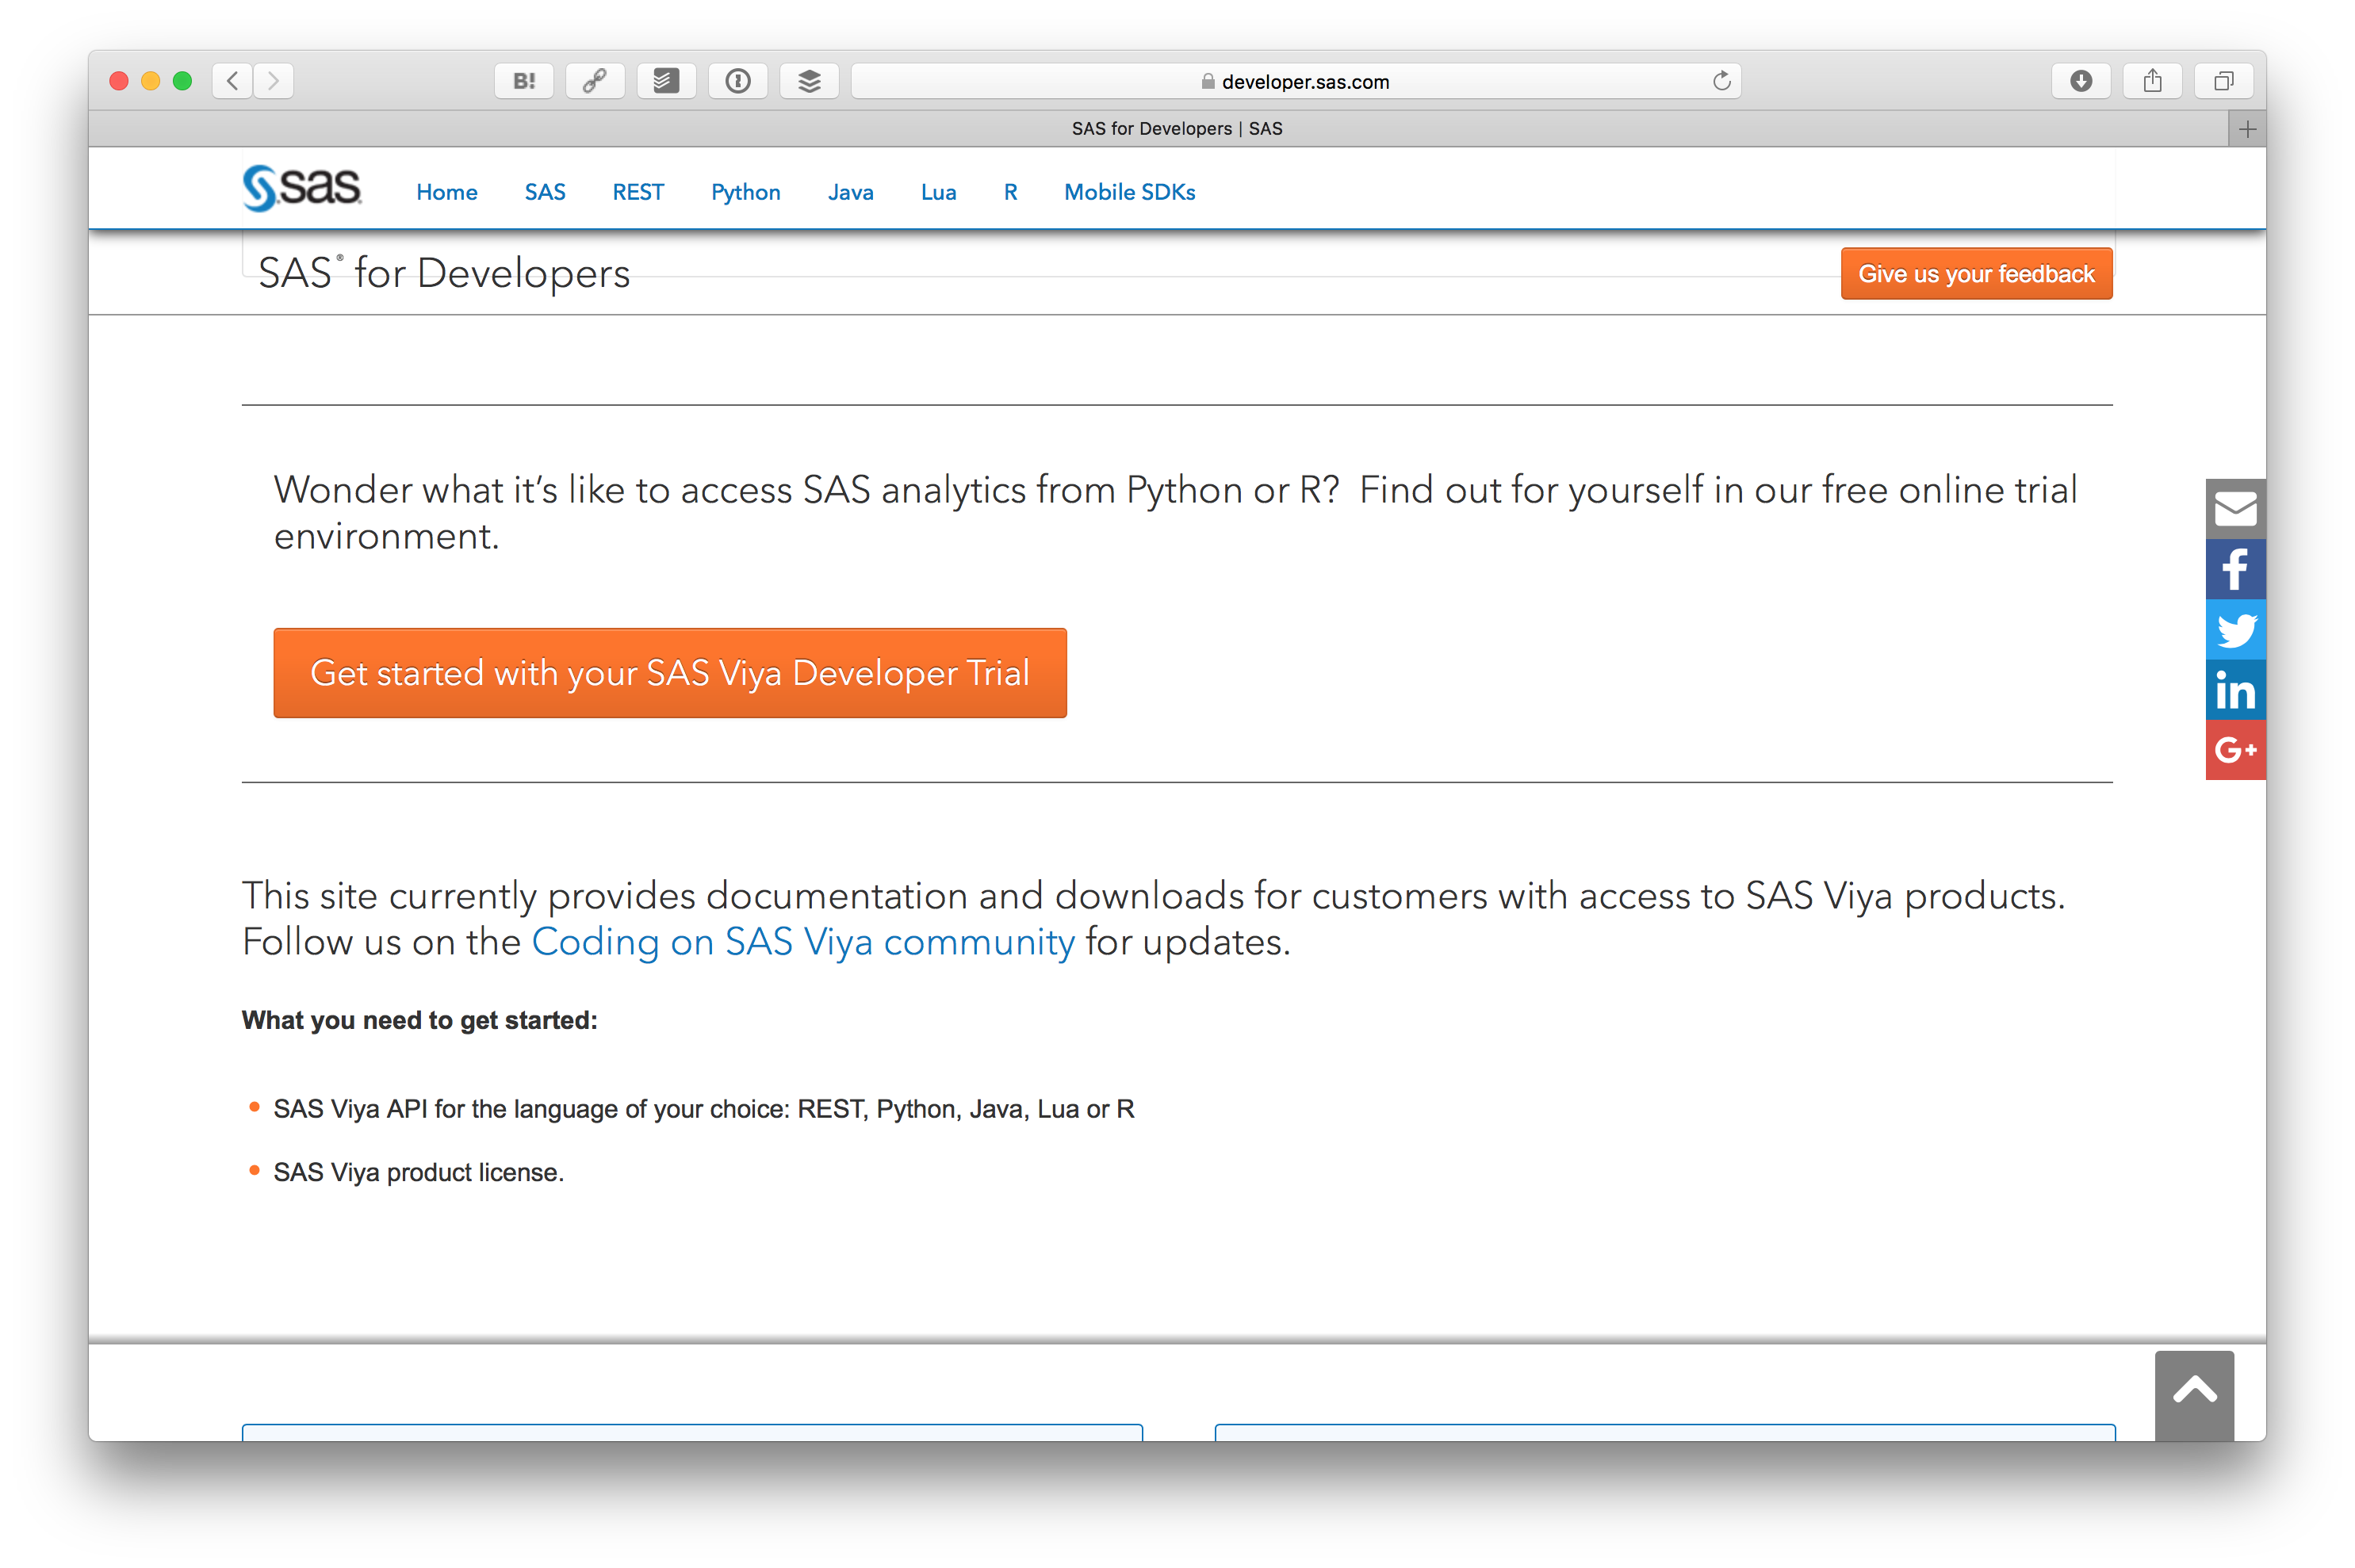
そして、 Get started with your SAS Viya Developer Trial を押します。
試すためには SAS Profile (SASプロファイル) というのが必要です。まず Create one をクリックします。

SASプロファイルを登録するをクリックします。

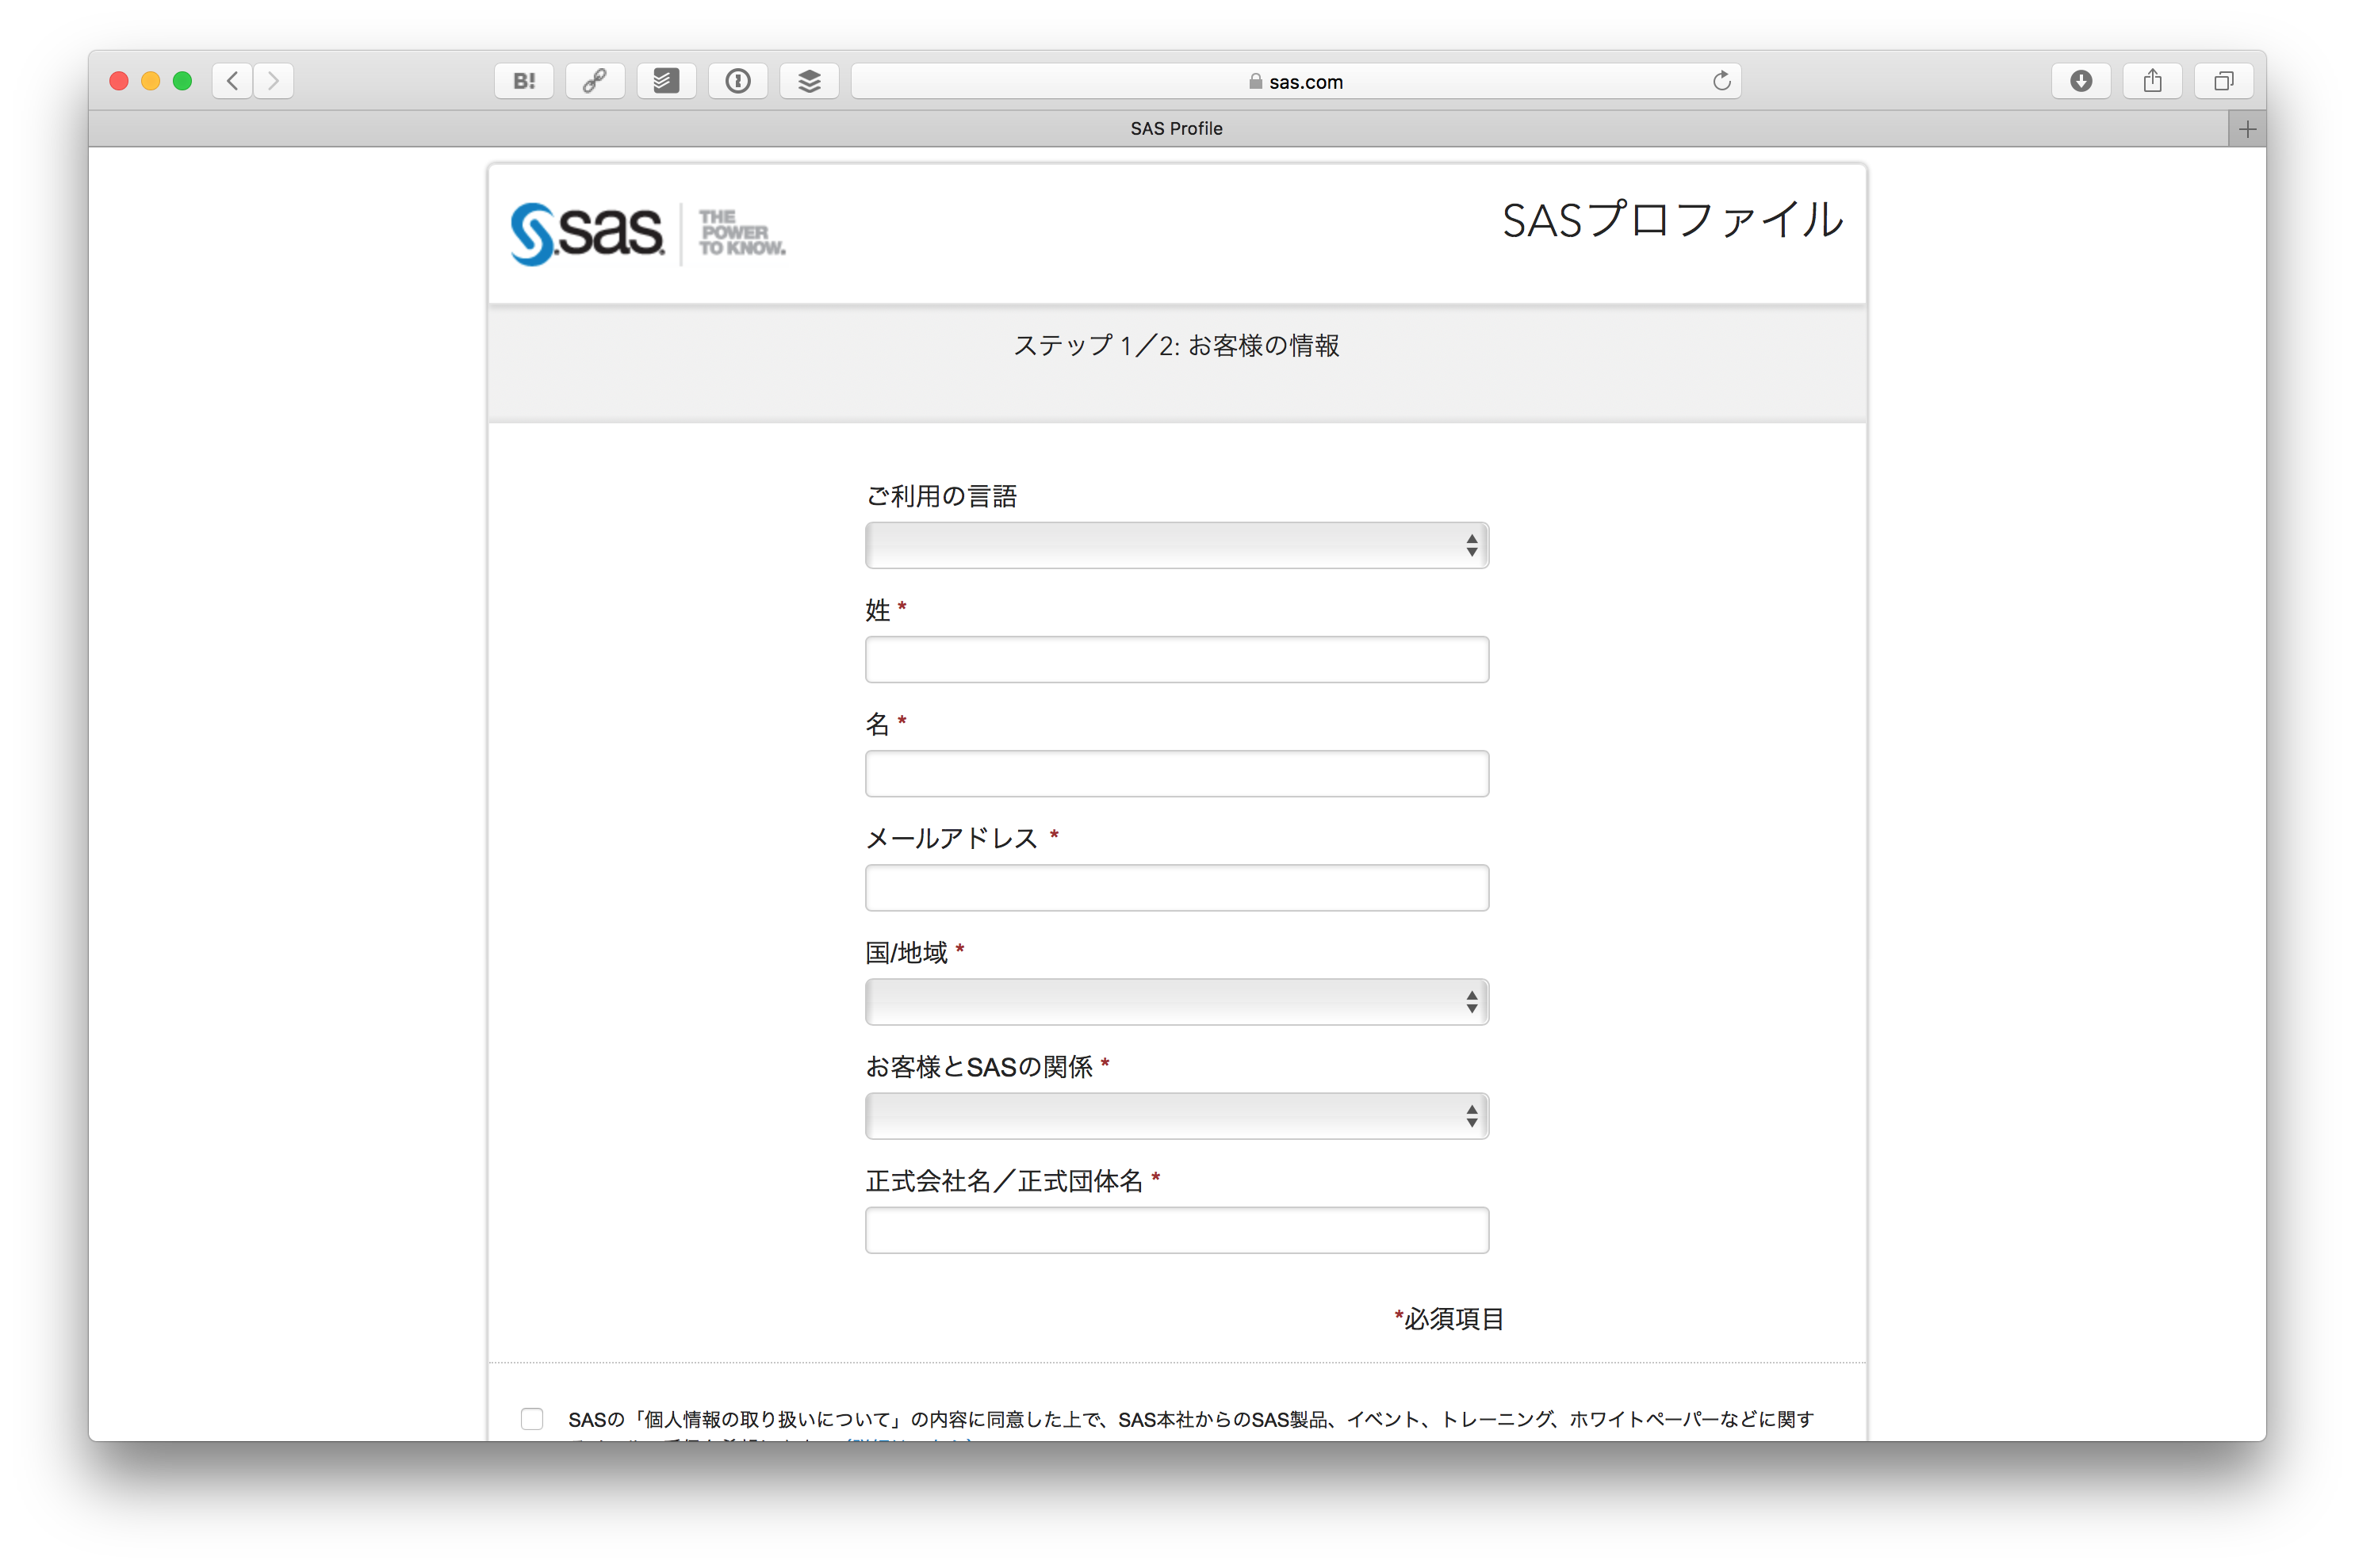
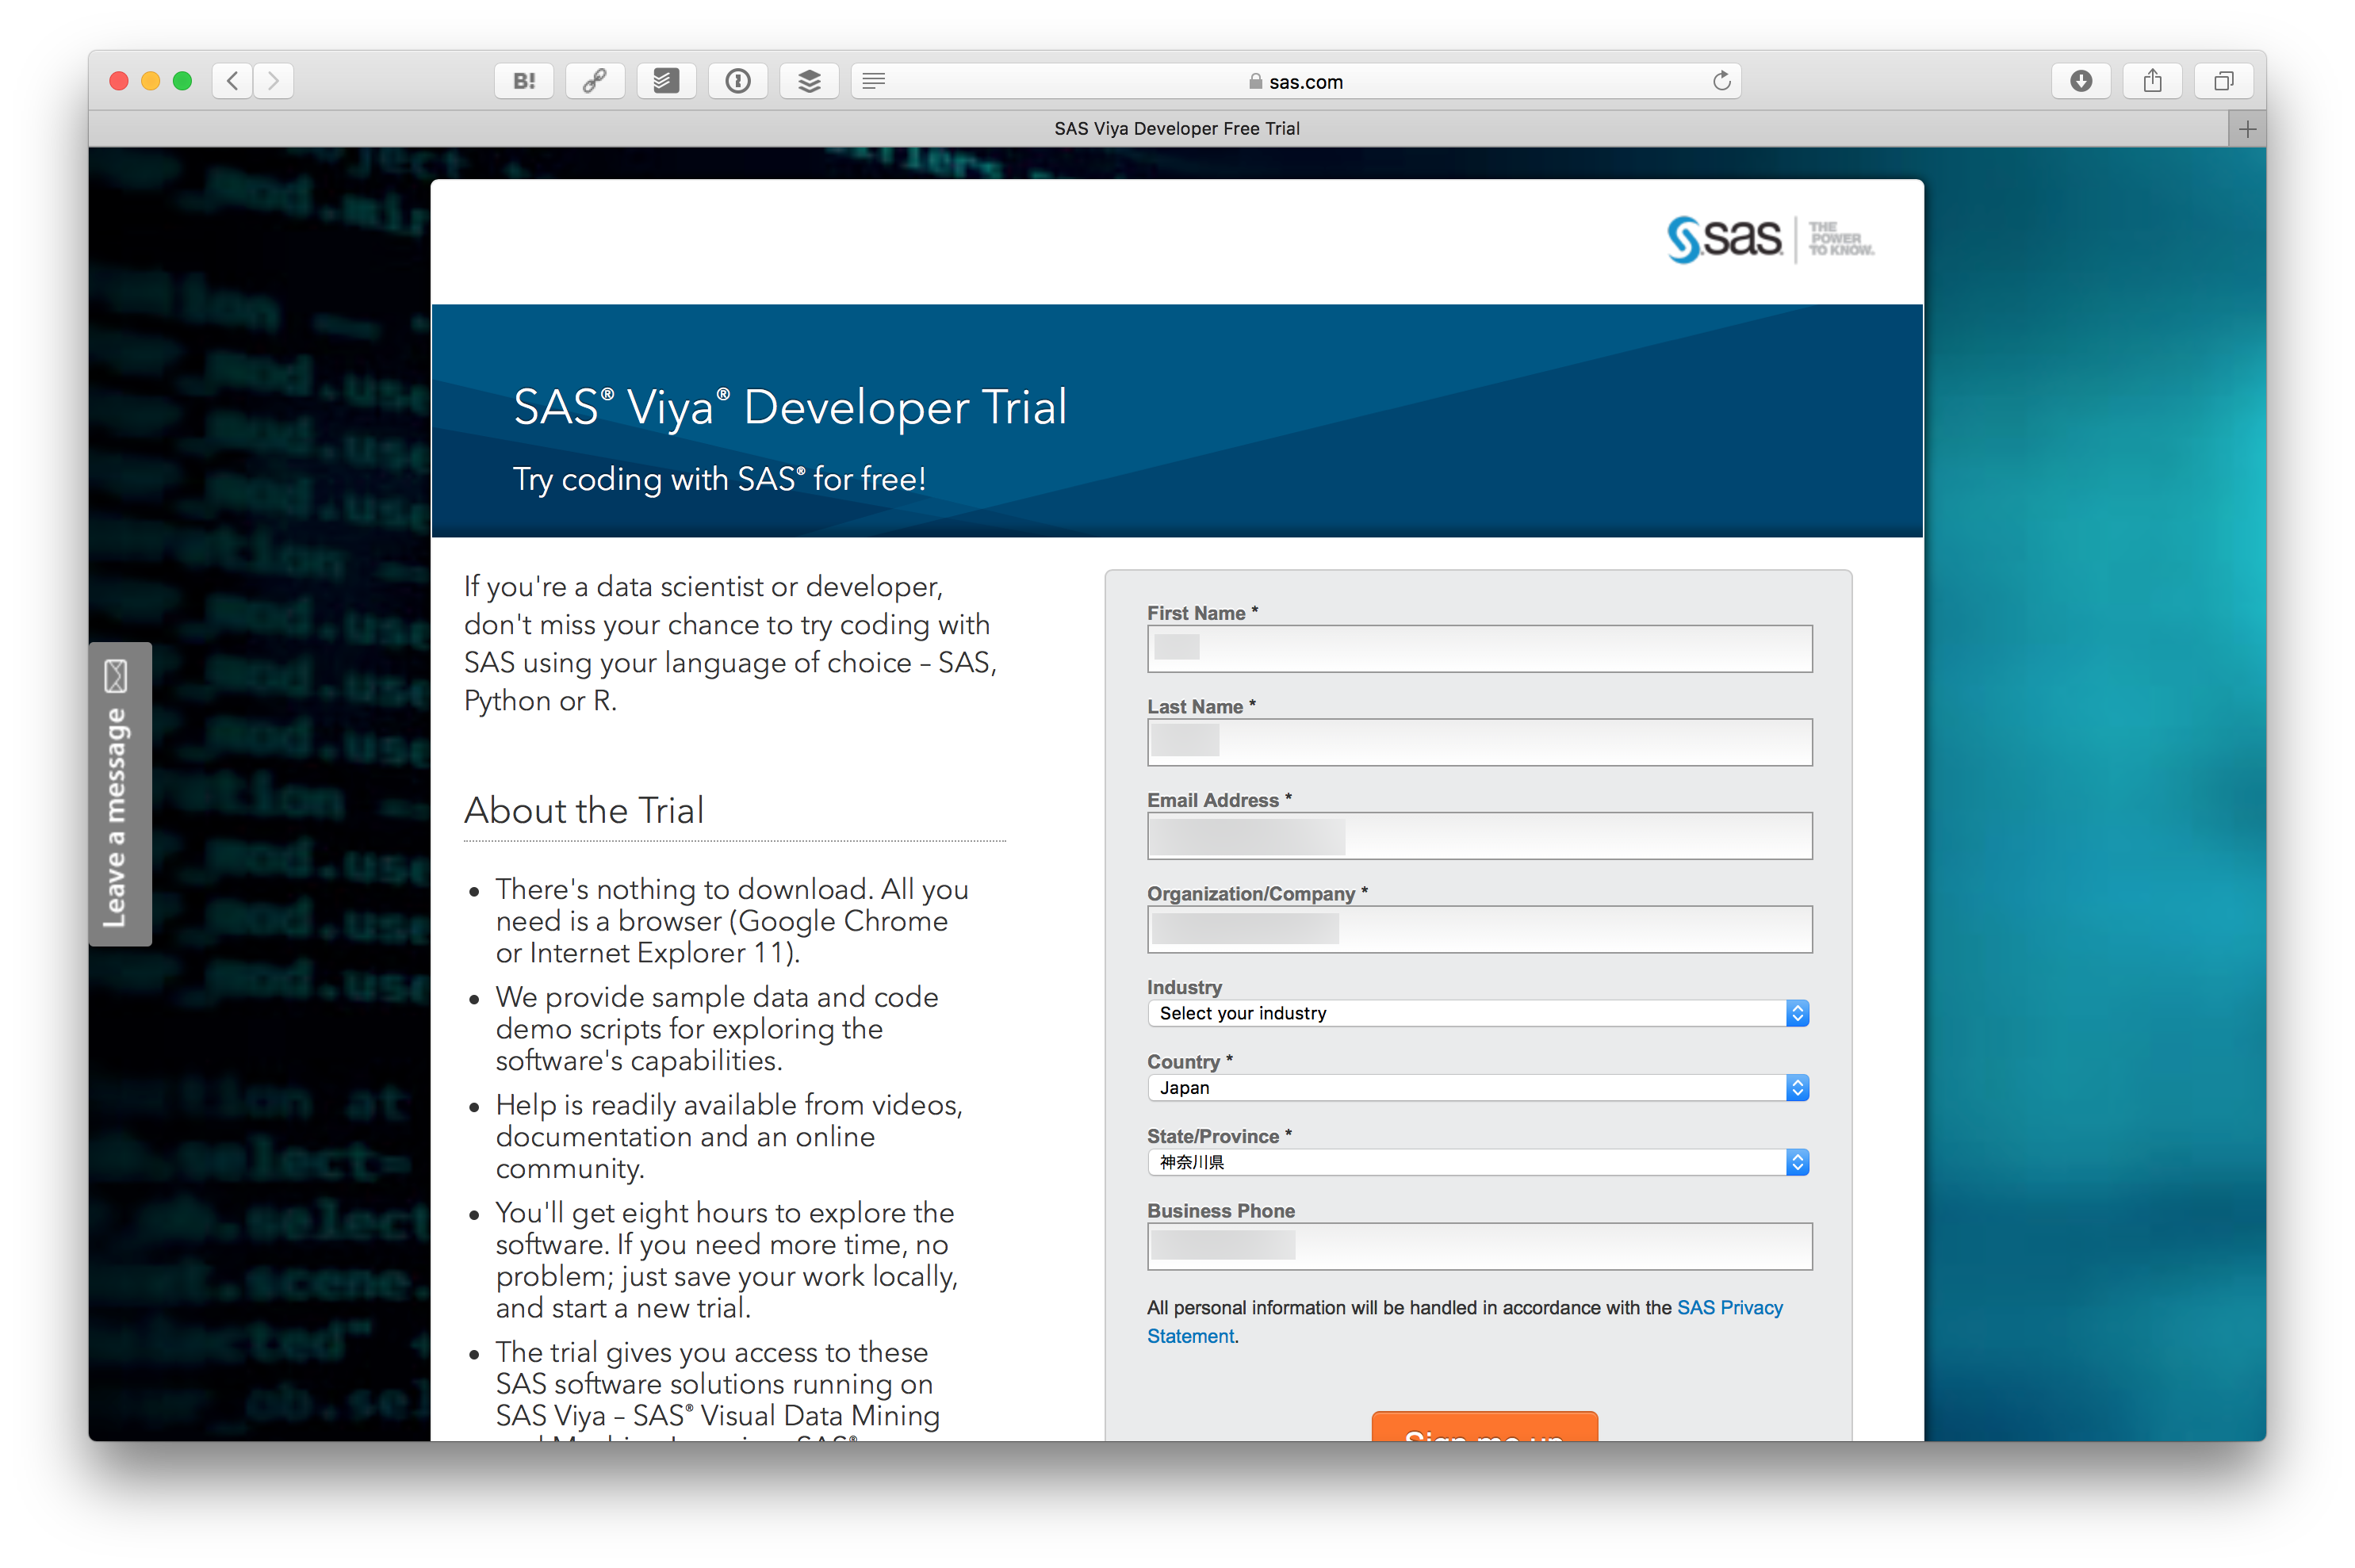
情報を入力します。
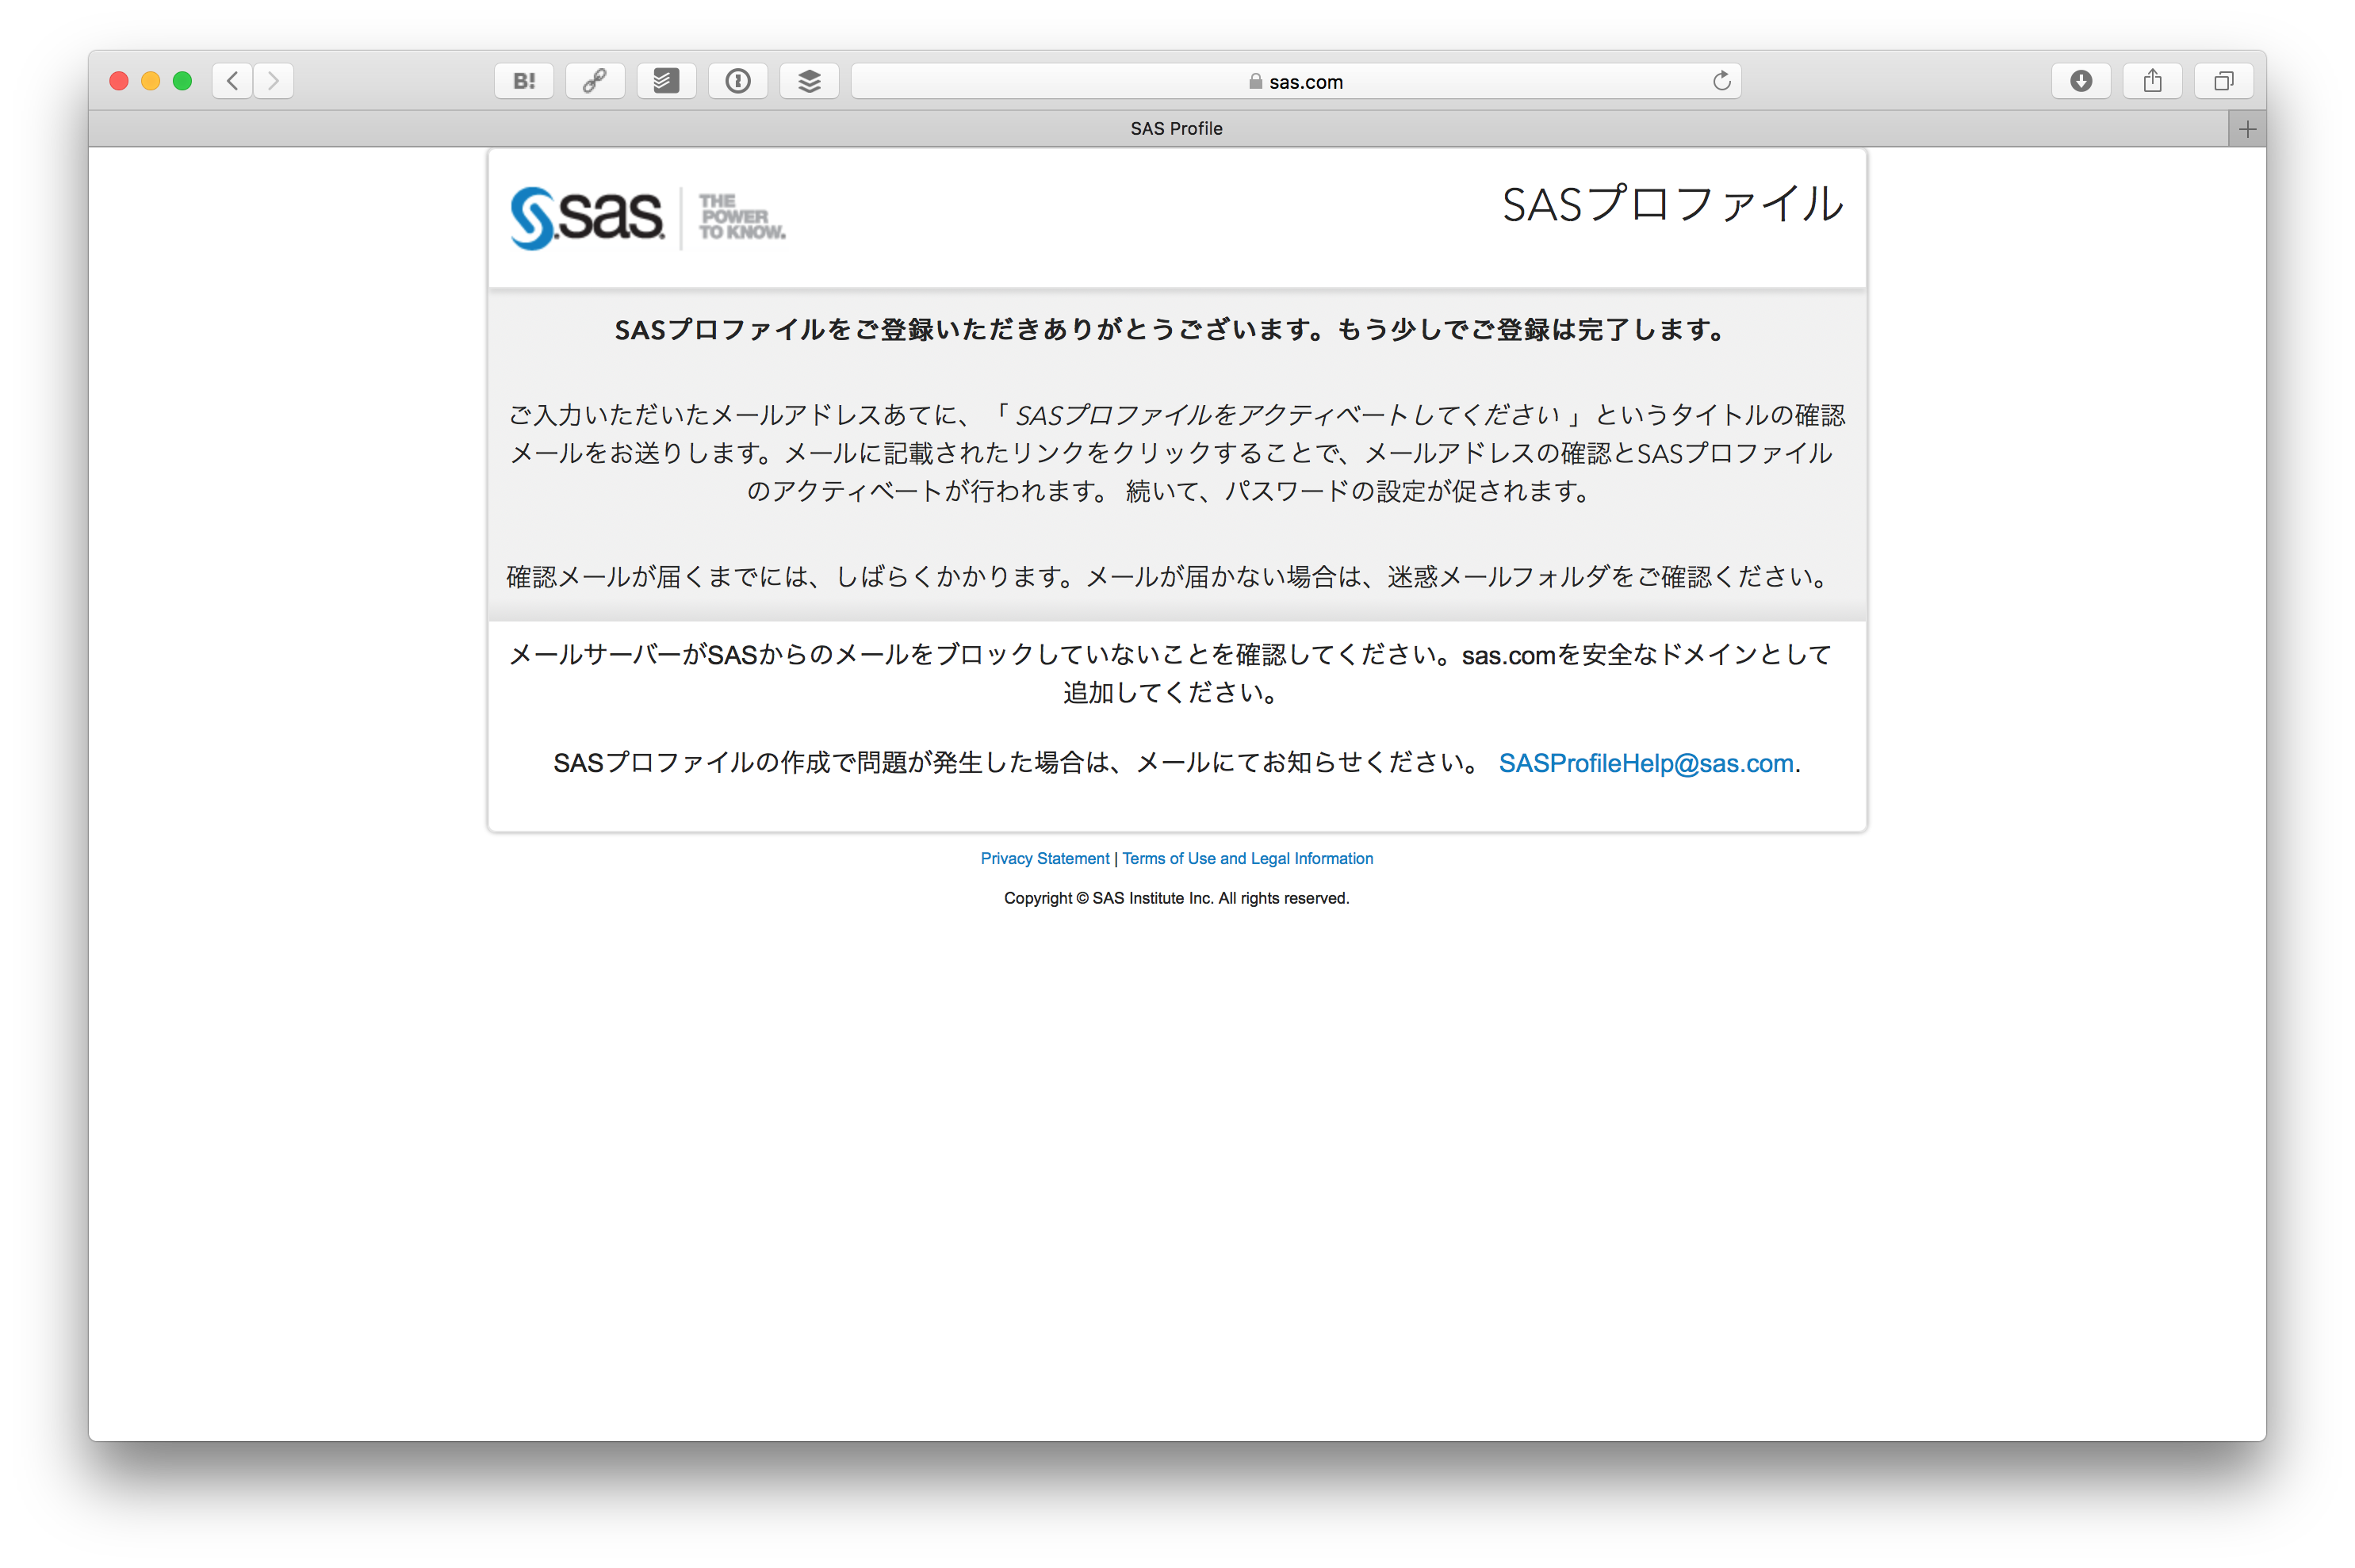
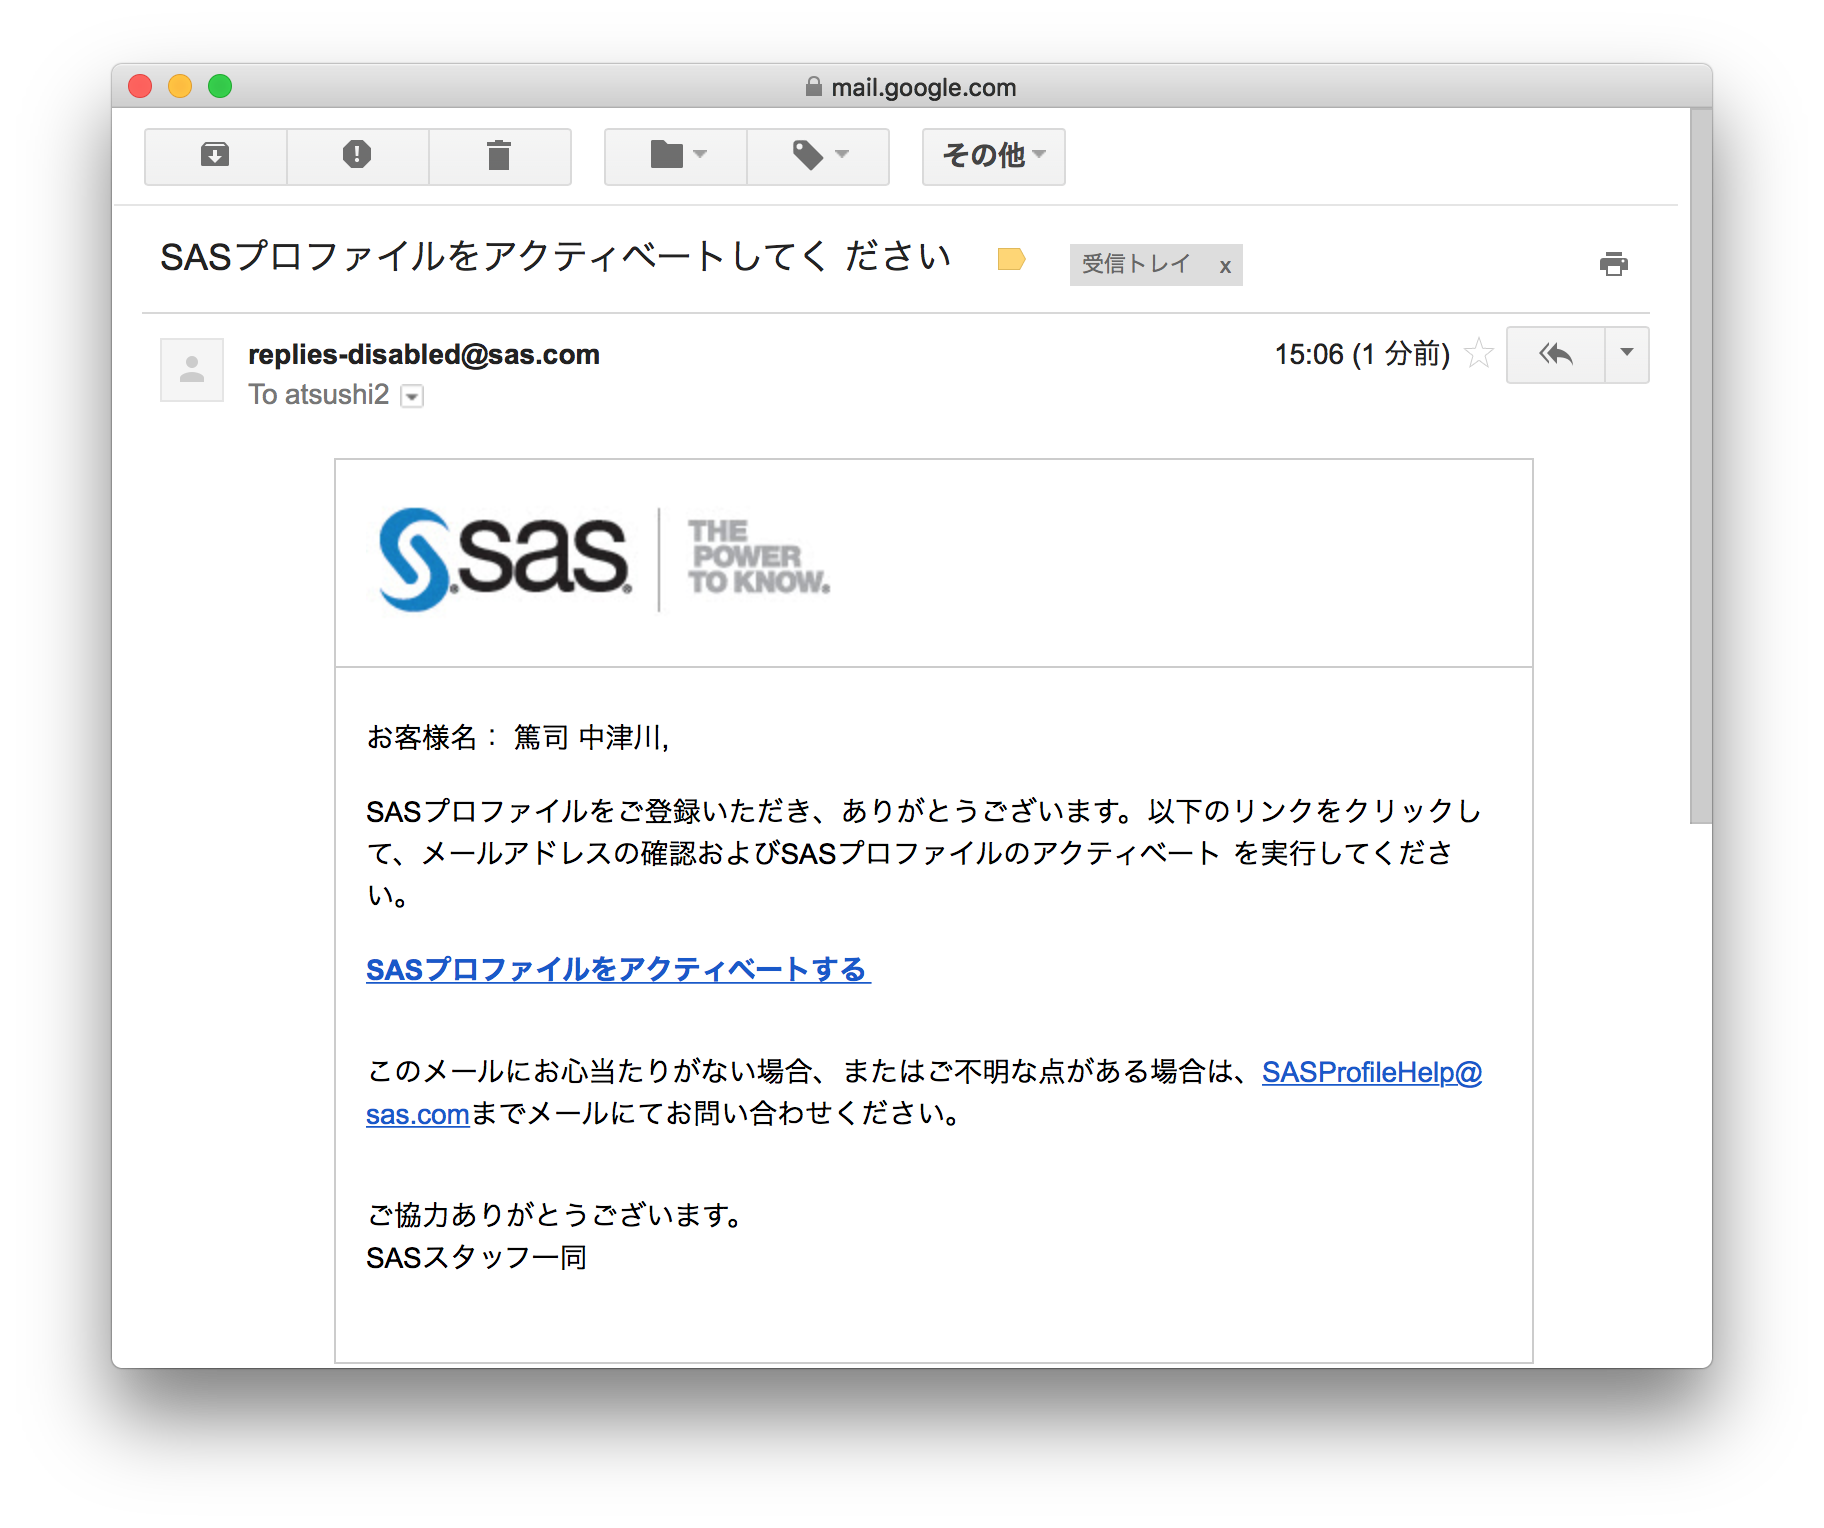
フォームを送信するとメールが送られてきます。
メールに書かれている SASプロファイルをアクティベートする をクリックします。
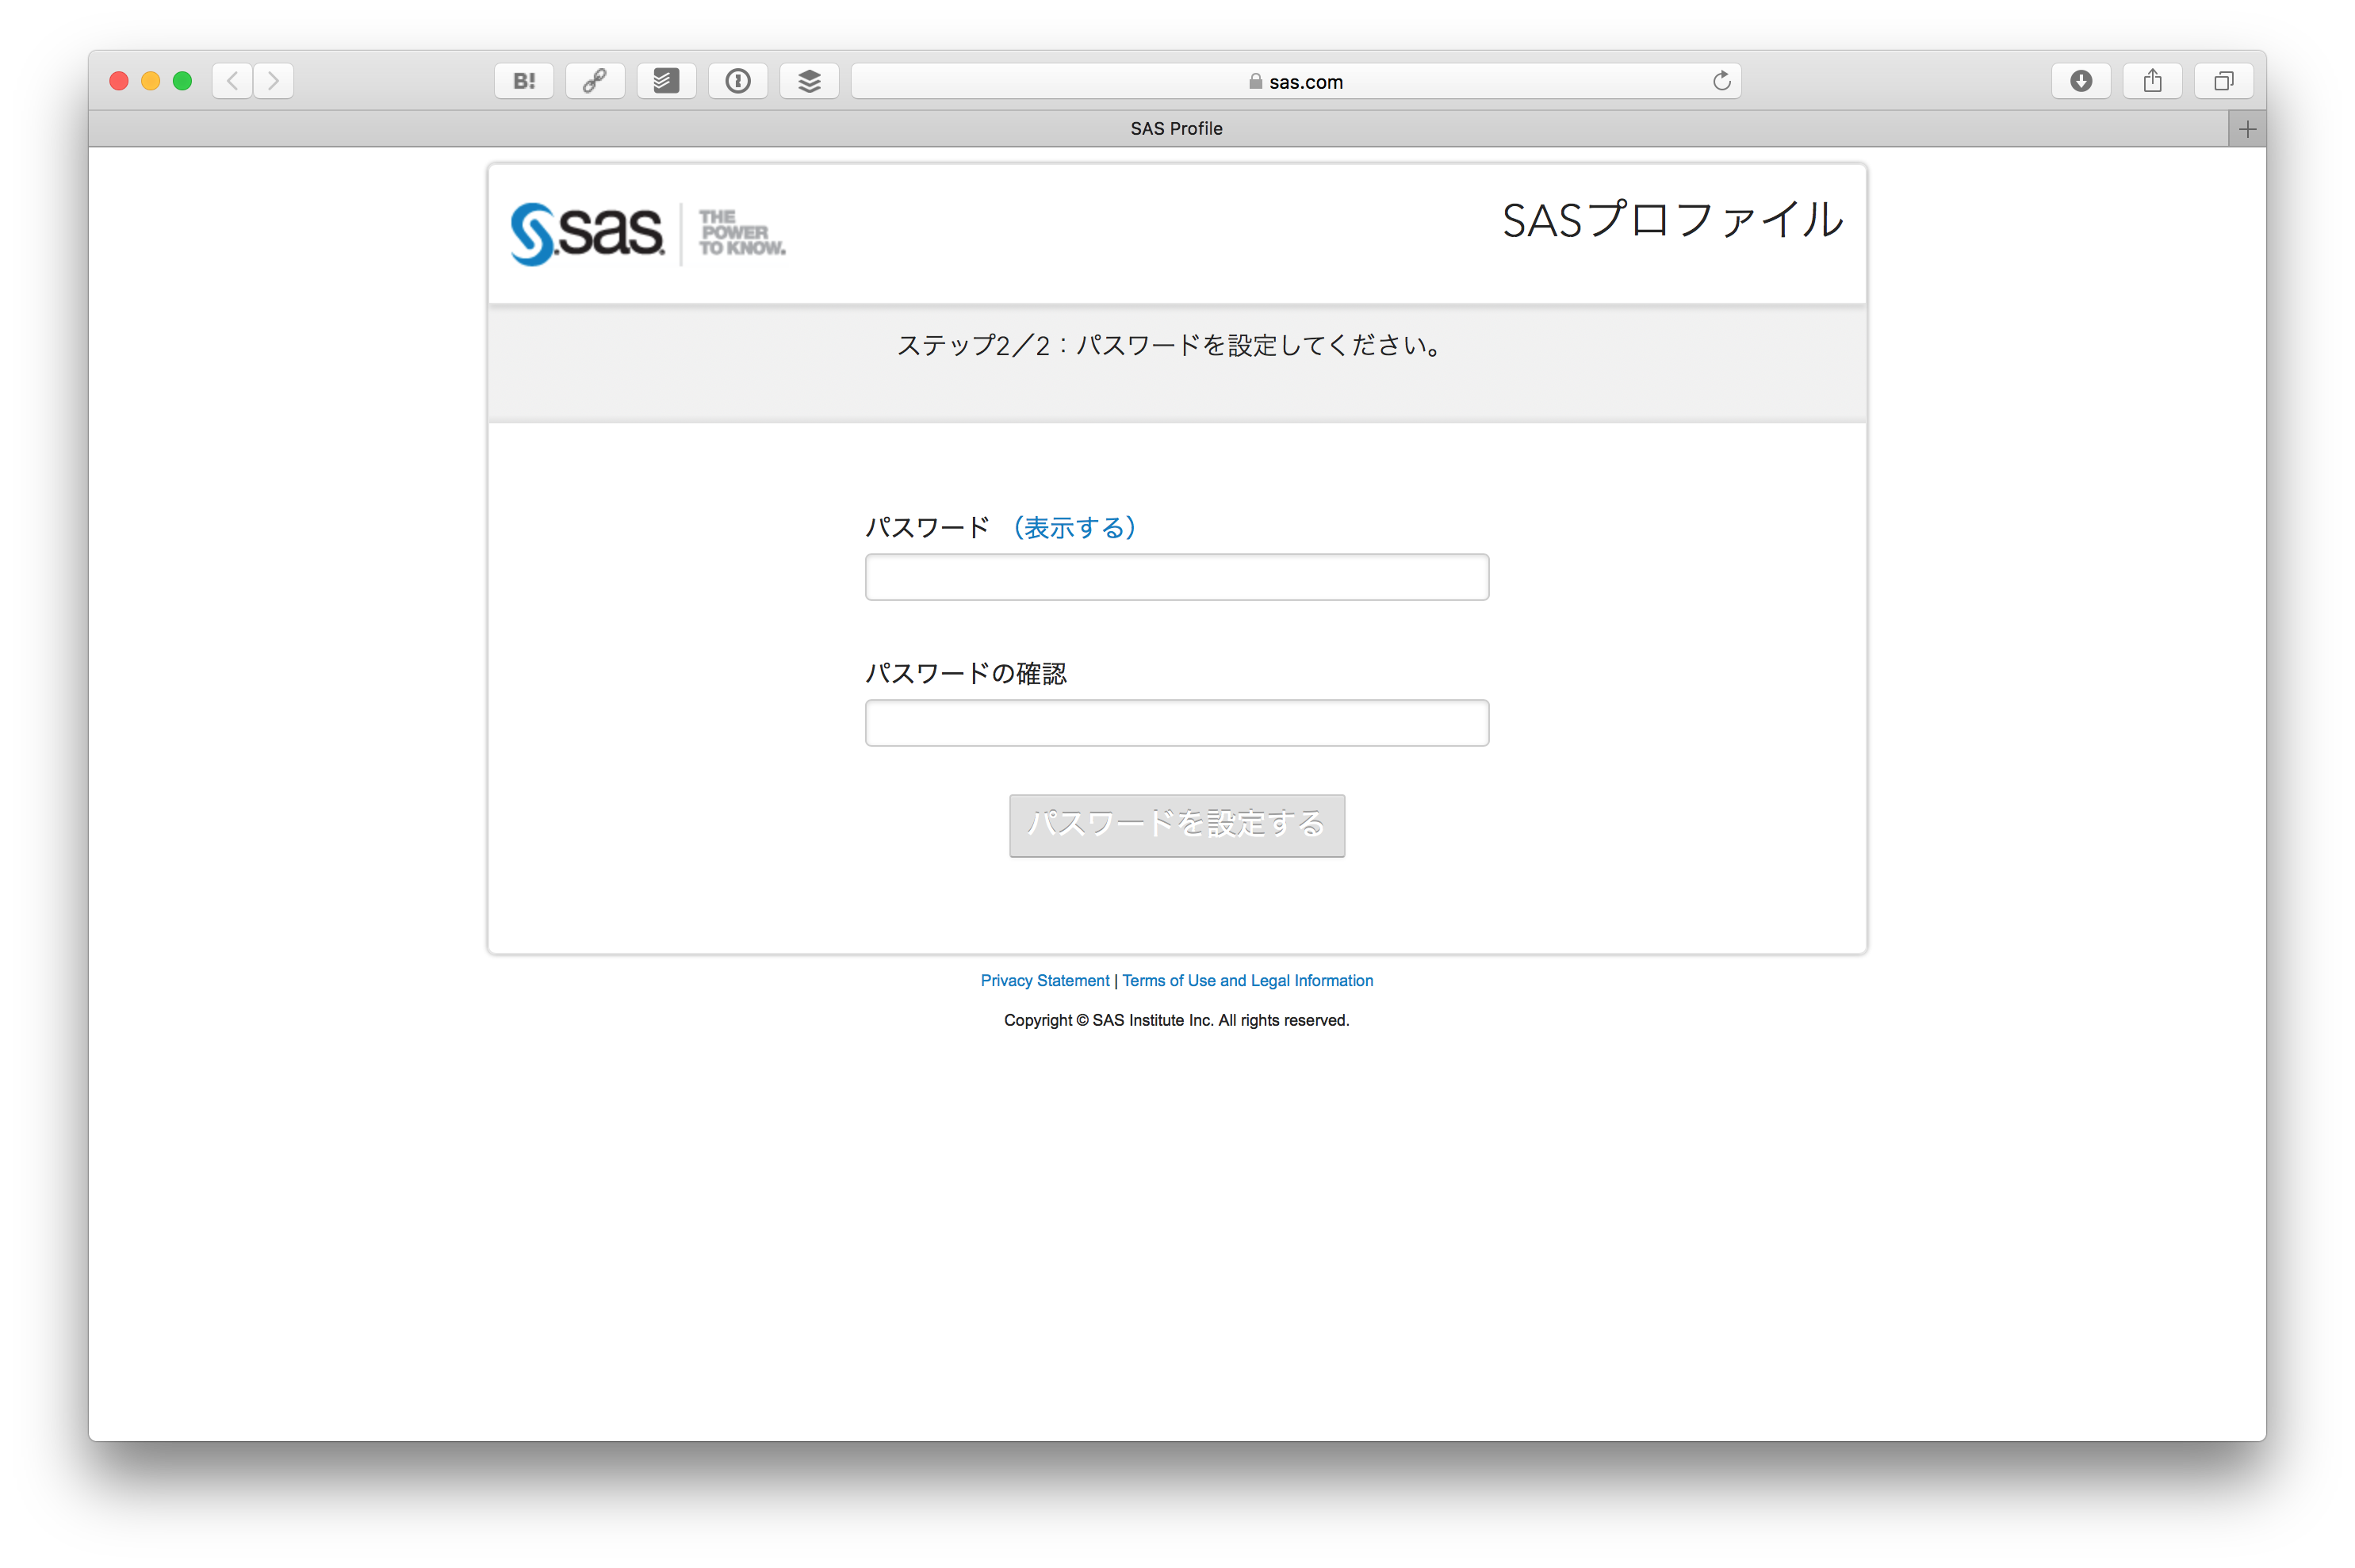
そしてパスワードを設定します。
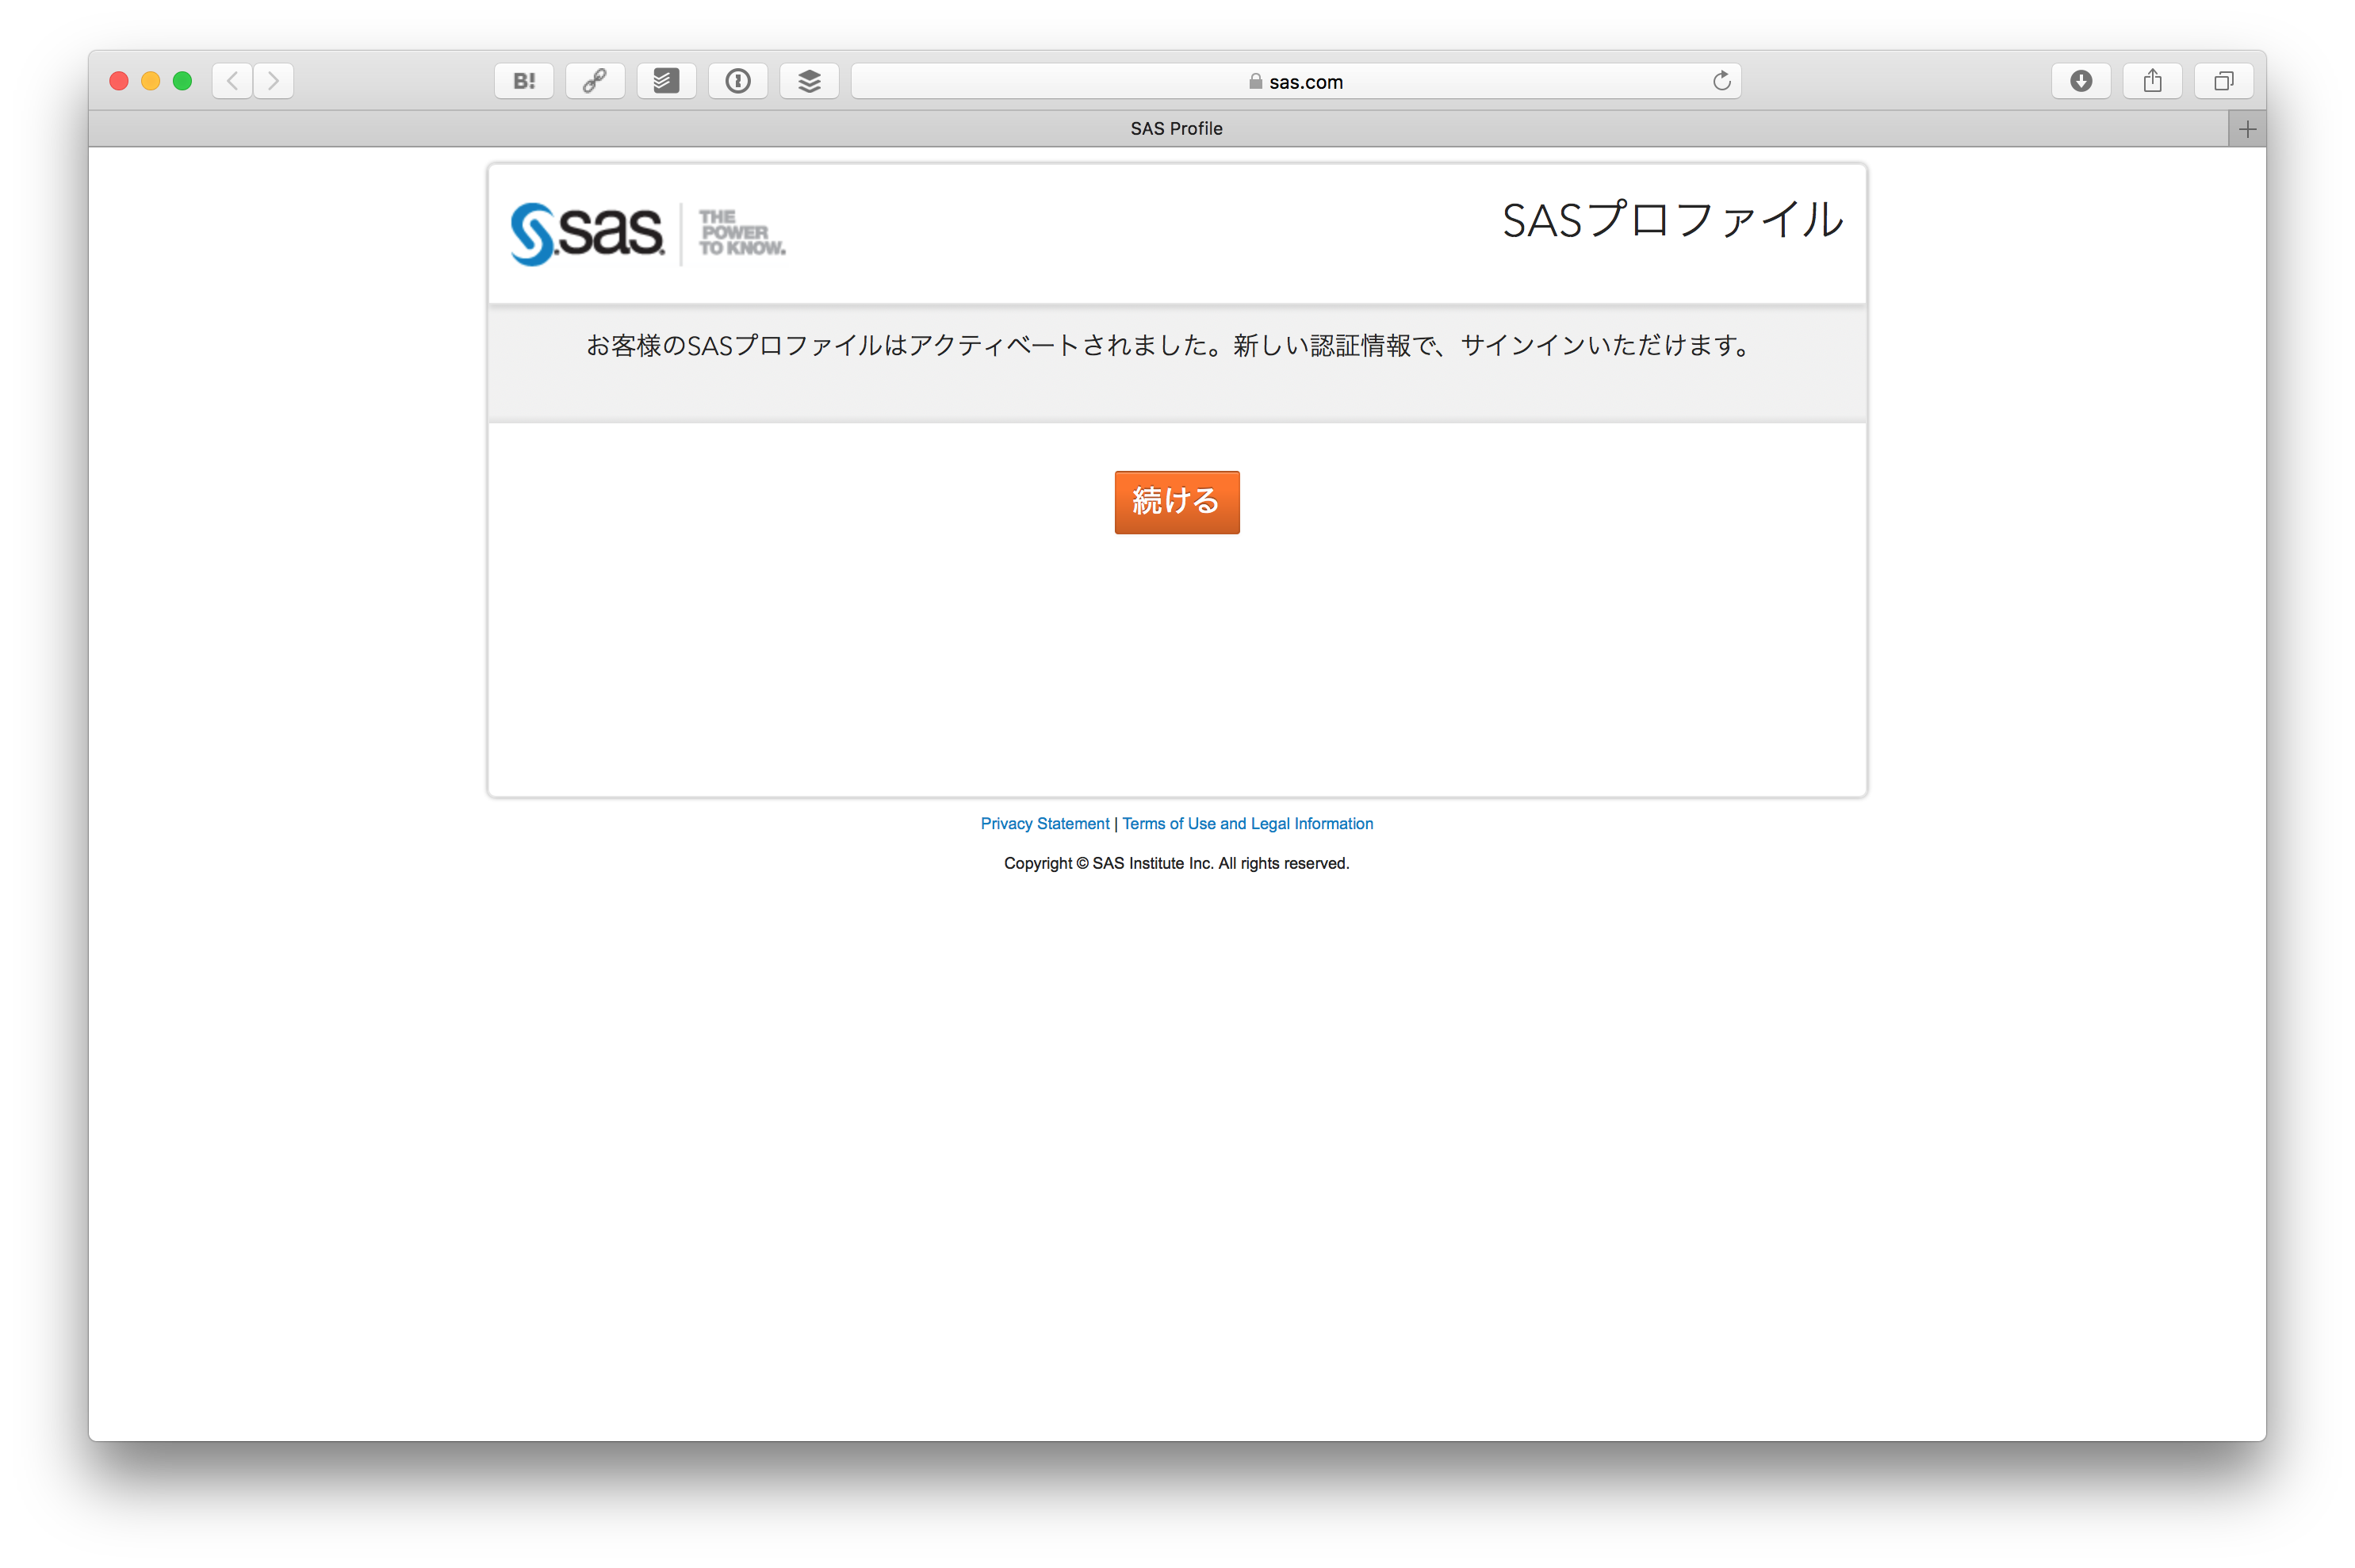
SASプロファイルがアクティベートされます。 続ける をクリックします。
そうすると先ほどの SAS® Viya® Developer Trial の画面に戻ってきますので、 今度はSign In をクリックします。
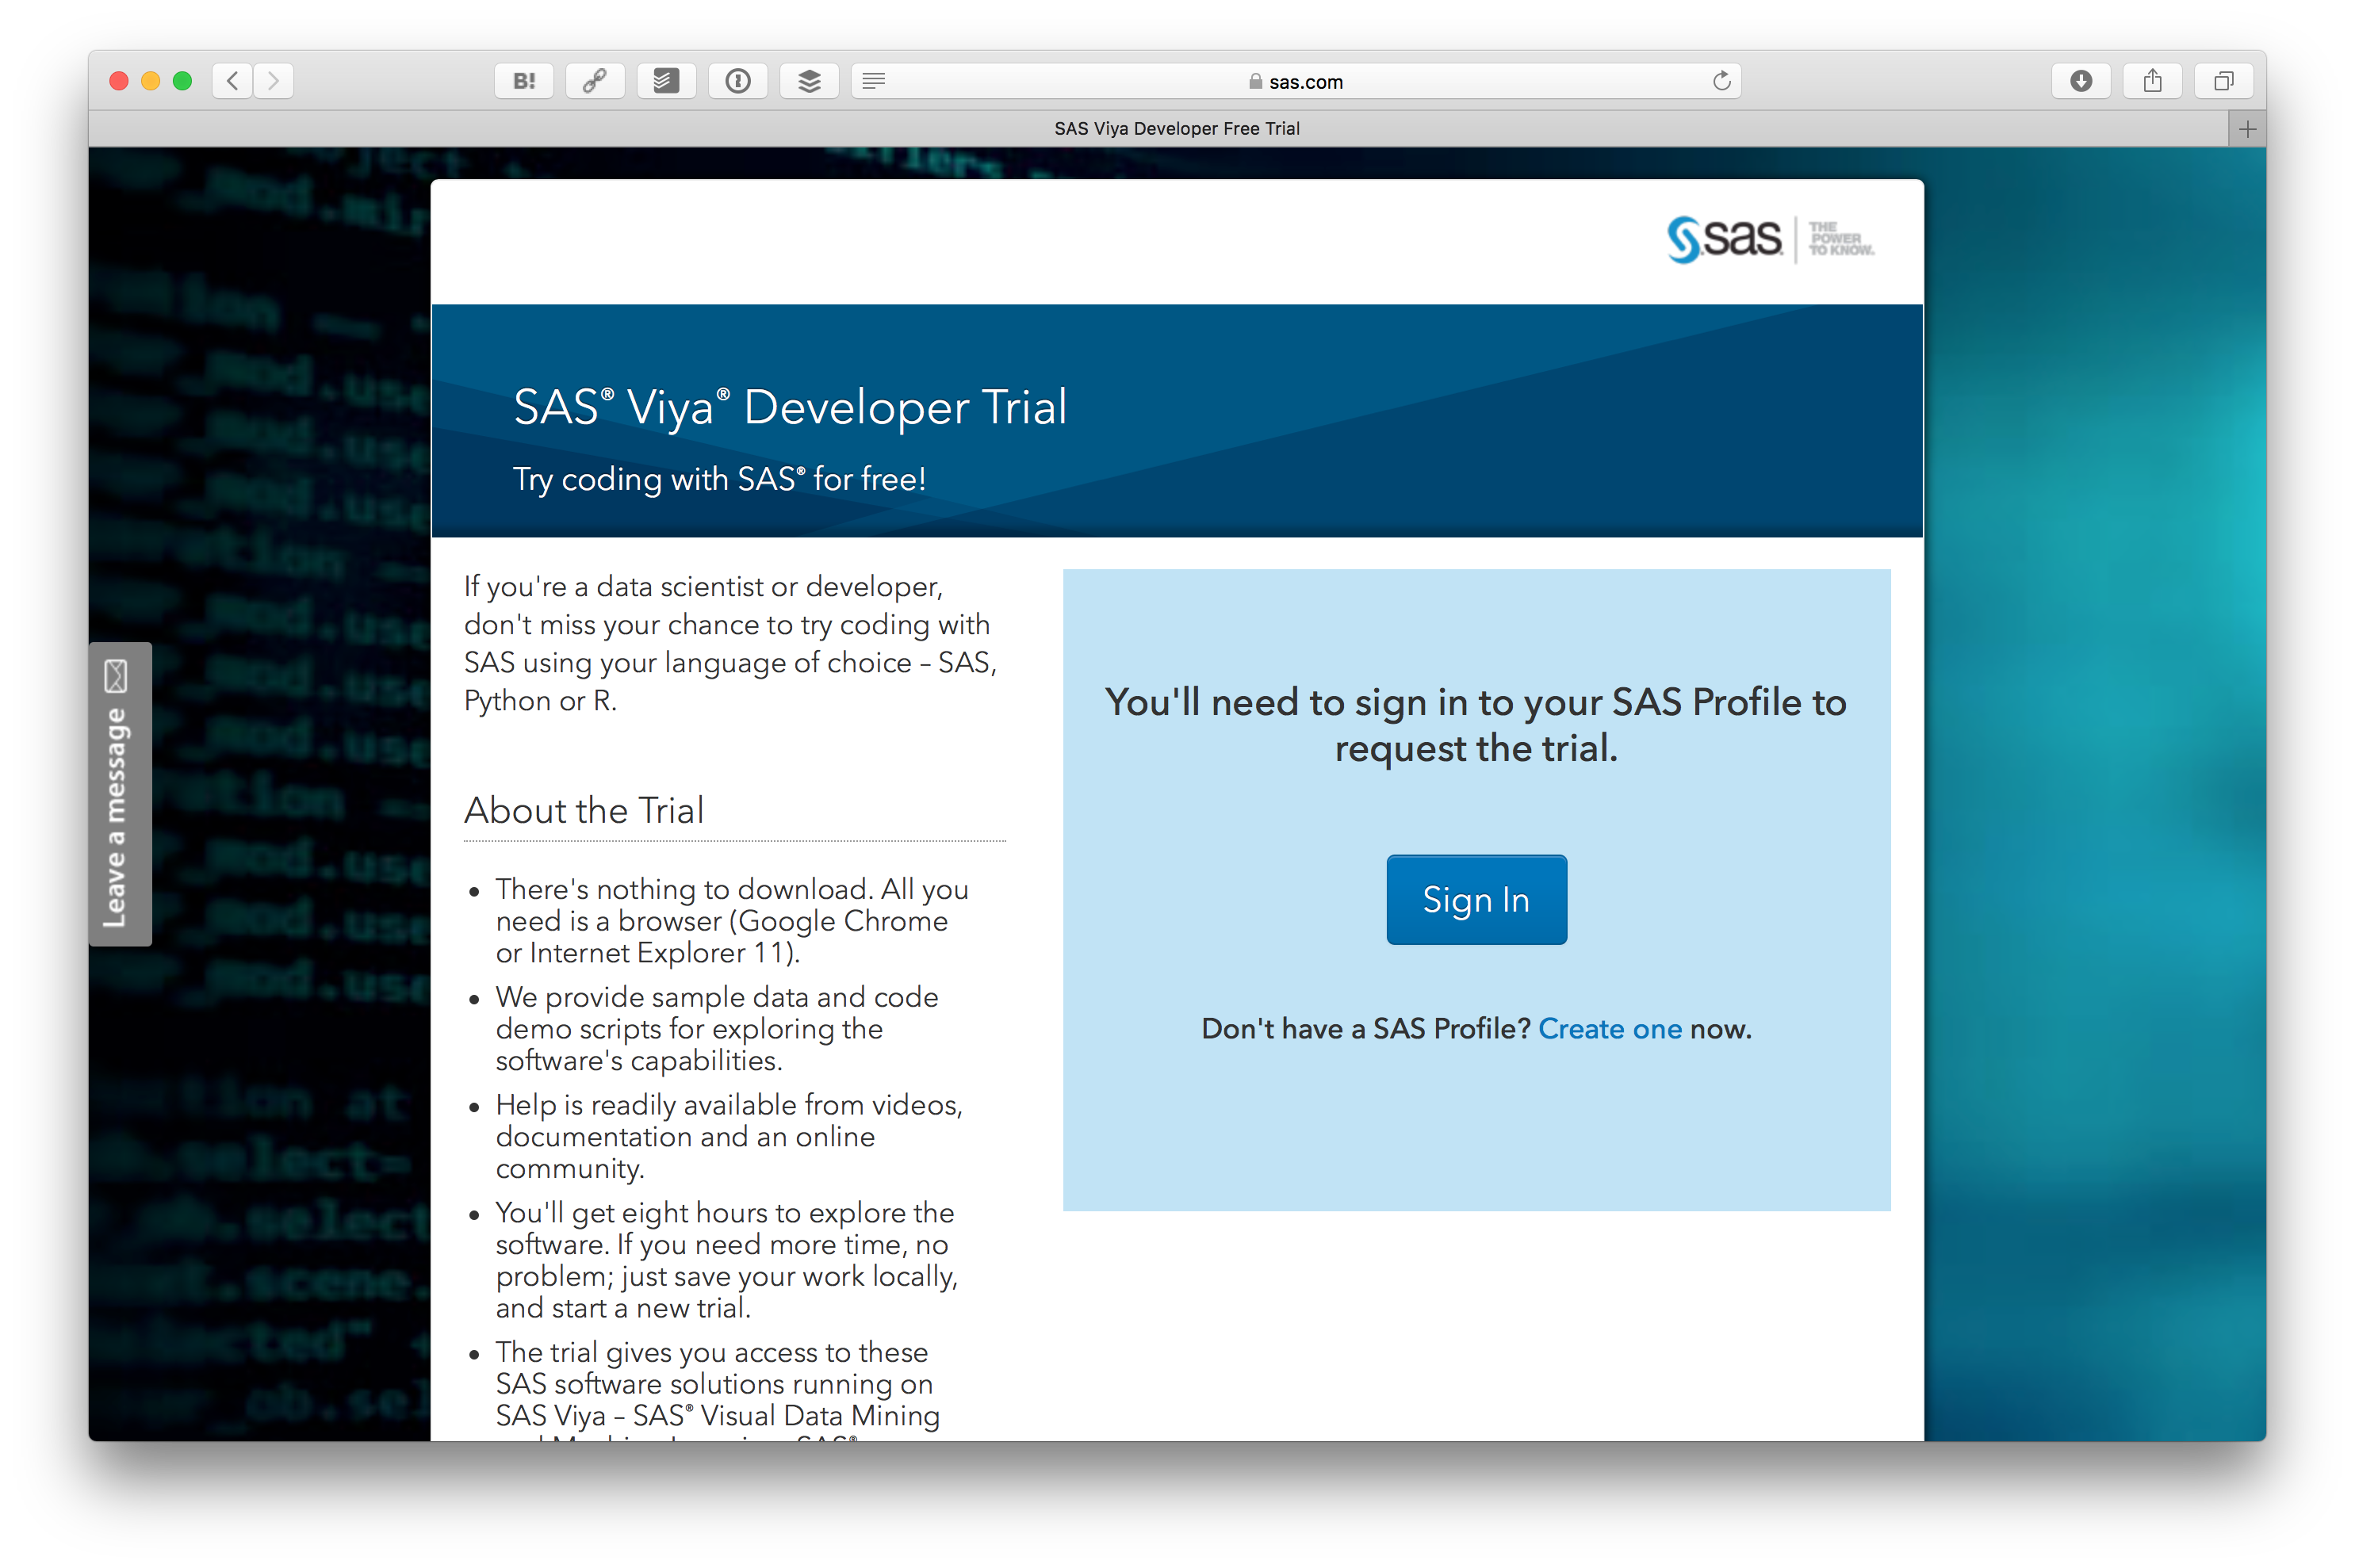
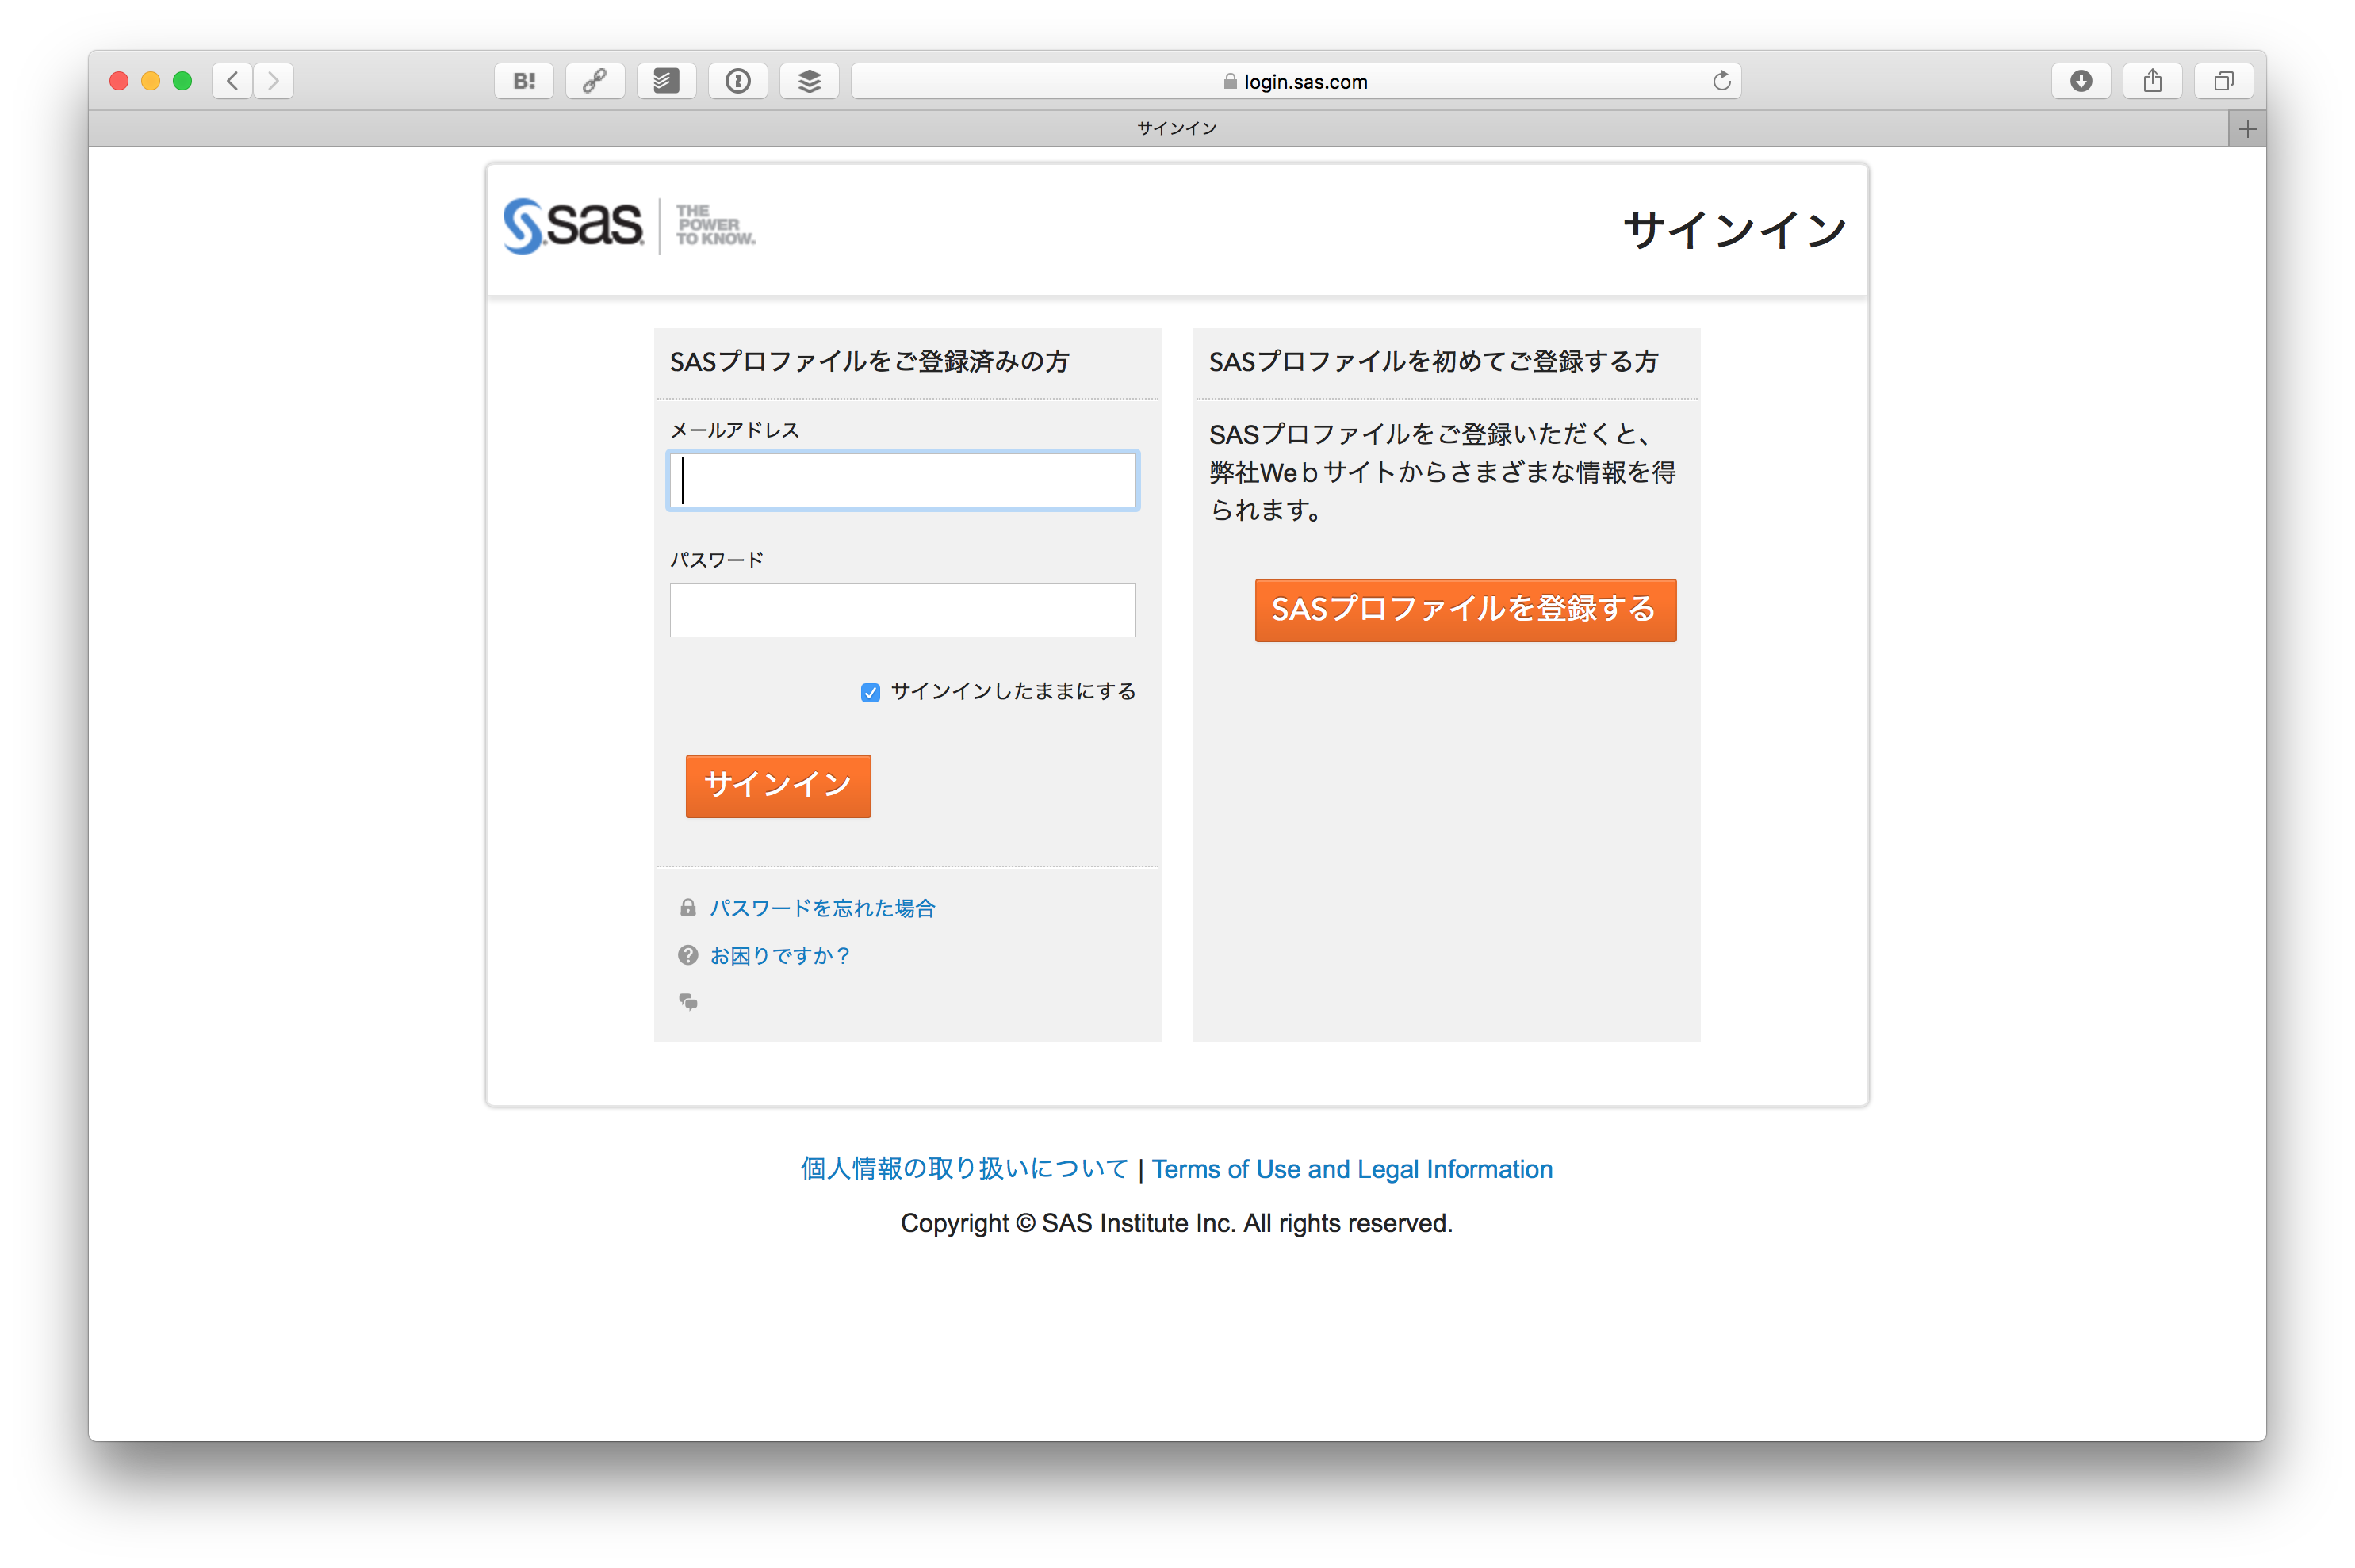
先ほど登録したSASプロファイルのID、パスワードでログインします。
ログインすると SAS® Viya® Developer Trial の画面に戻ってきますが、今回はプロファイルの内容が入力されているはずです。一番下にある Sign me upボタンをクリックします。
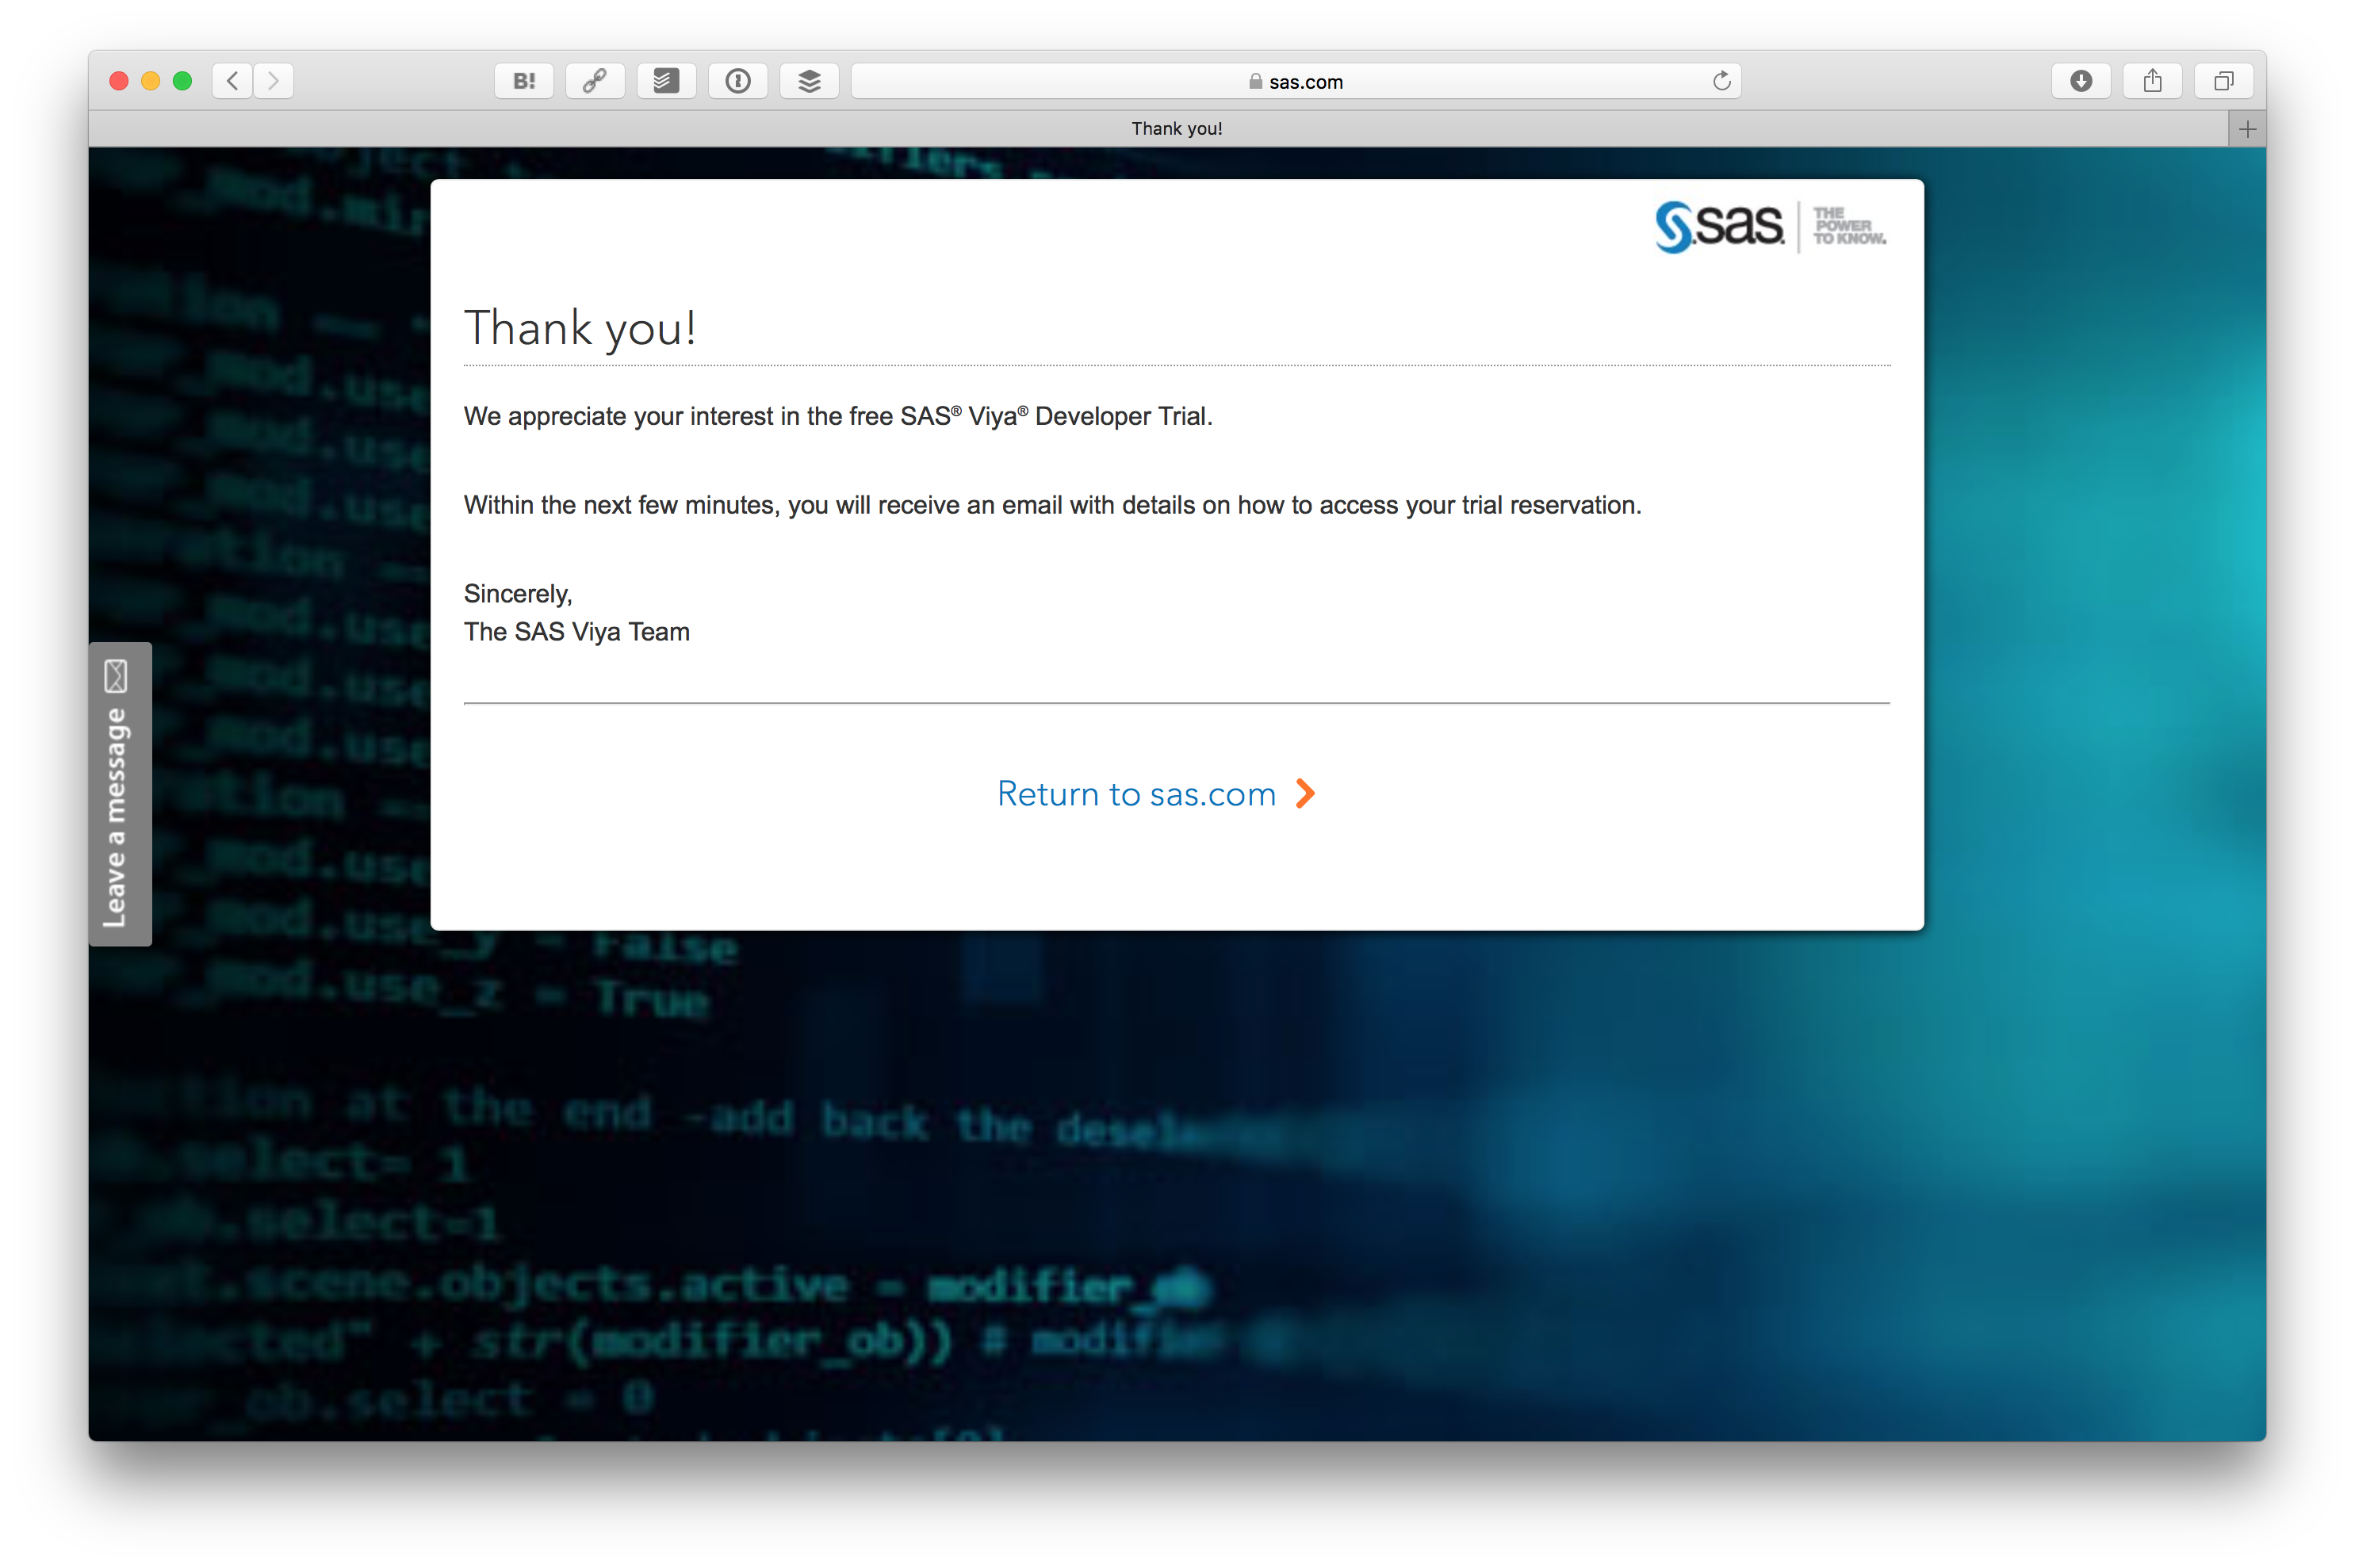
これで SAS® Viya® Developer Trial の申し込みが終わりました。数分後にメールが送られてきます。
送られてきたメールにある Log in to your Trial Portal のリンクをクリックします。

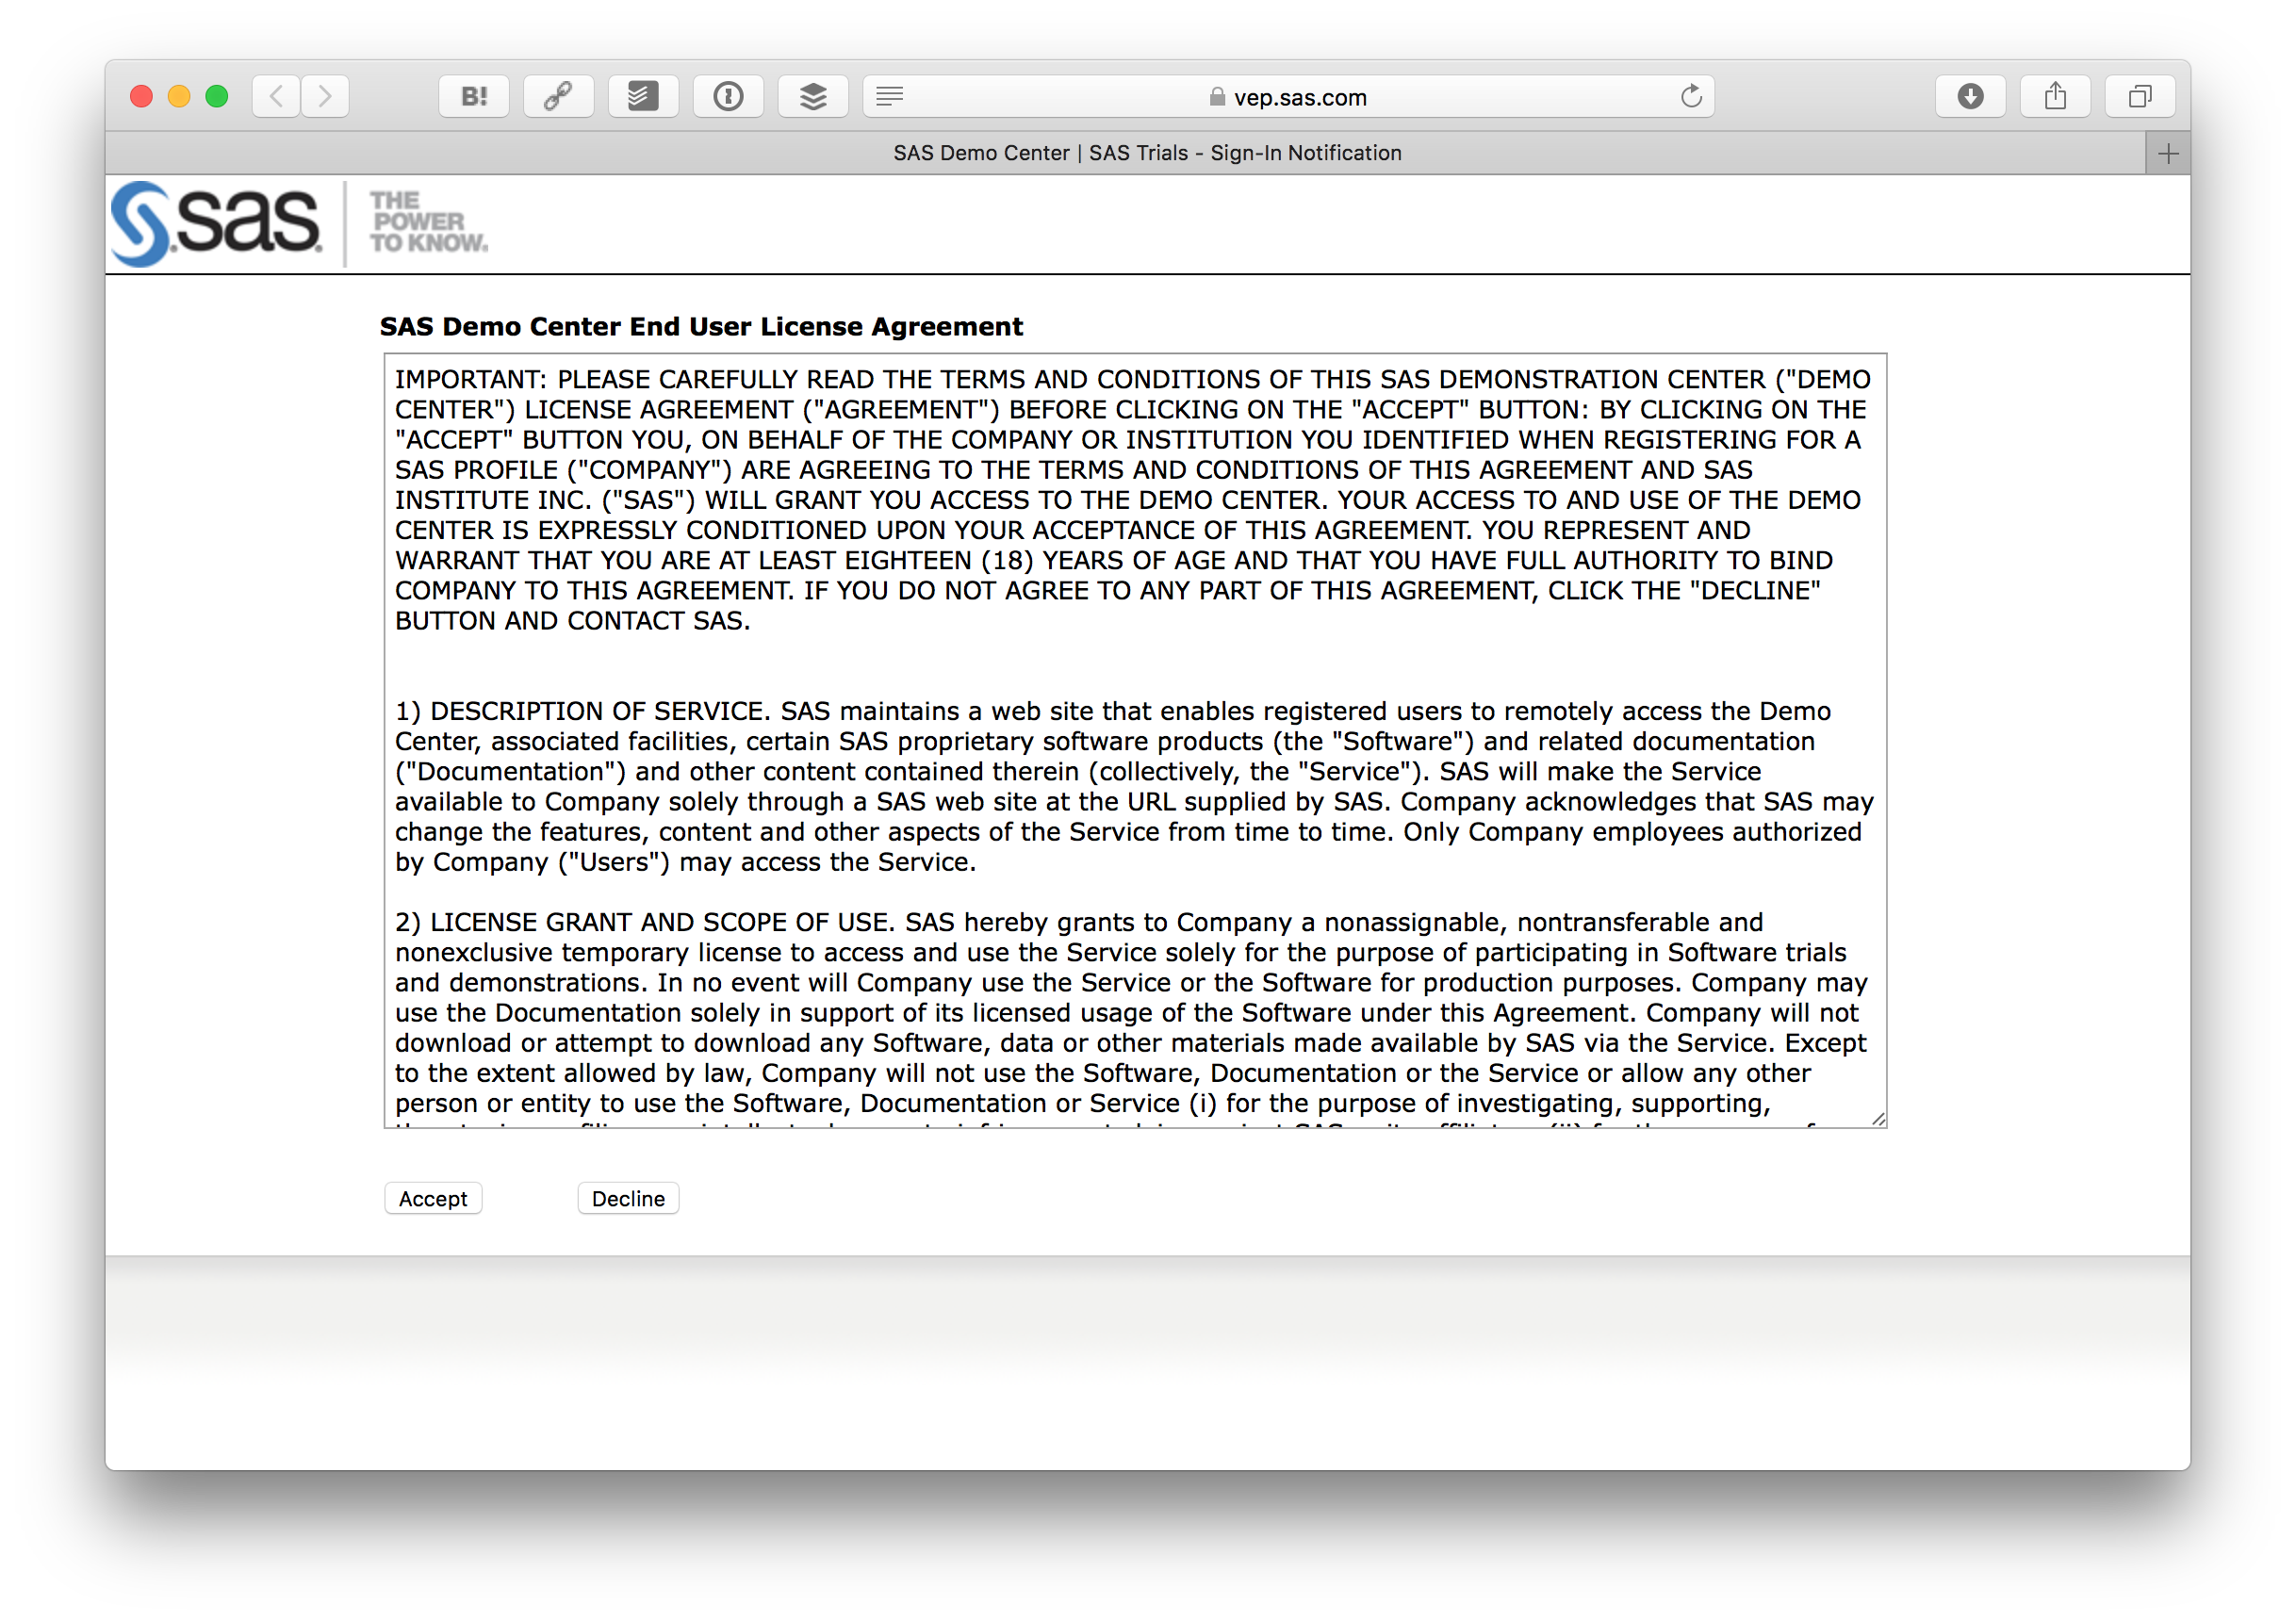
利用規約が表示されますので、問題なければAcceptボタンを押します。
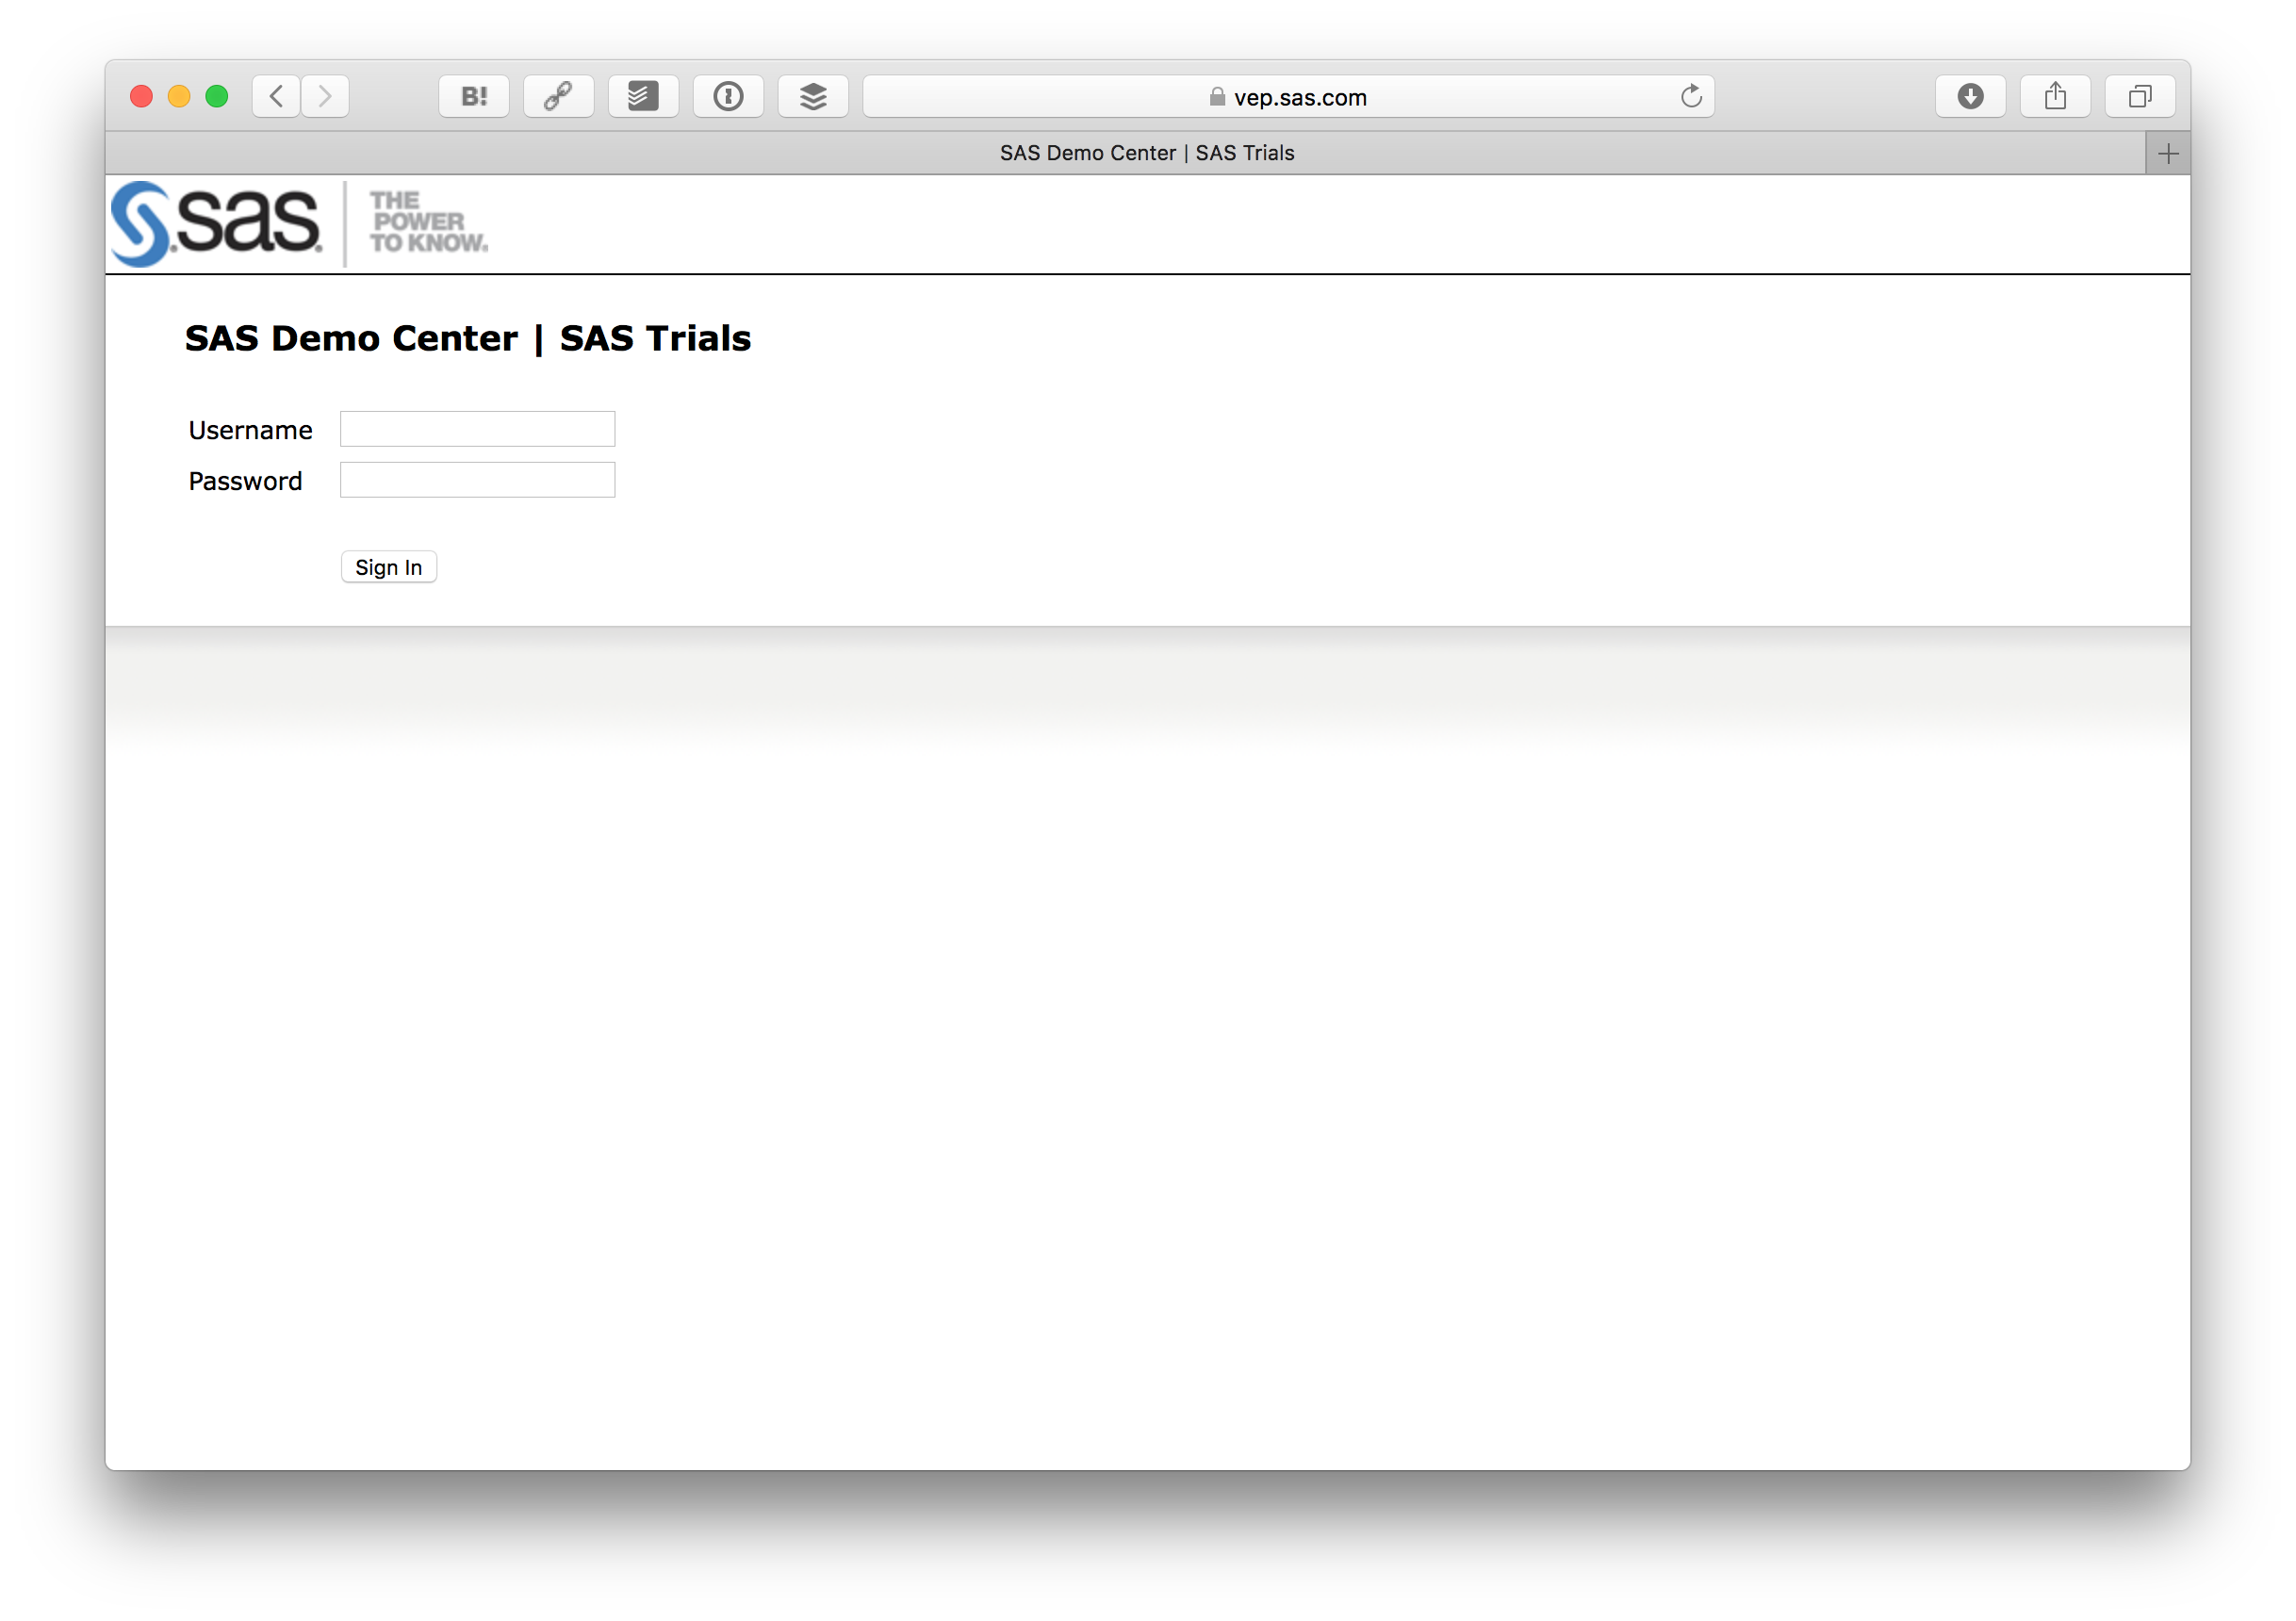
そうするとログインフォームが出るので、先ほど登録したID、パスワードでログインします。
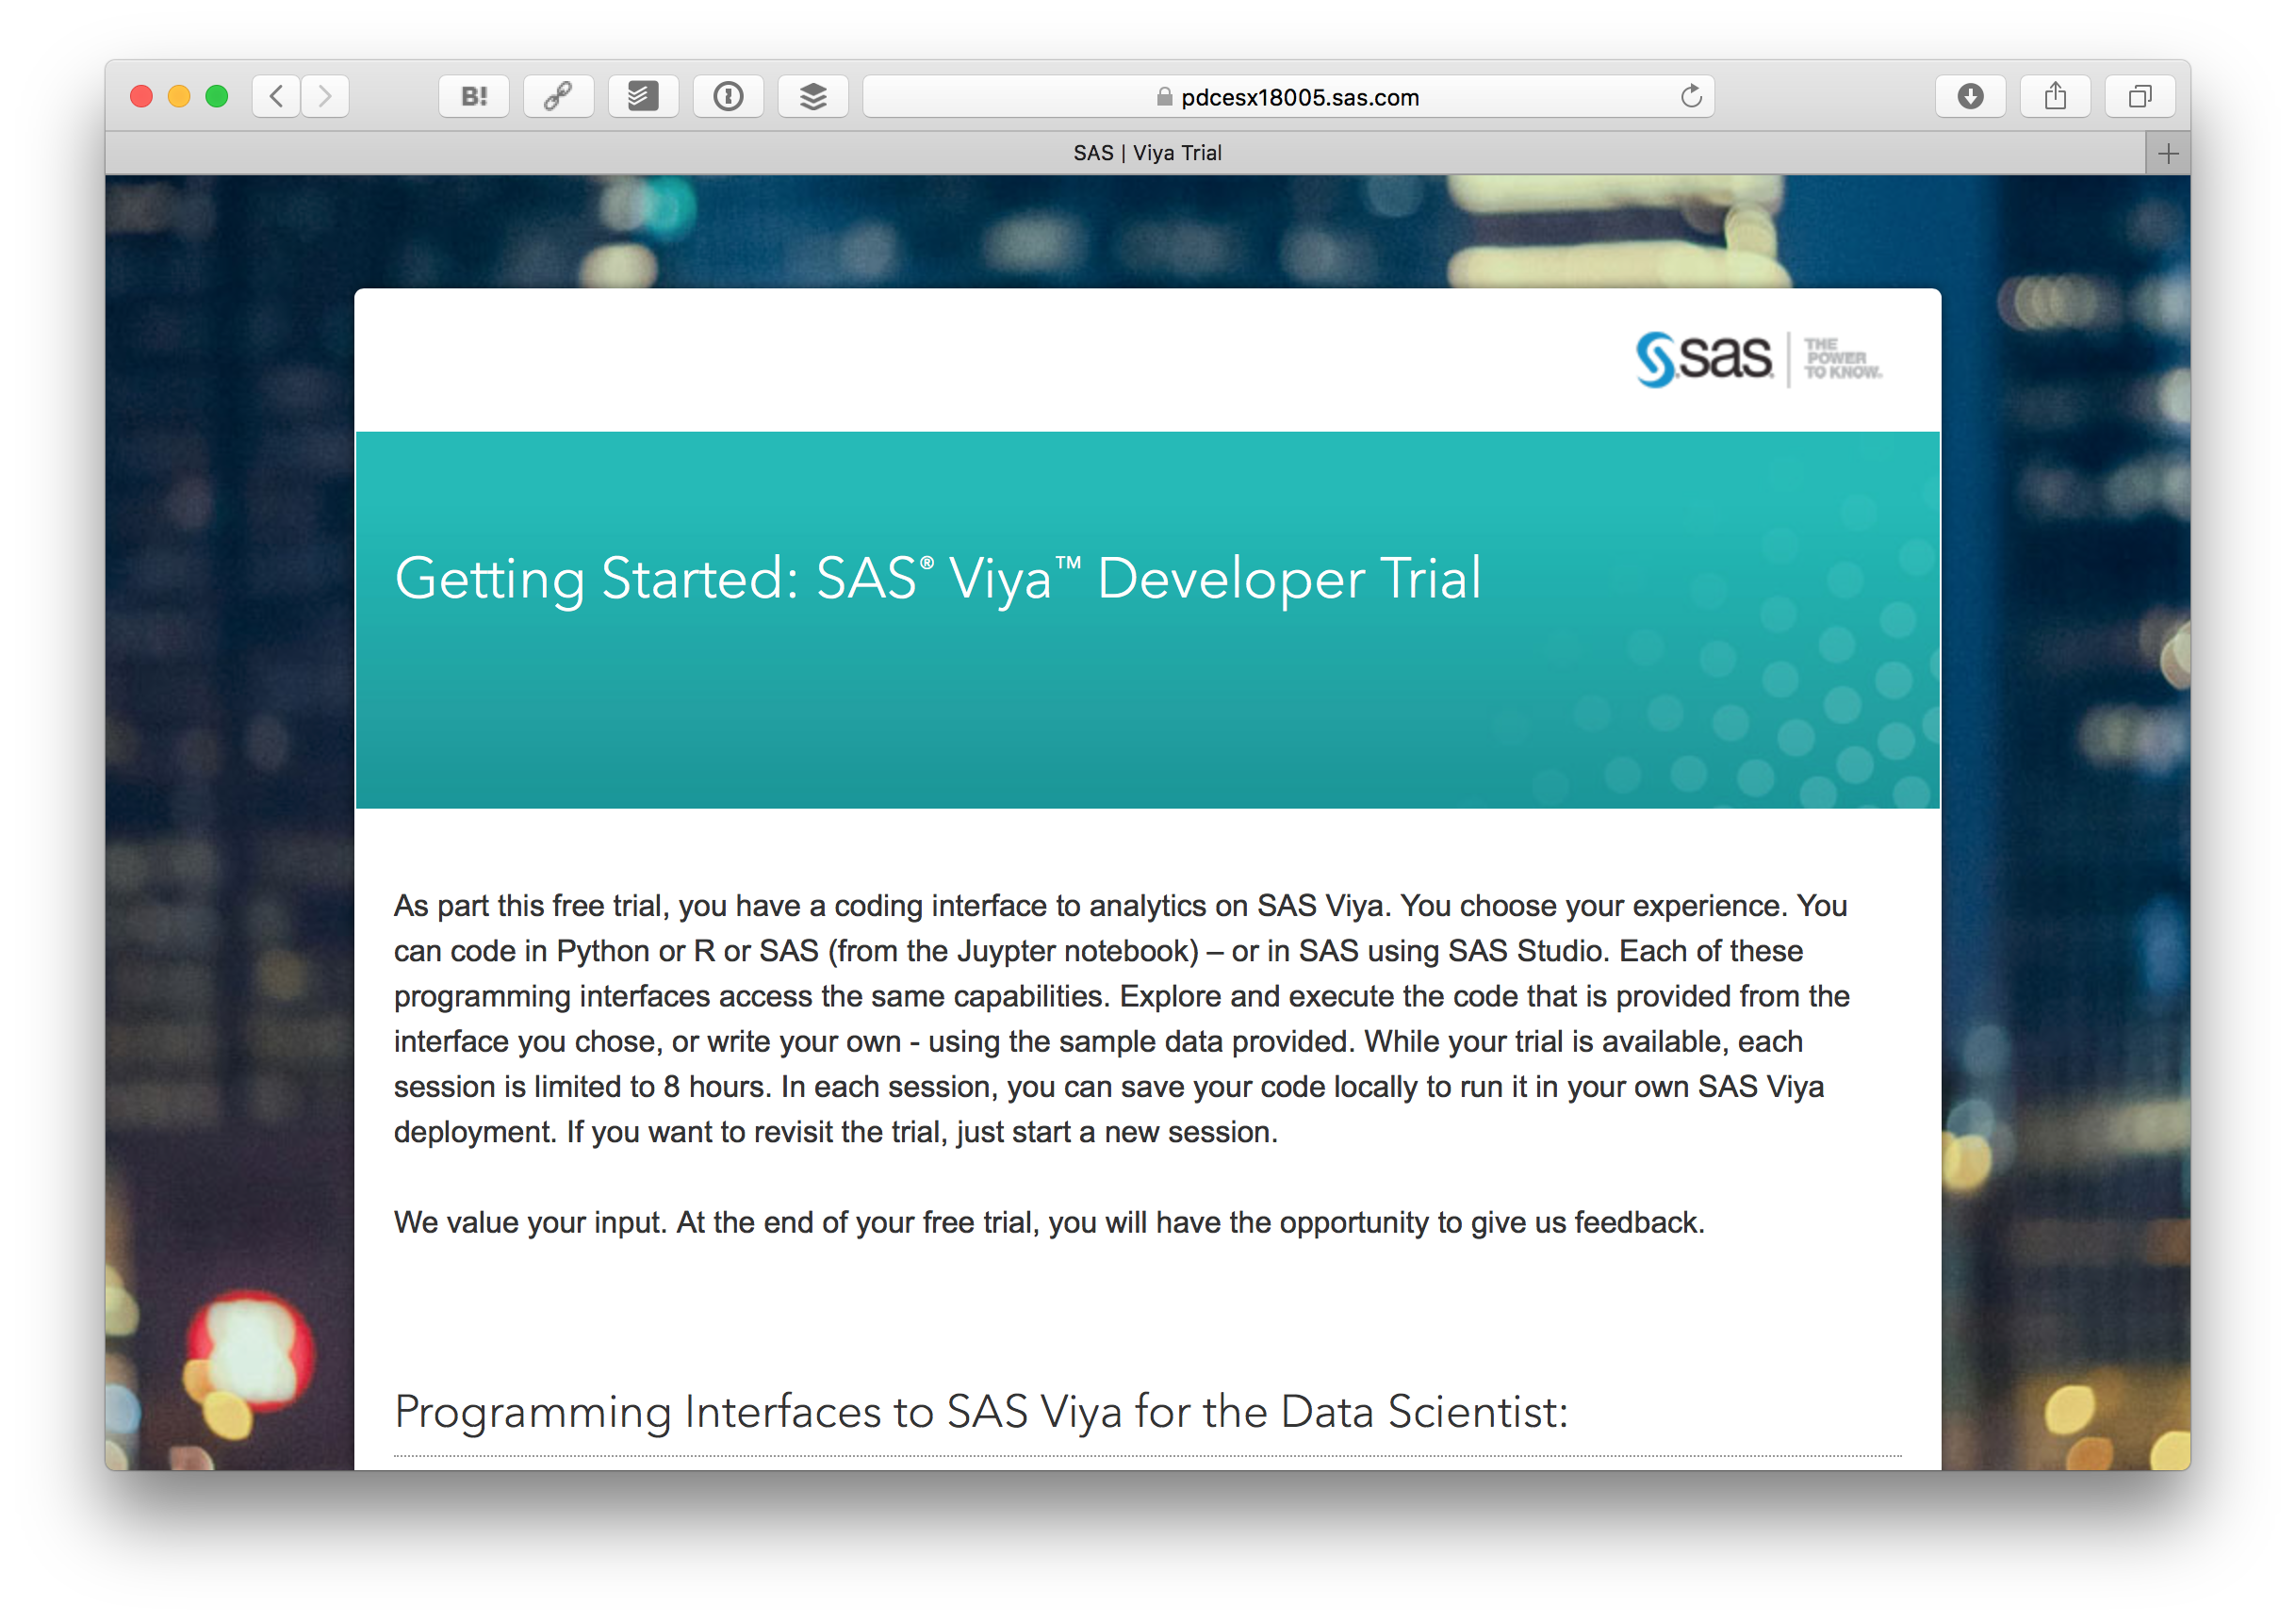
ログインすると Getting Started: SAS® Viya™ Developer Trial が表示されます。
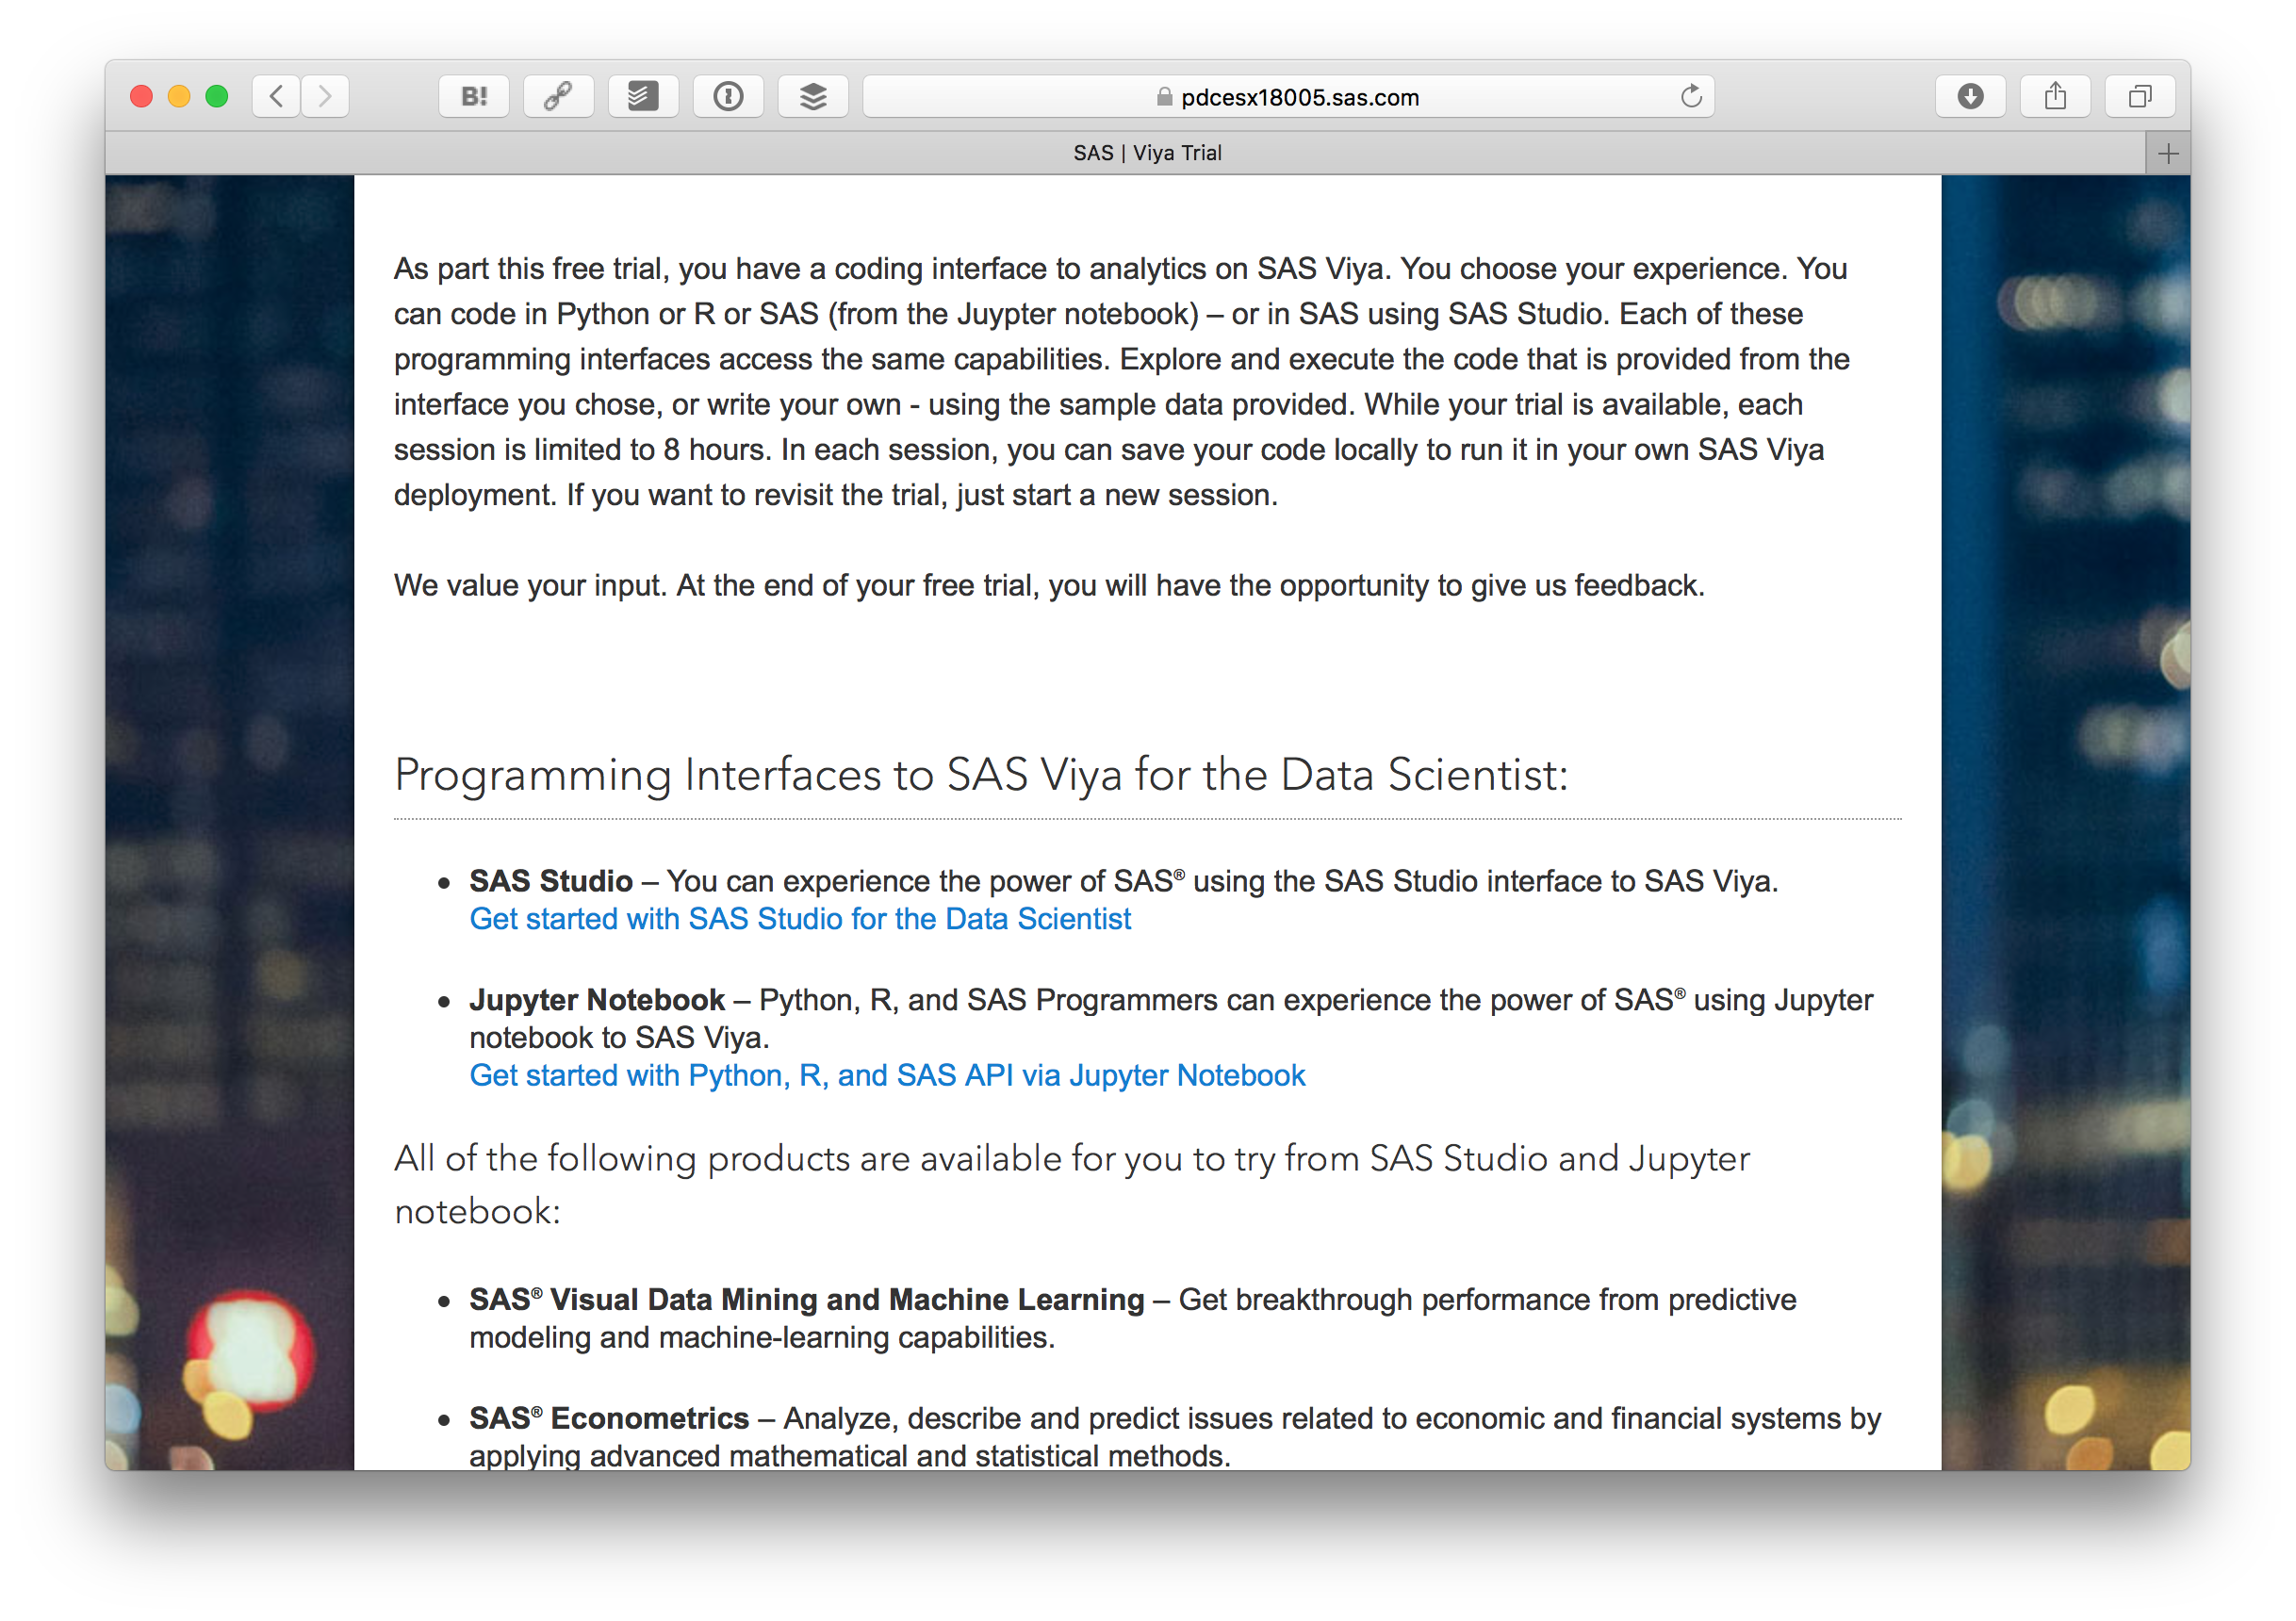
下の方にある Get started with Python, R, and SAS API via Jupyter Notebook をクリックします。
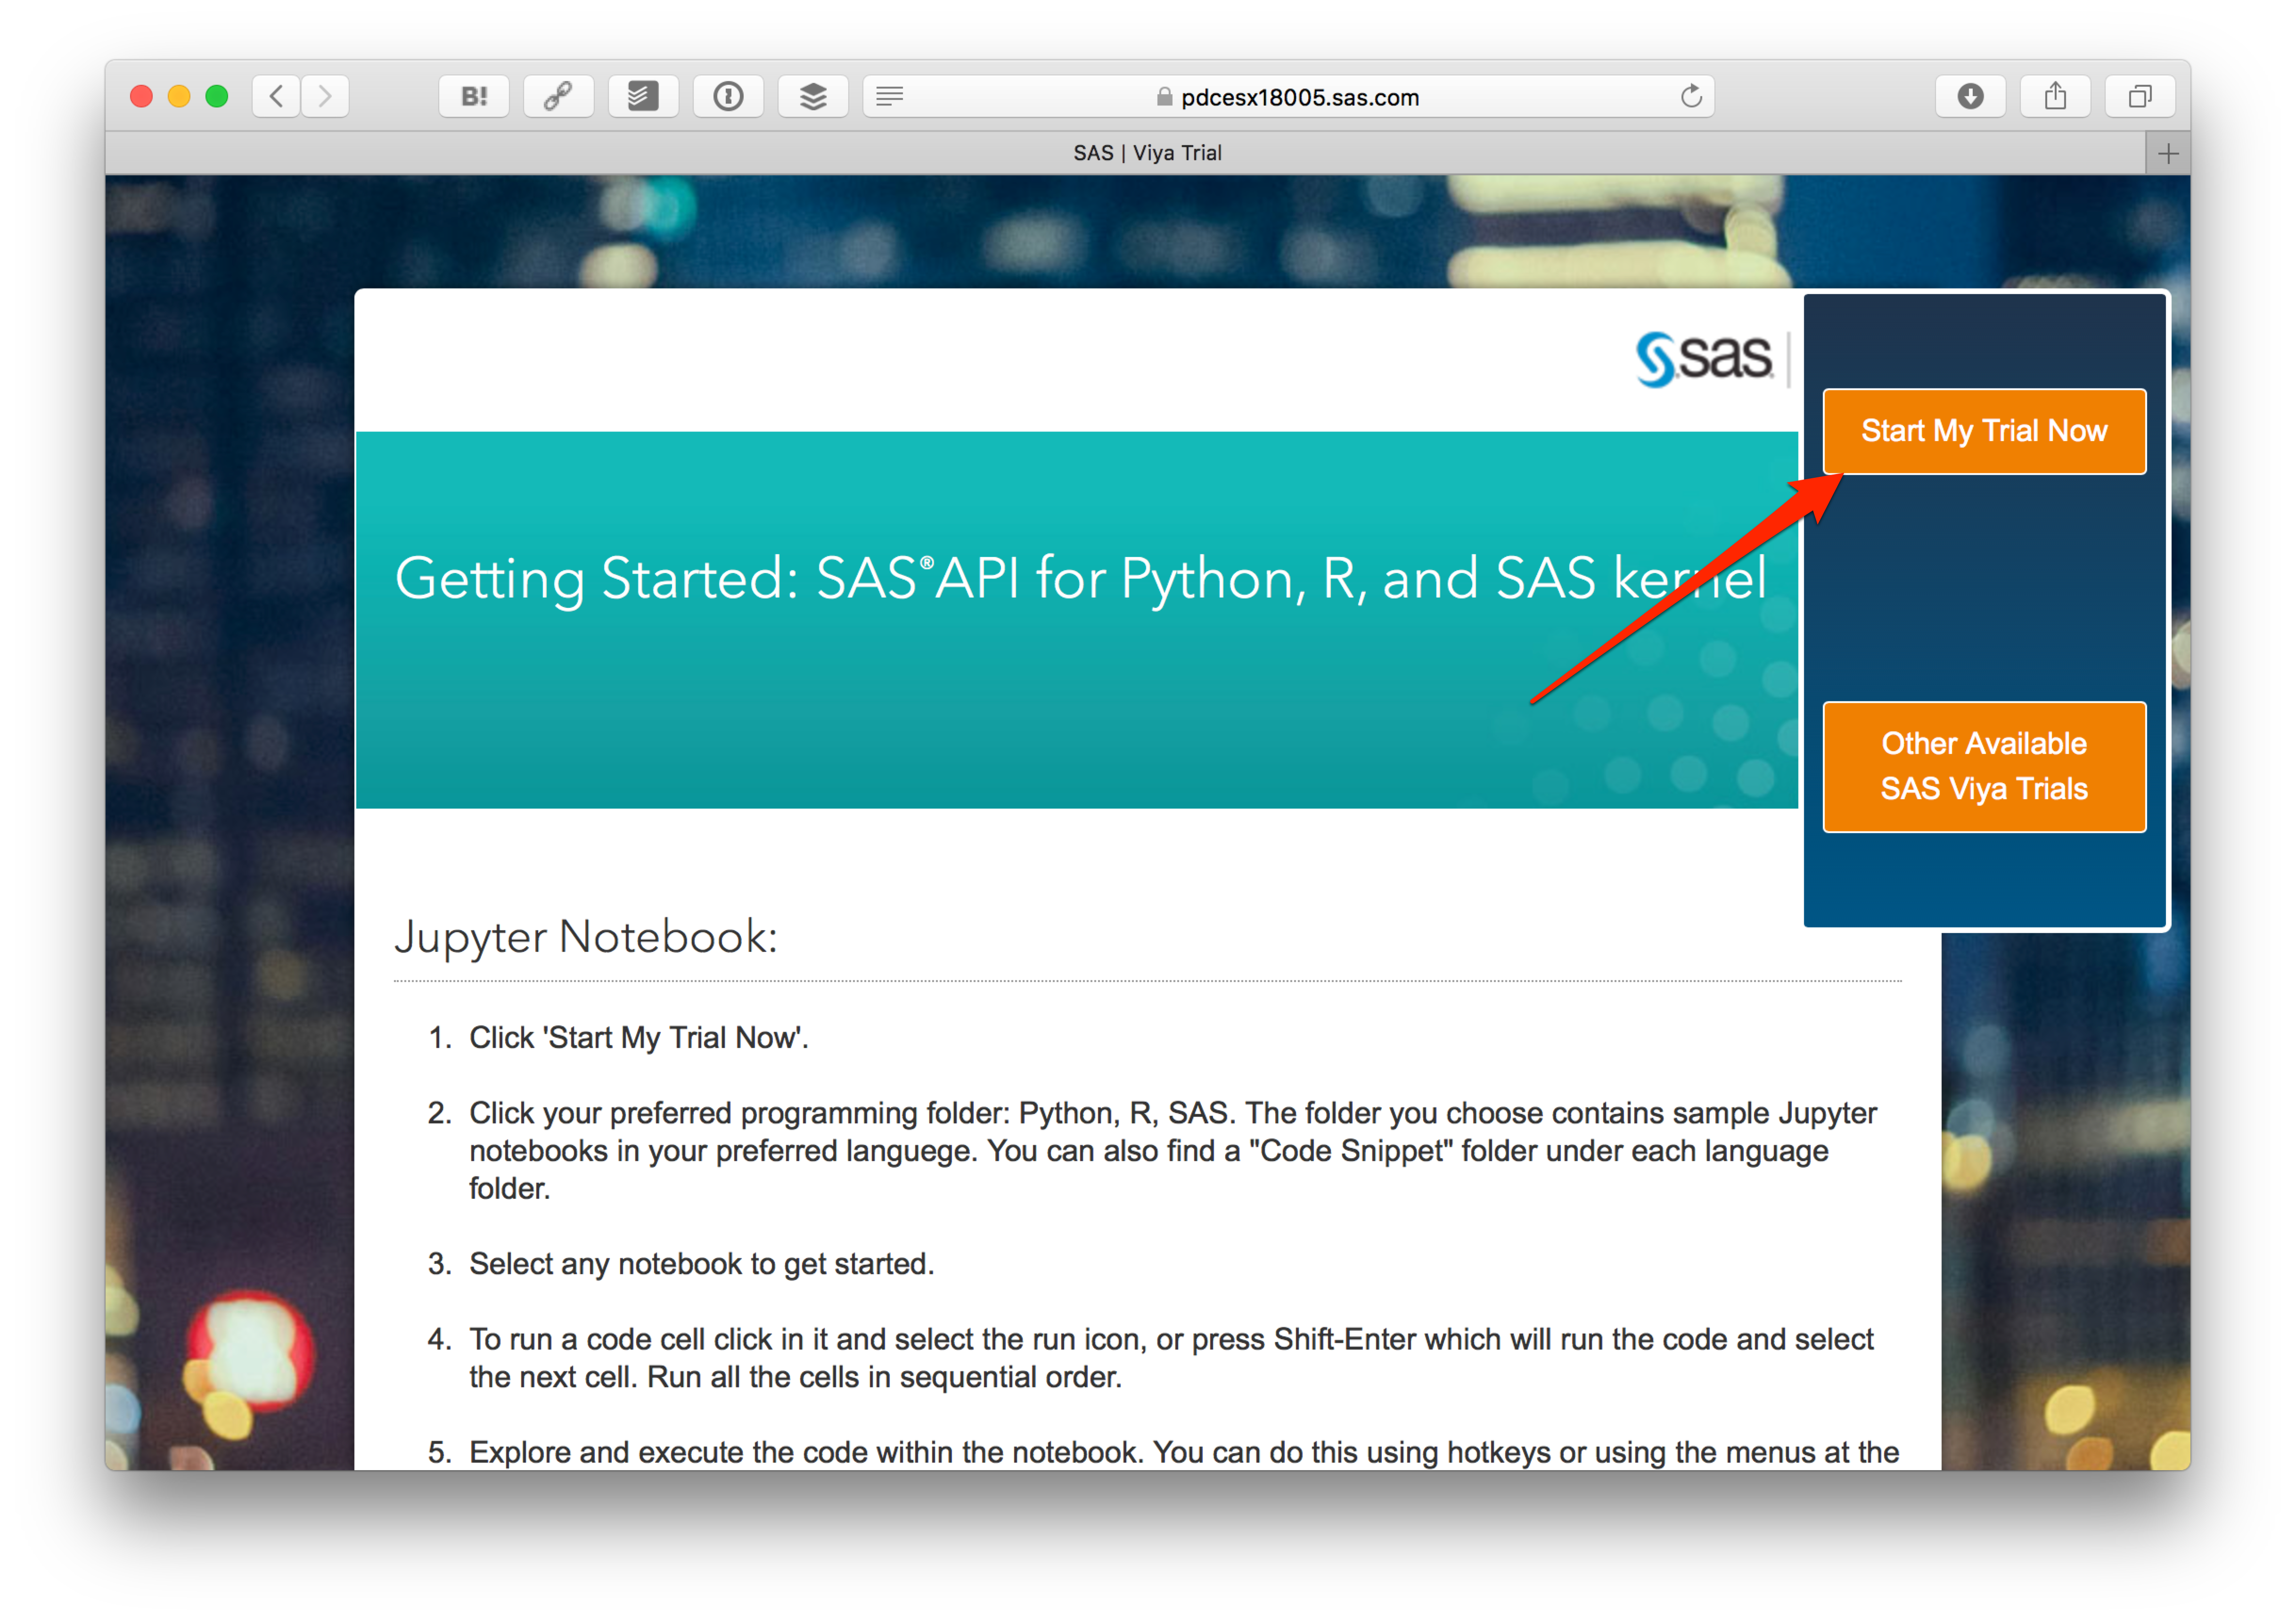
さらに Start My Trial Now をクリックします。
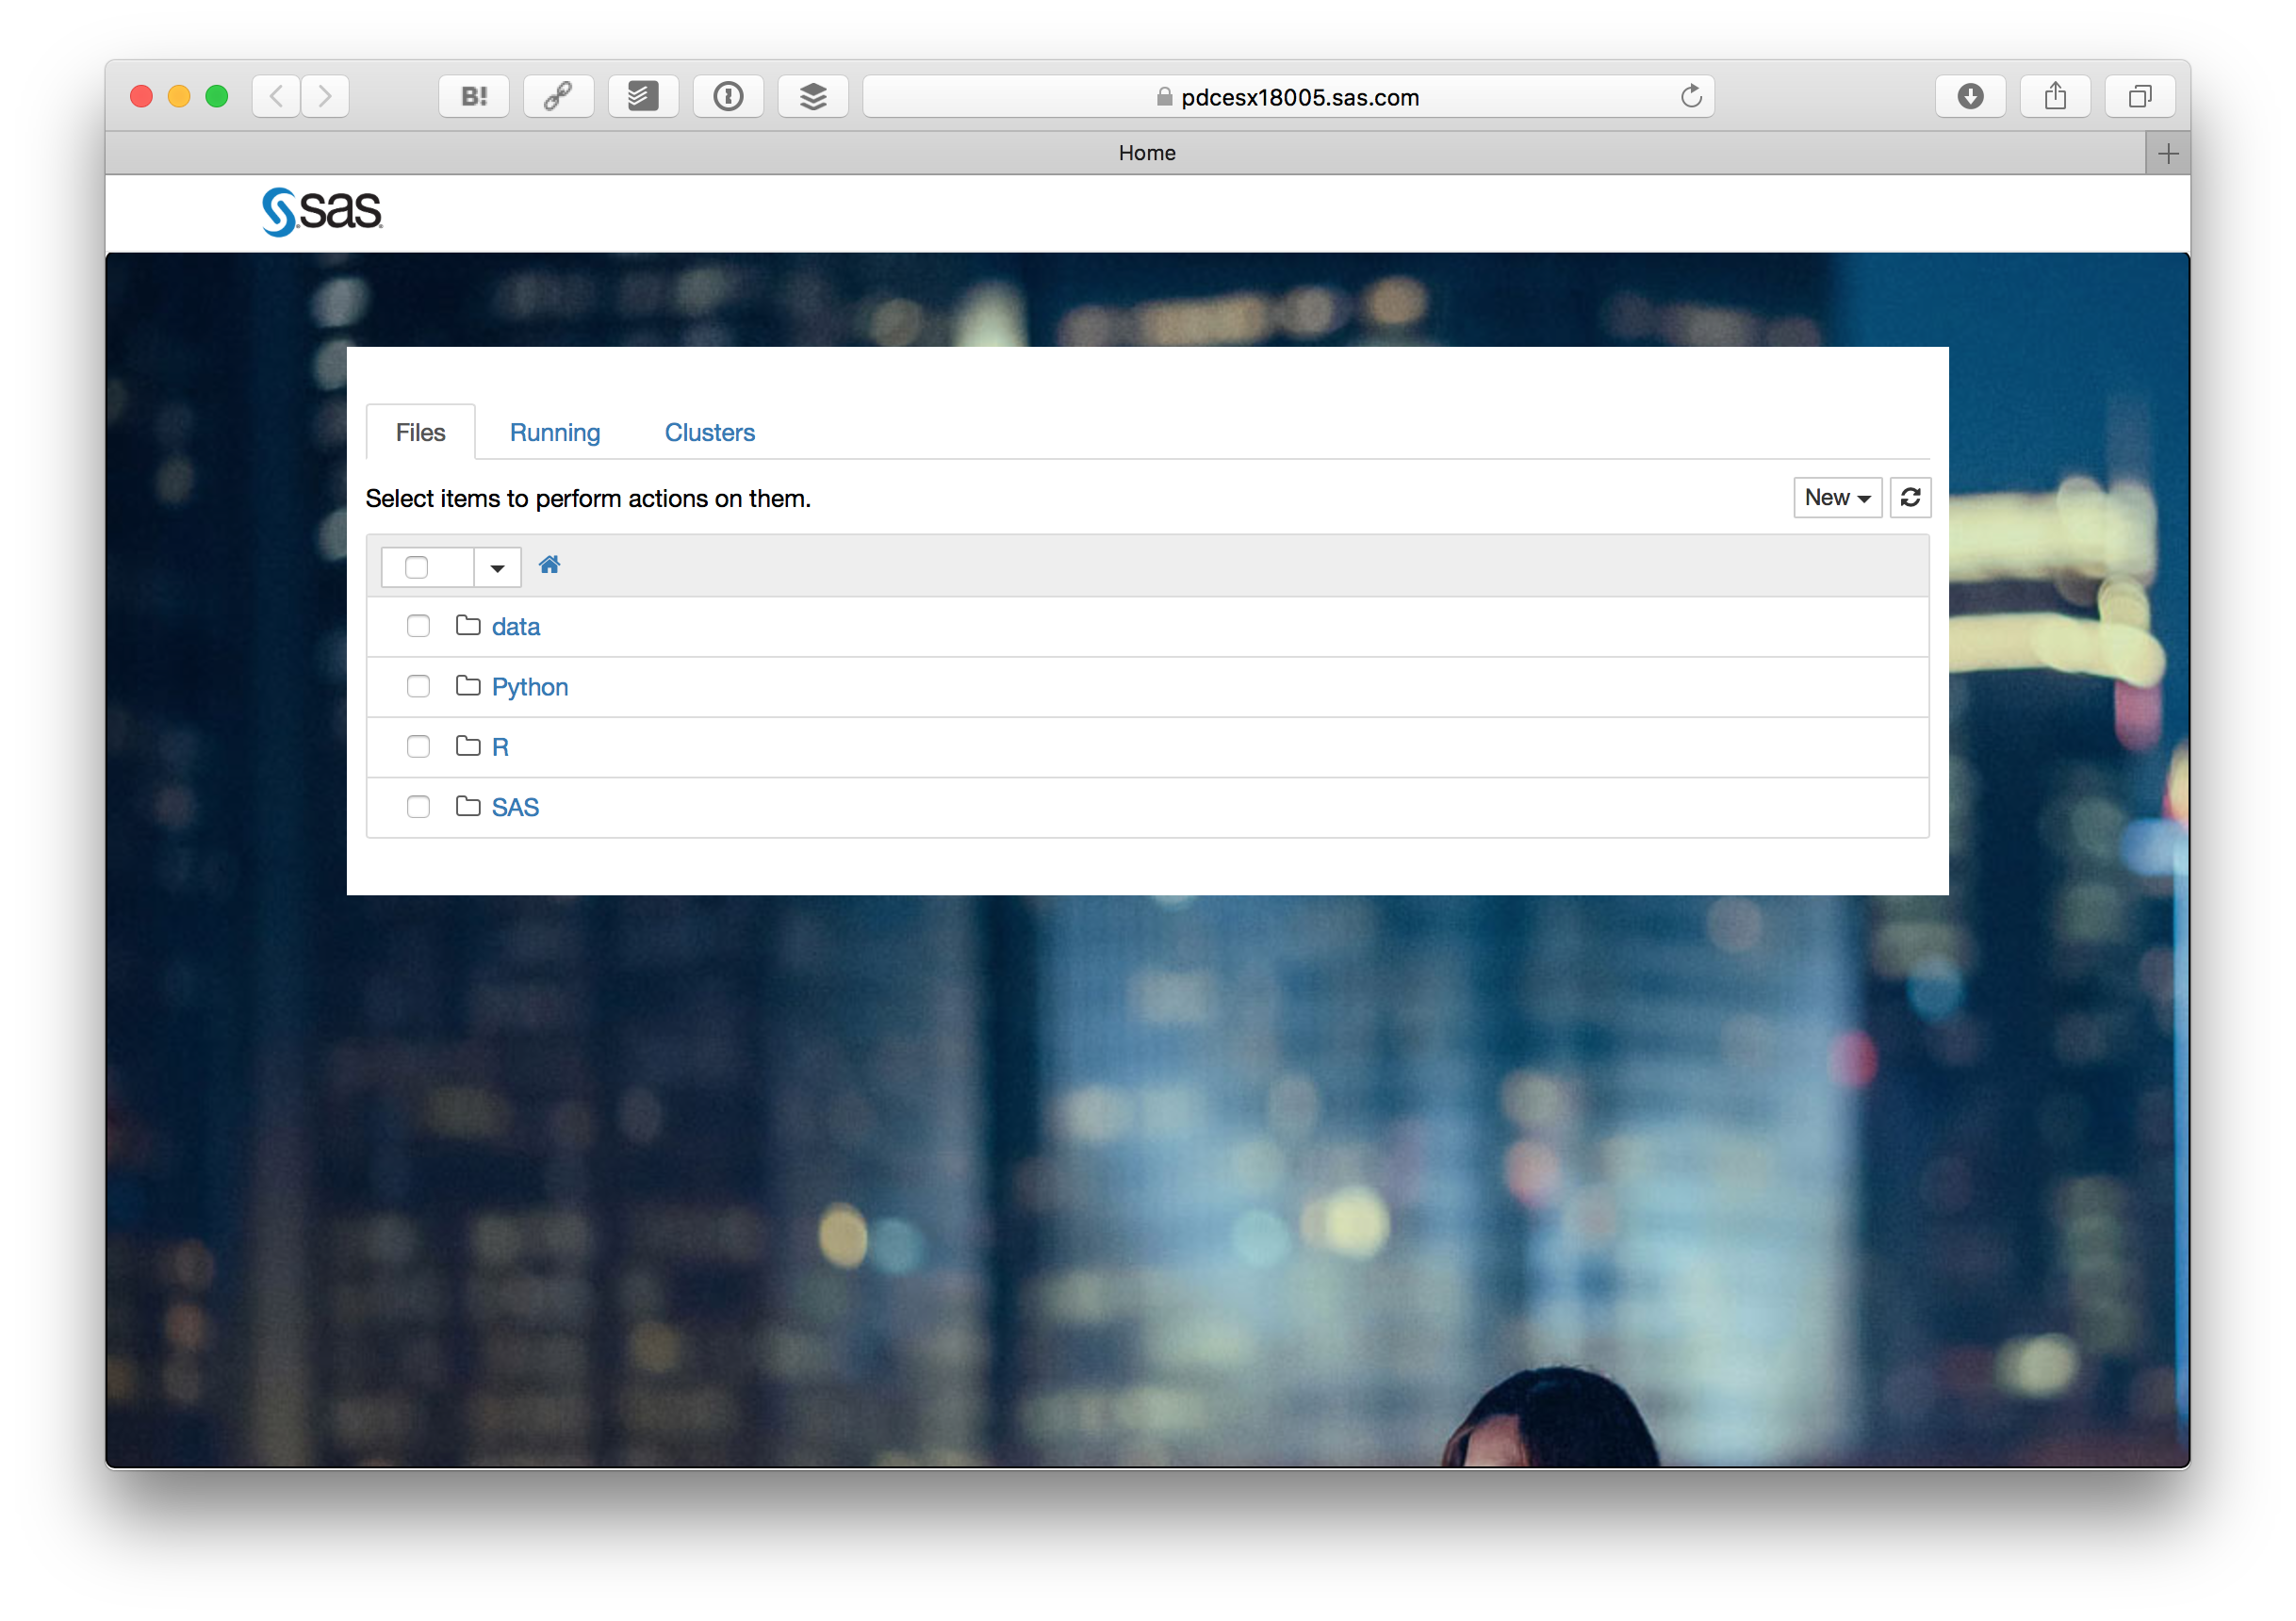
そうすると見慣れたJupyter Notebookの画面が出ます。Pythonフォルダの中にある FactorizationMachineViya.ipynb をクリックします。
ここからは FactorizationMachineViya.ipynb に書かれている内容の意訳です。英語の後に日本語を参考として載せています。
This demonstrates running a Factorization Machine in SAS Viya on the MovieLens movie reviews data set(このデモはSAS ViyaにてFactorization MachineをMovieLensの動画レビューデータセットを用いて実行します)
Initiate CAS Session(CASセッションの初期化)
from swat import *
from pprint import pprint
%matplotlib inline
from matplotlib import pyplot as plt
import pandas as pd
import sys
from swat.render import render_html

cashost='localhost'
casport=5570
casauth='~/.authinfo'
sess = CAS(cashost, casport, authinfo=casauth, caslib="casuser")
Load Data(データの読み込み)
indata1 = 'movlens10k'
indata2 = 'movlens10k_user99'
if not sess.table.tableExists(table=indata1).exists:
    indata1 = sess.upload_file("../data/movlens10k.sas7bdat", casout={"name":indata1})
    indata2 = sess.upload_file("../data/movlens10k_user99.sas7bdat", casout={"name":indata2})
Model and Score(モデルとスコア)
sess.loadactionset(actionset="factmac")
sess.loadactionset(actionset="astore")

# /************************************************************************/
# /* Modeling:                                                            */
# /* The Factorization Machine will run with the following settings:      */
# /*   The optimization will stops after 20 iterations                    */
# /*   The model will have 5 factors                                      */
# /*   The optimization learning step is 0.15                             */
# /************************************************************************/
# /************************************************************************/
# /* モデリング:                                                            */
# /* Factorization Machineは以下の設定で実行されます:                          */
# /*   最適化を20回、反復して実行します                                        */
# /*   モデルには5つの要素があります                                           */
# /*   最適化学習ステップは0.15                                               */
# /************************************************************************/
movlens_train = sess.factmac.factmac(
  table={"name":"movlens10k"},
  inputs=[{'name':'user'},{'name':'item'}],
    nominals=[{'name':'user'},{'name':'item'}],
  target="rating",
  seed=12345,
  maxIter=30,
  nFactors=10,
  learnStep=0.15,
  id={"user", "item", "rating"},
  outModel={"name":"factors_out", "replace":True},
  savestate={"name":"fm_astore_model", "replace":True}
)


# Score using ASTORE(ASTOREを使ったスコア)
# /* Scoring the movlens dataset for user 99 based on the model developed */
# /* 開発されたモデルに基づいてユーザー99のMovielensデータセットをスコアリングします */

sess.astore.score(
  table={"name":"movlens10k_user99"},
  rstore={"name":"fm_astore_model"},
  out={"name":"movlens10k_user99_scored", "replace":True}
)
factors = sess.CASTable('factors_out')
factors.head(40)
Summary of scored table
out = sess.summary(table="movlens10k_user99_scored")
out
scores = sess.CASTable('movlens10k_user99_scored')
scores.head(40)
View Model Information(モデル情報の表示)
r = movlens_train
render_html(r)
Plot predicted vs actual for user 99(予想されるプロットとユーザー99の実際のプロット)
plot_tbl=sess.CASTable("movlens10k_user99_scored")
plot_tbl.where="rating>0.0"

allRows=20000  # Assuming max rows in reviews_user99_scored table is <= 20,000
               # reviews_user99_scoredテーブルは2万行以下と仮定します
plot_df=plot_tbl.fetch(to=allRows)['Fetch']

plt.figure()
plt.scatter(plot_df["rating"], plot_df["P_rating"])
plt.xlabel("Actual Rating")
plt.ylabel("Predicted Rating")
plt.title("Scored Ratings for User 99")
plt.show()
plot_tbl.head(20)
ここまでの内容が FactorizationMachineViya.ipynb で書かれているデモになります。Jupyter Notebookなので、Webブラウザ上でコードを実行して結果を確認できます。ぜひSAS Viyaで体験してみてください。