この記事はTwitter Dataの分析のtrend分析編である。このseriesは後で深めていく。初めての記事なので、簡単にTwitter Dataの分析をしたら、詳しくこのcaseを説明します。日本語がきついから、英語にします。Git Repository
Why Analyze Twitter Data?
Twitter data analysis is used in a wide range of areas including but not restricted to analyzing the mentions of each political party in an election, detecting the reactions to the introduction of a new product, understanding the geographical scope of discussion of a news story.
How to analyze twitter data?
Twitter data can be retrieved from twitter API. Data can be wrangled and manipulated according to the purpose of analysis. For example, if we need to get insights on a certain product from twitter data, there're a few strategies we can apply:
- Collect mentions of the product and identify if people are talking about it positively.
press - Examine the size of the retweet network mentioning the product.
- Analyzing the geographical penetration of users mentioning the product.
press
Collecting data via twitter API
This is a slightly complicated procedure if it's your first time to use twitter API. Here I'm going to explain how to collect data through twitter API.
- Log in your twitter account
- Apply for a developer account. Apply Here!
- Create a new application.
- Go to the application and find keys and tokens. (We'll need them later for authentication purposes.)
Authentication
from tweepy import OAuthHandler
from tweepy import API
import json

consumer_key = ...
consumer_secret = ...
access_token = ...
access_token_secret = ...
# Consumer key authentication
auth = OAuthHandler(consumer_key, consumer_secret)

# Access key authentication
auth.set_access_token(access_token, access_token_secret)

# Set up the API with the authentication handler
api = API(auth)
Getting the trend
Here I'm gonna use UK as an example. Information regarding WOE ID can be found here.
UK_WOE_ID = 23424975

UK_trends = api.trends_place(UK_WOE_ID)

trends = json.loads(json.dumps(UK_trends, indent=1))
Local and global thought patterns
# Loading json module
import json

# Load WW_trends and US_trends data into the the given variables respectively
WW_trends = json.loads(open('datasets/WWTrends.json').read())
US_trends = json.loads(open('datasets/USTrends.json').read())

# Inspecting data by printing out WW_trends and US_trends variables
print(WW_trends)
print(US_trends)
Prettifying the output
# Pretty-printing the results. First WW and then US trends.

print("WW trends:")
print(json.dumps(WW_trends, indent=1))

print("\n", "US trends:")
print(json.dumps(US_trends, indent=1))
Finding common trends
# Extracting all the WW trend names from WW_trends
world_trends = set([trend['name'] for trend in WW_trends[0]['trends']])

# Extracting all the US trend names from US_trends
us_trends = set([trend['name'] for trend in US_trends[0]['trends']])

# Getting the intersection of the two sets of trends
common_trends = world_trends.intersection(us_trends)

# Inspecting the data
print(world_trends, "\n")
print(us_trends, "\n")
print (len(common_trends), "common trends:", common_trends)
Exploring the hot trend
# Loading the data
tweets = json.loads(open('datasets/WeLoveTheEarth.json').read())

# Inspecting some tweets
tweets[0:2]
Digging deeper
# Extracting the text of all the tweets from the tweet object
texts = [tweet['text'] for tweet in tweets]

# Extracting screen names of users tweeting about #WeLoveTheEarth
names = [user_mention['screen_name'] for tweet in tweets for user_mention in tweet['entities']['user_mentions']]

# Extracting all the hashtags being used when talking about this topic
hashtags = [hashtag['text'] for tweet in tweets for hashtag in tweet['entities']['hashtags']]

# Inspecting the first 10 results
print (json.dumps(texts[0:10], indent=1),"\n")
print (json.dumps(names[0:10], indent=1),"\n")
print (json.dumps(hashtags[0:10], indent=1),"\n")
Frequency analysis
# Importing modules
from collections import Counter

# Counting occcurrences/ getting frequency dist of all names and hashtags
for item in [names, hashtags]:
    c = Counter(item)
    # Inspecting the 10 most common items in c
    print (c.most_common(10), "\n")
Activity around the trend
# Extracting useful information from retweets
retweets = [(tweet['retweet_count'],
             tweet['retweeted_status']['favorite_count'],
             tweet['retweeted_status']['user']['followers_count'],
             tweet['retweeted_status']['user']['screen_name'],
             tweet['text']) for tweet in tweets if 'retweeted_status' in tweet]
A table that speaks a 1000 words
# Importing modules
import matplotlib.pyplot as plt
import pandas as pd

# Create a DataFrame and visualize the data in a pretty and insightful format
df = pd.DataFrame(retweets, columns=['Retweets','Favorites', 'Followers', 'ScreenName', 'Text'])

df.style.background_gradient()
df = df.groupby(['ScreenName','Text','Followers']).sum().sort_values(by=['Followers'], ascending= False)
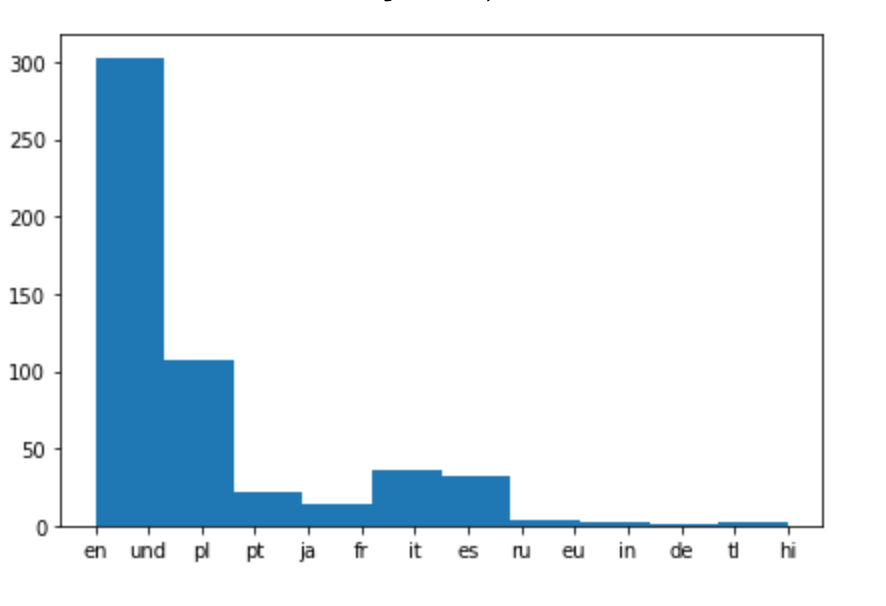
Analyzing used languages
# Extracting language for each tweet and appending it to the list of languages
tweets_languages = []
for tweet in tweets:
    tweets_languages.append(tweet['lang'])

# Plotting the distribution of languages
%matplotlib inline
plt.hist(tweets_languages)
That's the end of our project. In the next project of this series we'll look into more complicated use of twitter API.