EC2のメモリ使用率は標準のメトリクスとしては取得されず、CloudWatchで確認するためには追加設定が必要となります。
手順は 公式ページ にまとまっていますが、全ての対象ディストリビューションが同じページに書いてあるので、Ubuntuで設定した手順を本ページにまとめておきます。
以下はそれぞれ、新規に起動したUbuntu 20.04インスタンスで確認した手順です。コマンドラインでインストールする方法と、SSMからインストールする方法があります。
1.コマンドラインでインストール
1-1. IAMロールを作成してアタッチ
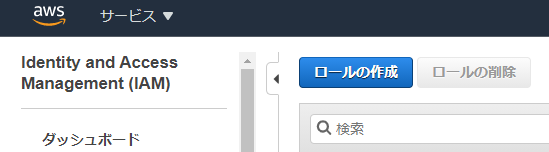
インストール前に、CloudWatchにメトリクスをPUTするためのロールを作成してインスタンスにアタッチする必要があります。コンソールの IAM → ロールから「ロールの作成」を選択。
 |
|---|
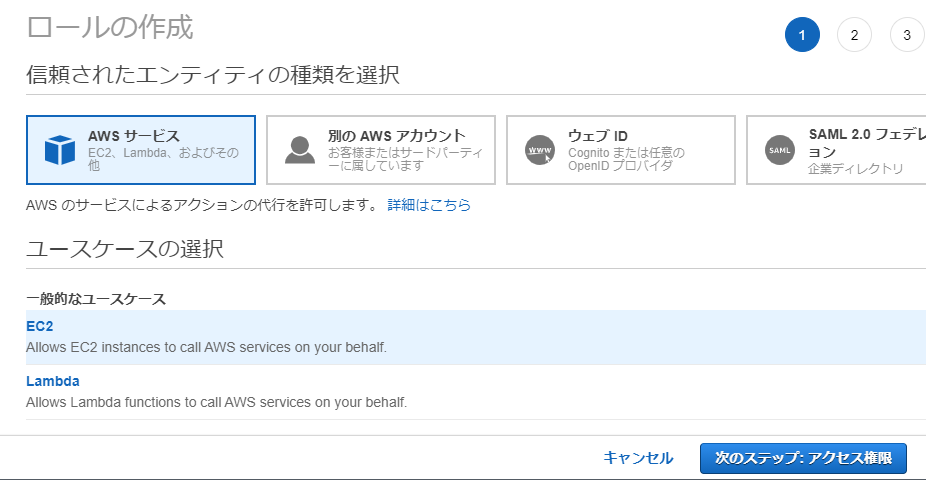
AWSサービス、EC2を選択して次のステップに進む。
 |
|---|
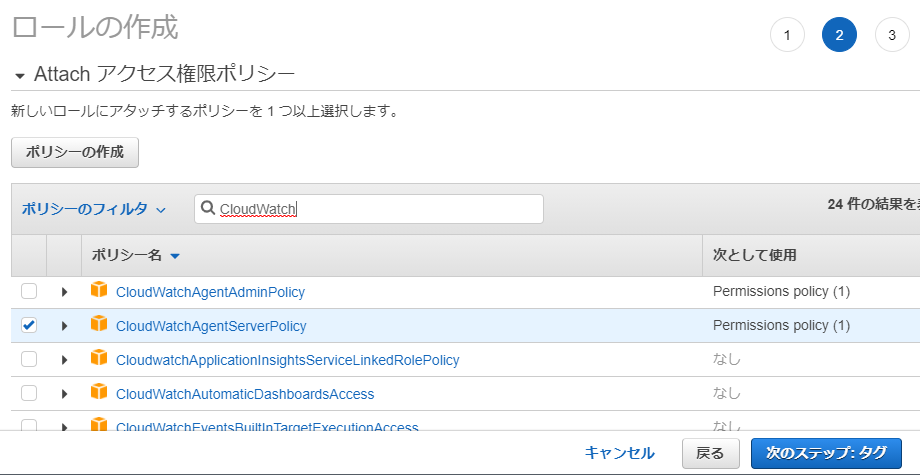
ポリシーの選択で、CloudWatchAgentServerPolicyにチェックを入れて次のステップに進む。
 |
|---|
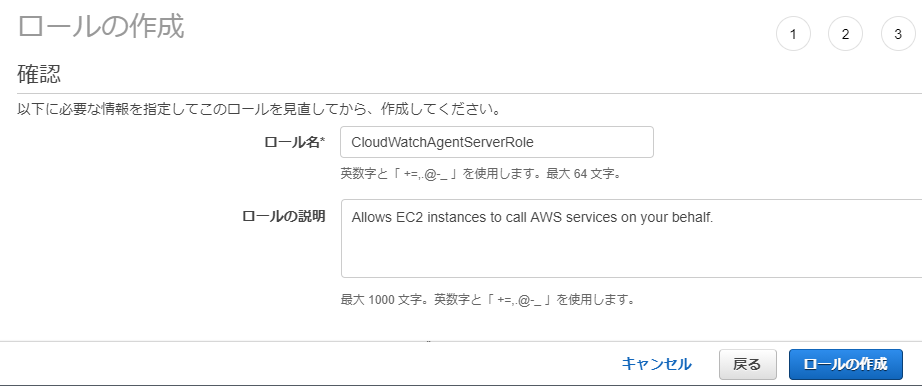
その次の画面はタグの入力なので、任意のタグを入力して次に進みます。最後に名前( CloudWatchAgentServerRole 等)を入力してロールを作成します。
 |
|---|
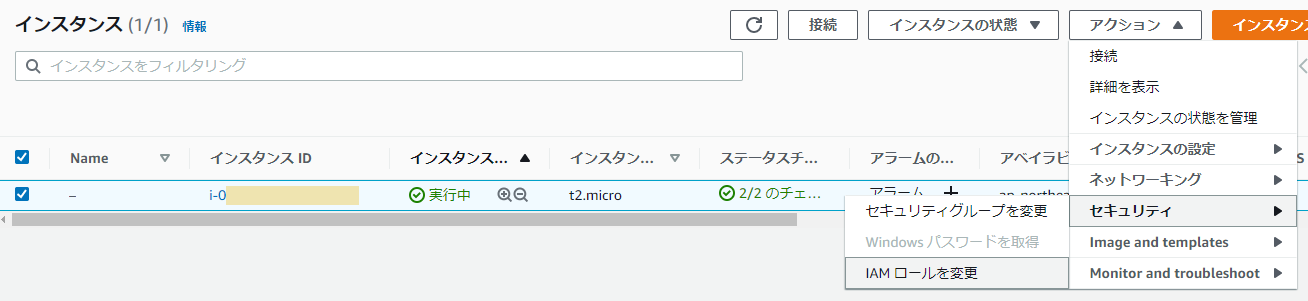
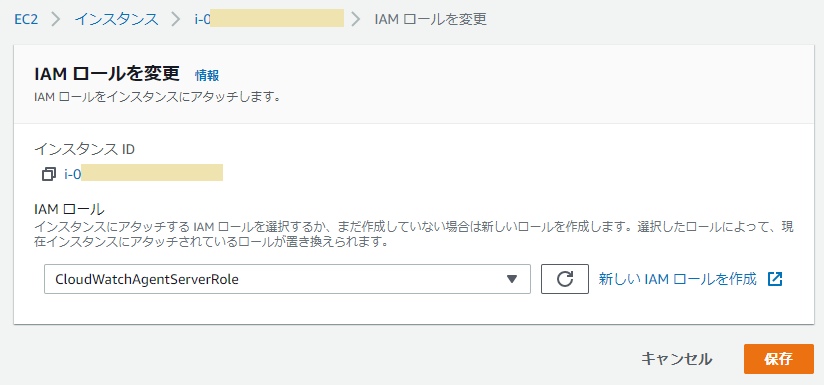
作成後、ロールをインスタンスにアタッチします。インスタンスメニューから アクション → セキュリティ → IAMロールを変更 を選択。
 |
|---|
先ほど作成したロールを選択して保存すれば完了となります。
 |
|---|
1-2.インストールと確認
あとはインスタンス上でのコマンド実行になります。
まずインストーラをダウンロードしてインストール
$ sudo wget https://s3.amazonaws.com/amazoncloudwatch-agent/ubuntu/amd64/latest/amazon-cloudwatch-agent.deb

$ sudo dpkg -i -E ./amazon-cloudwatch-agent.deb
※東京リージョンは以下からのダウンロードでも可
https://s3.ap-northeast-1.amazonaws.com/amazoncloudwatch-agent-ap-northeast-1/ubuntu/amd64/latest/amazon-cloudwatch-agent.deb
次にウィザードを実行して設定ファイルを作成します。設定項目が多いですが、メモリ使用率を取得するのであればほとんどデフォルト設定(Enter)で先に進みます。変更したところ2箇所のみ★で注記を記載しています。
$ sudo /opt/aws/amazon-cloudwatch-agent/bin/amazon-cloudwatch-agent-config-wizard
=============================================================
= Welcome to the AWS CloudWatch Agent Configuration Manager =
=============================================================
On which OS are you planning to use the agent?
1. linux
2. windows
default choice: [1]:

Trying to fetch the default region based on ec2 metadata...
Are you using EC2 or On-Premises hosts?
1. EC2
2. On-Premises
default choice: [1]:

Which user are you planning to run the agent?
1. root
2. cwagent
3. others
default choice: [1]:

Do you want to turn on StatsD daemon?
1. yes
2. no
default choice: [1]:

Which port do you want StatsD daemon to listen to?
default choice: [8125]

What is the collect interval for StatsD daemon?
1. 10s
2. 30s
3. 60s
default choice: [1]:

What is the aggregation interval for metrics collected by StatsD daemon?
1. Do not aggregate
2. 10s
3. 30s
4. 60s
default choice: [4]:

Do you want to monitor metrics from CollectD?
1. yes
2. no
default choice: [1]:

Do you want to monitor any host metrics? e.g. CPU, memory, etc.
1. yes
2. no
default choice: [1]:

Do you want to monitor cpu metrics per core? Additional CloudWatch charges may apply.
1. yes
2. no
default choice: [1]:

Do you want to add ec2 dimensions (ImageId, InstanceId, InstanceType, AutoScalingGroupName) into all of your metrics if the info is avai                          lable?
1. yes
2. no
default choice: [1]:

Would you like to collect your metrics at high resolution (sub-minute resolution)? This enables sub-minute resolution for all metrics, b                          ut you can customize for specific metrics in the output json file.
1. 1s
2. 10s
3. 30s
4. 60s
default choice: [4]:

Which default metrics config do you want?
1. Basic
2. Standard
3. Advanced
4. None
default choice: [1]:

Current config as follows:
{
        ※設定内容の表示は省略※
}
Are you satisfied with the above config? Note: it can be manually customized after the wizard completes to add additional items.
1. yes
2. no
default choice: [1]:

Do you have any existing CloudWatch Log Agent (http://docs.aws.amazon.com/AmazonCloudWatch/latest/logs/AgentReference.html) configuratio                          n file to import for migration?
1. yes
2. no
default choice: [2]:

Do you want to monitor any log files?
1. yes
2. no
default choice: [1]:
2  ★2を入力★
Saved config file to /opt/aws/amazon-cloudwatch-agent/bin/config.json successfully.
Current config as follows:
{
        ※設定内容の表示は省略※
}
Please check the above content of the config.
The config file is also located at /opt/aws/amazon-cloudwatch-agent/bin/config.json.
Edit it manually if needed.
Do you want to store the config in the SSM parameter store?
1. yes
2. no
default choice: [1]:
2  ★2を入力★
Program exits now.
実行後 /opt/aws/amazon-cloudwatch-agent/bin/config.json に設定ファイルが出力されるので、それを指定してエージェントを起動します。
$ sudo /opt/aws/amazon-cloudwatch-agent/bin/amazon-cloudwatch-agent-ctl -a fetch-config -m ec2 -s -c file:/opt/aws/amazon-cloudwatch-agent/bin/config.json
/opt/aws/amazon-cloudwatch-agent/bin/config-downloader --output-dir /opt/aws/amazon-cloudwatch-agent/etc/amazon-cloudwatch-agent.d --download-source file:/opt/aws/amazon-cloudwatch-agent/bin/config.json --mode ec2 --config /opt/aws/amazon-cloudwatch-agent/etc/common-config.toml --multi-config default
Successfully fetched the config and saved in /opt/aws/amazon-cloudwatch-agent/etc/amazon-cloudwatch-agent.d/file_config.json.tmp
Start configuration validation...
※途中省略※
======== Error Log ========
2020-11-10T07:48:25Z E! [telegraf] Error running agent: Error parsing /opt/aws/amazon-cloudwatch-agent/etc/amazon-cloudwatch-agent.toml, open /usr/share/collectd/types.db: no such file or directory
起動エラーになってしまいました。collectdモジュールがインストールされていないためのようなのでインストールします。
$ sudo apt-get update
$ sudo apt install collectd
インストール後は、CloudWatchエージェントを起動することができました。
$ sudo /opt/aws/amazon-cloudwatch-agent/bin/amazon-cloudwatch-agent-ctl -a fetch-config -m ec2 -s -c file:/opt/aws/amazon-cloudwatch-agent/bin/config.json
/opt/aws/amazon-cloudwatch-agent/bin/config-downloader --output-dir /opt/aws/amazon-cloudwatch-agent/etc/amazon-cloudwatch-agent.d --download-source file:/opt/aws/amazon-cloudwatch-agent/bin/config.json --mode ec2 --config /opt/aws/amazon-cloudwatch-agent/etc/common-config.toml --multi-config default
Successfully fetched the config and saved in /opt/aws/amazon-cloudwatch-agent/etc/amazon-cloudwatch-agent.d/file_config.json.tmp
Start configuration validation...
※途中省略※
Configuration validation second phase succeeded
Configuration validation succeeded
Created symlink /etc/systemd/system/multi-user.target.wants/amazon-cloudwatch-agent.service → /etc/systemd/system/amazon-cloudwatch-agent.service.

$ ps -ef | grep amazon-cloudwatch-agent
root       25666       1  0 08:04 ?        00:00:00 /opt/aws/amazon-cloudwatch-agent/bin/amazon-cloudwatch-agent -config /opt/aws/amazon-cloudwatch-agent/etc/amazon-cloudwatch-agent.toml -envconfig /opt/aws/amazon-cloudwatch-agent/etc/env-config.json -pidfile /opt/aws/amazon-cloudwatch-agent/var/amazon-cloudwatch-agent.pid
root       25694    1807  0 08:08 pts/0    00:00:00 grep --color=auto amazon-cloudwatch-agent
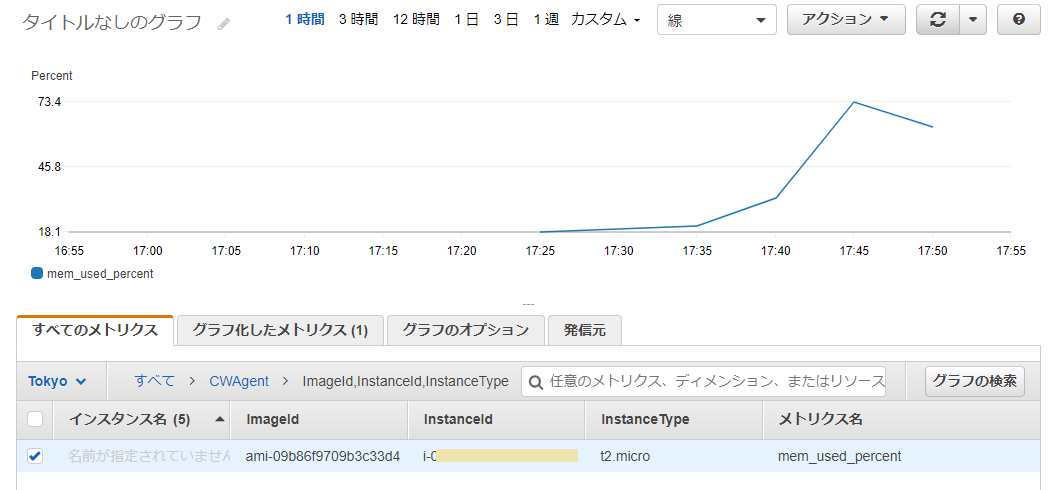
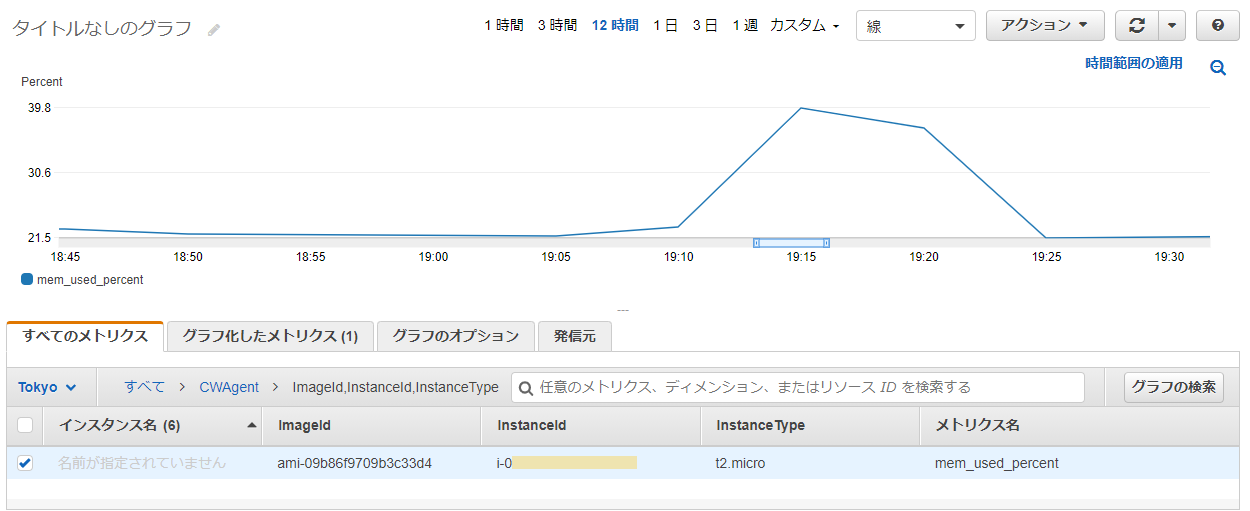
エージェントが起動後は、少し待てばCloudWatchでメトリクスが確認できます。CloudWatch → すべて → CWAgent → ImageId,InstanceId,InstanceType (デフォルトでは少し名前が分かりにくい) に対象インスタンスのメモリ使用率 ( mem_used_percent ) が表示されることが確認できます。
 |
|---|
2.SSMでインストール
ここからはSSMでの設定手順となります。
2-1. IAMロールを作成してアタッチ
まず手順 1.と同様にCloudWatchにメトリクスをPUTするためのロールを作成します。手順は同様ですが、SSM経由の設定となるためアタッチするポリシが異なります。コンソールの IAM → ロールから「ロールの作成」を選択。
|
|---|
AWSサービス、EC2を選択して次のステップに進む。
|
|---|
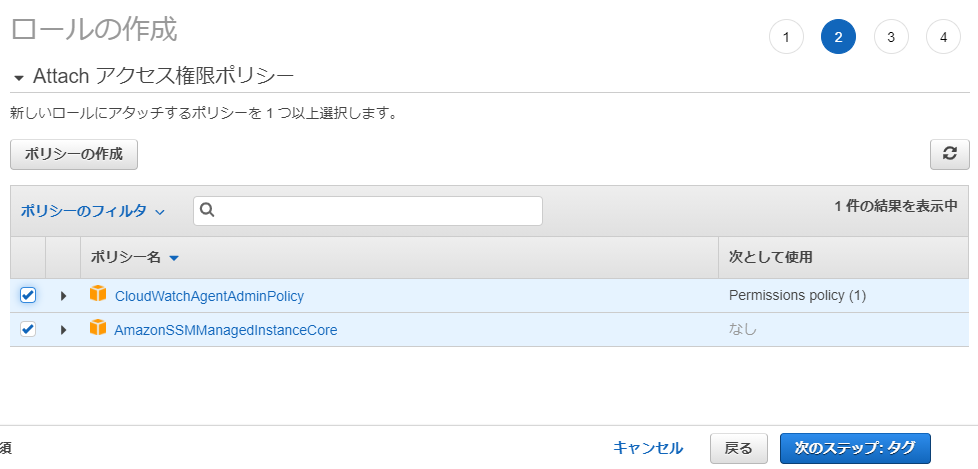
ポリシーの選択で、AmazonSSMManagedInstanceCore および CloudWatchAgentAdminPolicy にチェックを入れて次のステップに進む。ここで表示されるポリシはたくさんあるので、1つずつ検索して選択します。(※ 下記スクリーンショットは分かりやすくするために作成したもので、実際には間に多数のポリシがあるためこの状態にはなりません。)
 |
|---|
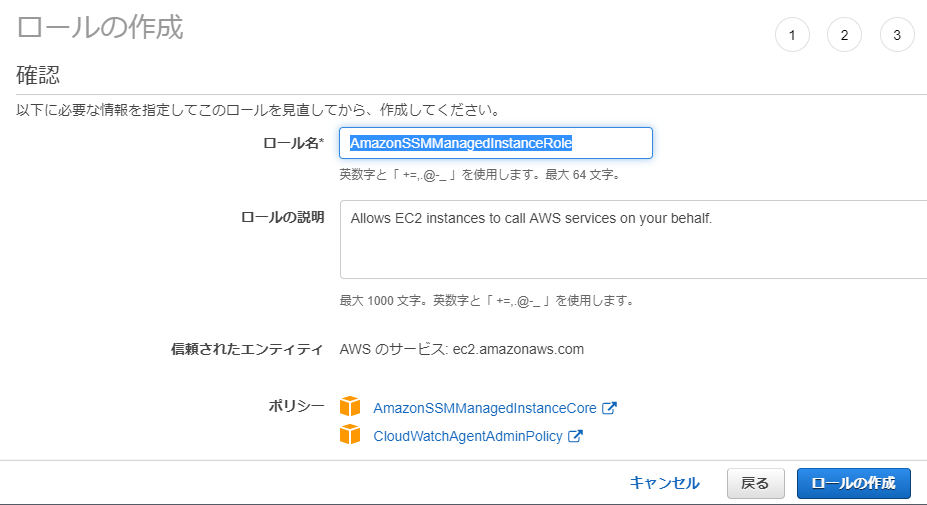
その次の画面はタグの入力なので、任意のタグを入力して次に進みます。最後に名前( AmazonSSMManagedInstanceRole 等)を入力してロールを作成します。
 |
|---|
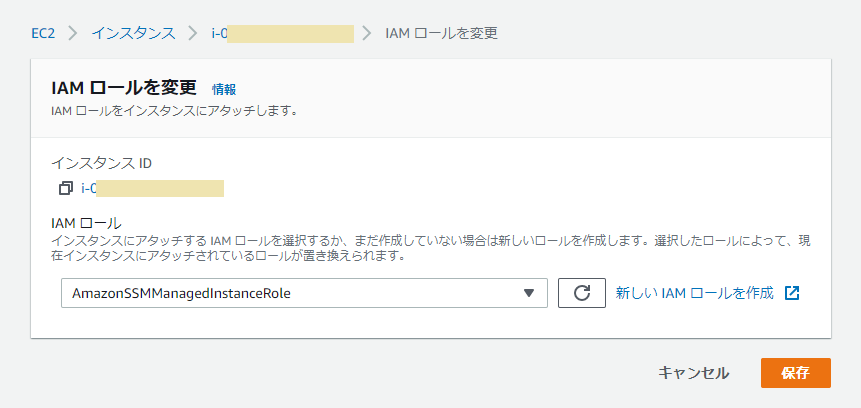
作成後、ロールをインスタンスにアタッチします。インスタンスメニューから アクション → セキュリティ → IAMロールを変更 を選択。
|
|---|
先ほど作成したロールを選択して保存すれば完了となります。
 |
|---|
2-2.インストールと確認
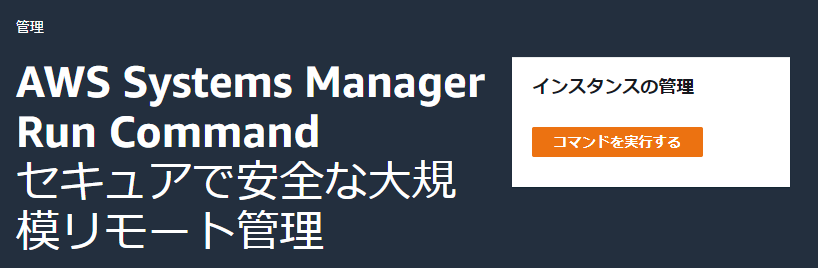
SSMの設定は引き続きコンソールで作業します。 SSM → Run Command → コマンドを実行する を選択。
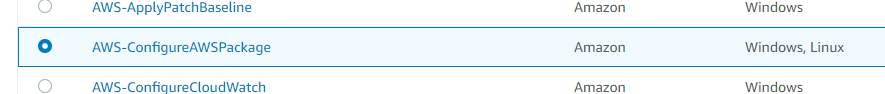
AWS-ConfigureAWSPackage をチェックする。
 |
|---|
同じ画面の下部にある コマンドのパラメータ にて、Nameに AmazonCloudWatchAgent 、Version に latest を入力。
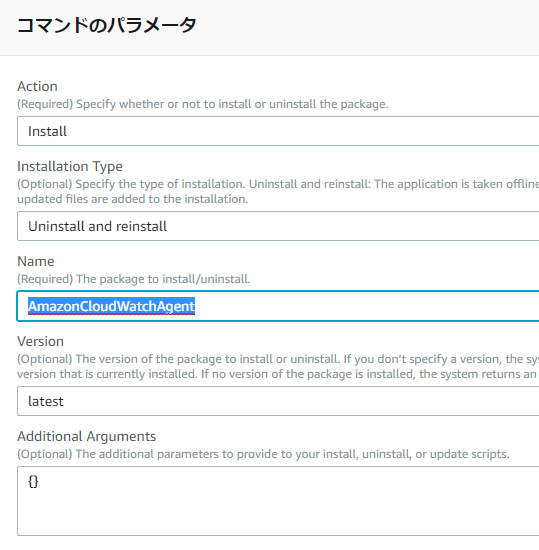 |
|---|
さらに下にある ターゲット にて、インスタンスを手動で選択する → 対象インスタンスをチェックする。
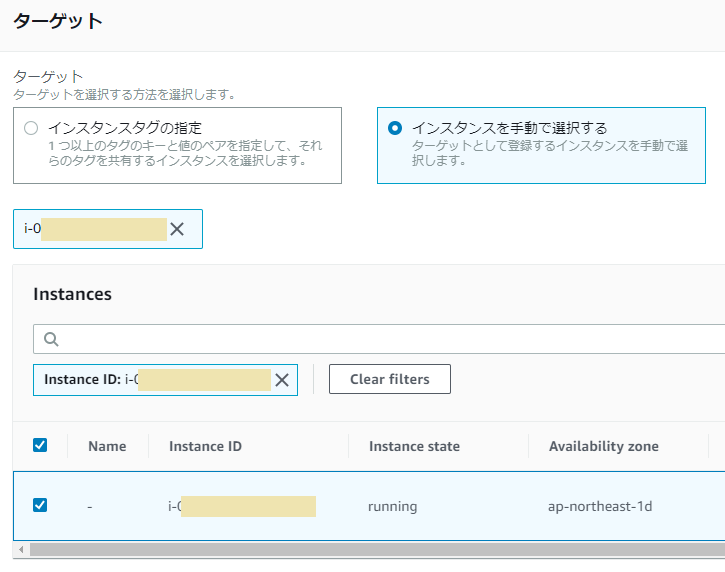 |
|---|
最後に(この画面は非常に縦長)、出力オプションを確認して「実行」ボタンを押します。
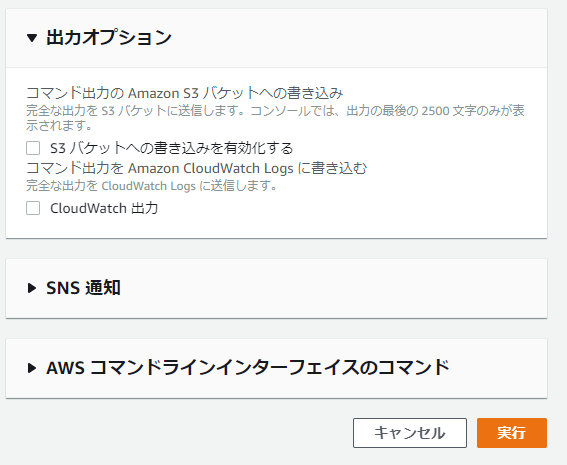 |
|---|
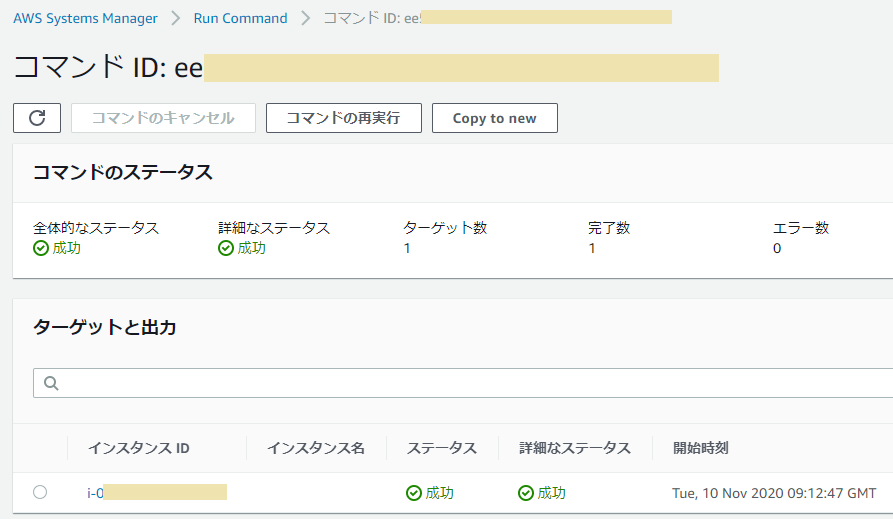
実行結果が正常になることを確認します。
 |
|---|
続いてインスタンスにログインし、ウィザードを実行して設定ファイルを作成します。手順 1.と同様にほとんどデフォルト設定(Enter)で先に進みますが、SSMの場合に選択が変わるところがあります。変更したところ1箇所のみ★で注記を記載しています。
$ sudo /opt/aws/amazon-cloudwatch-agent/bin/amazon-cloudwatch-agent-config-wizard
=============================================================
= Welcome to the AWS CloudWatch Agent Configuration Manager =
=============================================================
On which OS are you planning to use the agent?
1. linux
2. windows
default choice: [1]:

Trying to fetch the default region based on ec2 metadata...
Are you using EC2 or On-Premises hosts?
1. EC2
2. On-Premises
default choice: [1]:

Which user are you planning to run the agent?
1. root
2. cwagent
3. others
default choice: [1]:

Do you want to turn on StatsD daemon?
1. yes
2. no
default choice: [1]:

Which port do you want StatsD daemon to listen to?
default choice: [8125]

What is the collect interval for StatsD daemon?
1. 10s
2. 30s
3. 60s
default choice: [1]:

What is the aggregation interval for metrics collected by StatsD daemon?
1. Do not aggregate
2. 10s
3. 30s
4. 60s
default choice: [4]:

Do you want to monitor metrics from CollectD?
1. yes
2. no
default choice: [1]:

Do you want to monitor any host metrics? e.g. CPU, memory, etc.
1. yes
2. no
default choice: [1]:

Do you want to monitor cpu metrics per core? Additional CloudWatch charges may apply.
1. yes
2. no
default choice: [1]:

Do you want to add ec2 dimensions (ImageId, InstanceId, InstanceType, AutoScalingGroupName) into all of your metrics if the info is available?
1. yes
2. no
default choice: [1]:

Would you like to collect your metrics at high resolution (sub-minute resolution)? This enables sub-minute resolution for all metrics, but you can customize for specific metrics in the output json file.
1. 1s
2. 10s
3. 30s
4. 60s
default choice: [4]:

Which default metrics config do you want?
1. Basic
2. Standard
3. Advanced
4. None
default choice: [1]:

Current config as follows:
{
        ※設定内容の表示は省略※
}
Are you satisfied with the above config? Note: it can be manually customized after the wizard completes to add additional items.
1. yes
2. no
default choice: [1]:

Do you have any existing CloudWatch Log Agent (http://docs.aws.amazon.com/AmazonCloudWatch/latest/logs/AgentReference.html) configuration file to import for migration?
1. yes
2. no
default choice: [2]:

Do you want to monitor any log files?
1. yes
2. no
default choice: [1]:
2  ★2を入力★
Saved config file to /opt/aws/amazon-cloudwatch-agent/bin/config.json successfully.
Current config as follows:
{
        ※設定内容の表示は省略※
}
Please check the above content of the config.
The config file is also located at /opt/aws/amazon-cloudwatch-agent/bin/config.json.
Edit it manually if needed.
Do you want to store the config in the SSM parameter store?
1. yes
2. no
default choice: [1]:

What parameter store name do you want to use to store your config? (Use 'AmazonCloudWatch-' prefix if you use our managed AWS policy)
default choice: [AmazonCloudWatch-linux]

Trying to fetch the default region based on ec2 metadata...
Which region do you want to store the config in the parameter store?
default choice: [ap-northeast-1]

Which AWS credential should be used to send json config to parameter store?
1. ASxxxxxxxxxxxxxxx4D(From SDK)
2. Other
default choice: [1]:

Successfully put config to parameter store AmazonCloudWatch-linux.
Program exits now.
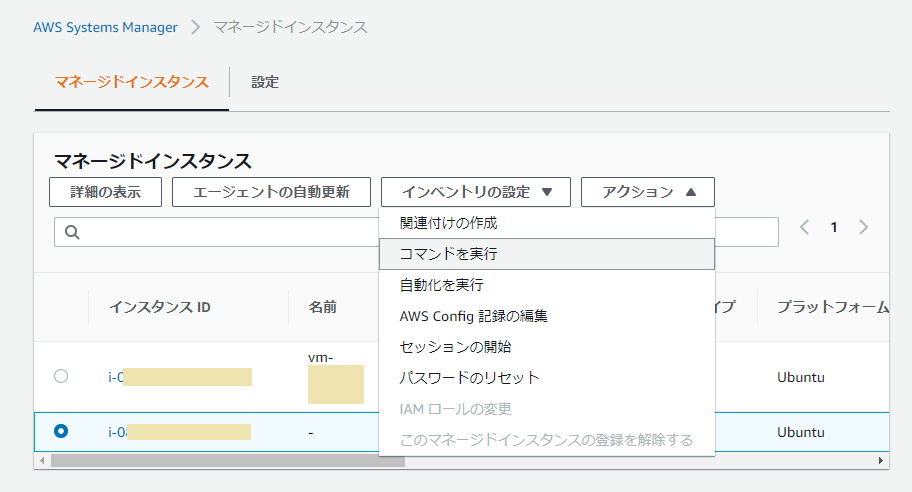
設定後はSSMに戻りエージェントを起動します。マネージドインスタンス → インスタンスを選択 → インベントリの設定 → コマンドを実行 を選択。
 |
|---|
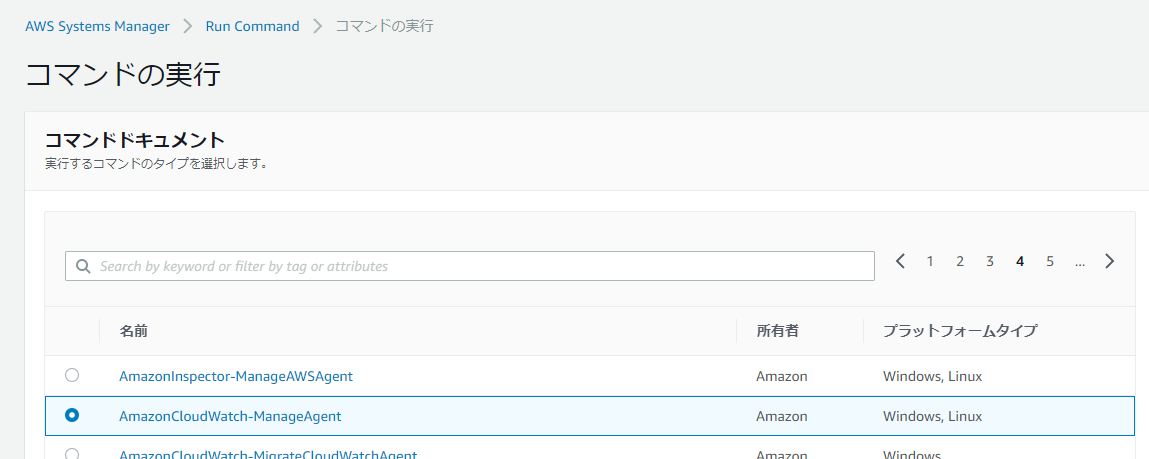
コマンドドキュメントから AmazonCloudWatch-ManageAgent を選択。コマンドのタイプは数が多いため、ここは右の > ボタンでページを進めないと表示されません。
 |
|---|
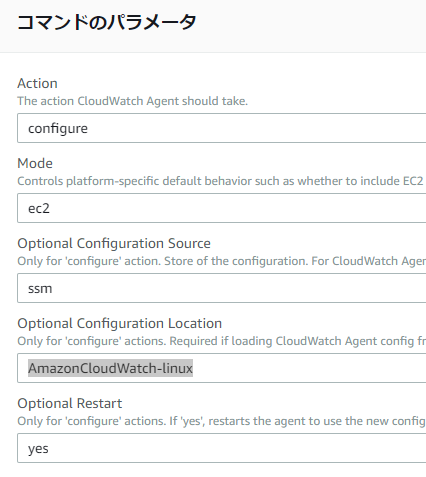
同じ画面の下部にある コマンドのパラメータで、AmazonCloudWatch-linux を入力する。
 |
|---|
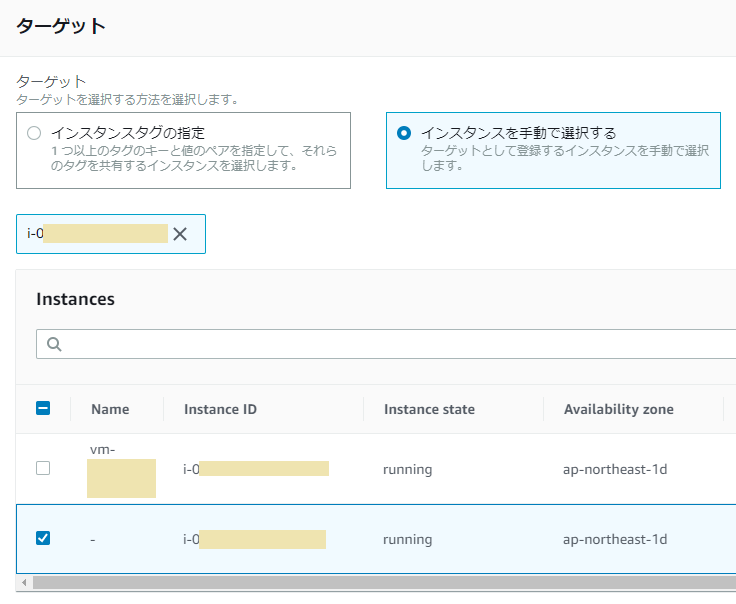
さらに下にある ターゲット にて、インスタンスを手動で選択する → 対象インスタンスをチェックする。
 |
|---|
最後に(この画面は非常に縦長)、出力オプションを確認して「実行」ボタンを押します。
|
|---|
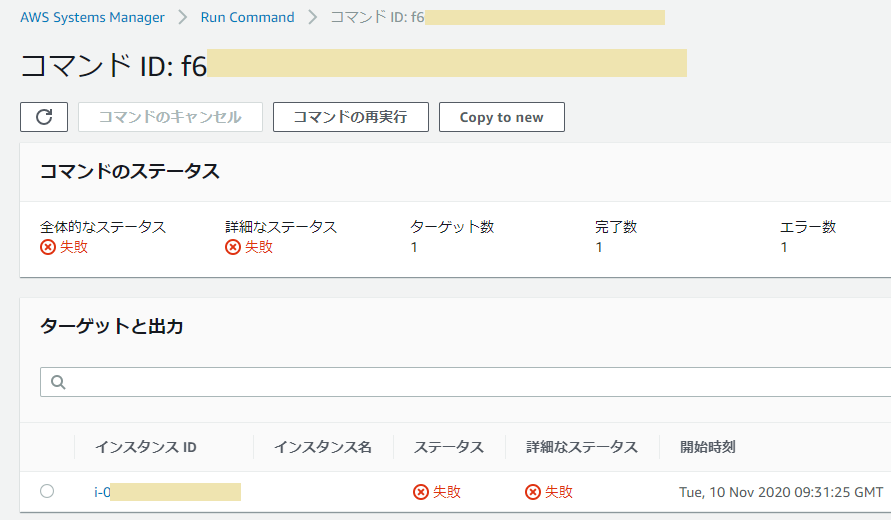
手順 1.と同様に起動エラーになってしまいました。
 |
|---|
/var/log/amazon/ssm を確認すると同じエラーメッセージが出力されていることが確認できます(該当箇所のみ抜粋してます)。
"standardOutput": "======== Error Log ========\n2020-11-10T09:31:25Z E! [telegraf] Error running agent:
 Error parsing /opt/aws/amazon-cloudwatch-agent/etc/amazon-cloudwatch-agent.toml, open /usr/share/collectd/types.db:
 no such file or directory\n",
"standardError": "2020/11/10 09:31:25 Reading json config file path: /opt/aws/amazon-cloudwatch-agent/etc/amazon-cloudwatch-agent.d/ssm_AmazonCloudWatch-linux.tmp ...\nfailed to run commands: exit status 1"
collectdモジュールをインストールします。
$ sudo apt-get update
$ sudo apt install collectd
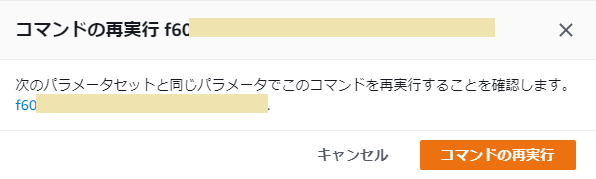
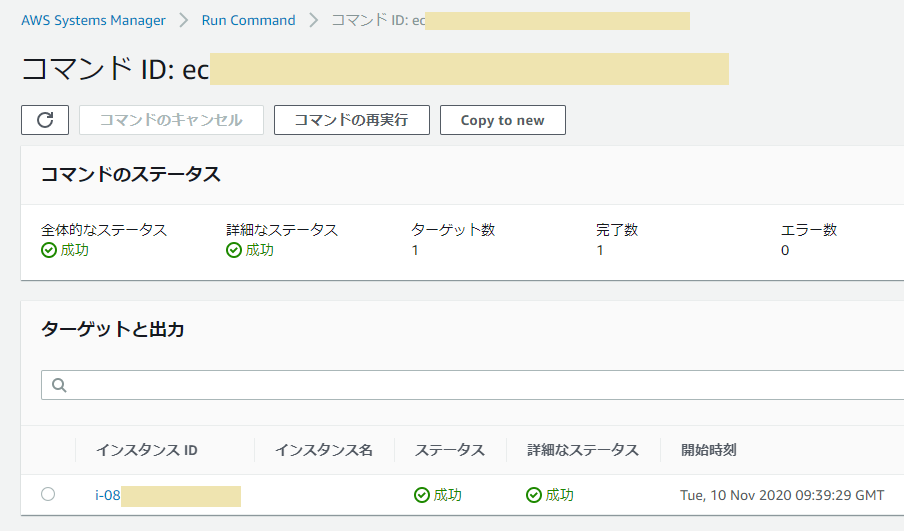
インストール後、コマンドの再実行ボタンを押すとエージェントが起動できました。
 |
|---|
 |
|---|
あとはCloudWatchで同様にメトリクスが確認できます。
 |
|---|
設定手順は以上となります。(SSMの方はSSMだけで作業を完結するよう見直しの余地がありそうですが、)それぞれの手順でCloudWatchに連携できることが確認できました。