簡単にUDPで端末間のパケットロスを可視化したい時ようにツールを作ってみました。クロスプラットフォームに対応しています。こんな用途で利用できればと思ってます。
- Wifi接続状況やパケットロスの確認
- ルーターの最大通信速度の確認
- インターネット接続が怪しい時のプライベートネットワークのパケットロス確認
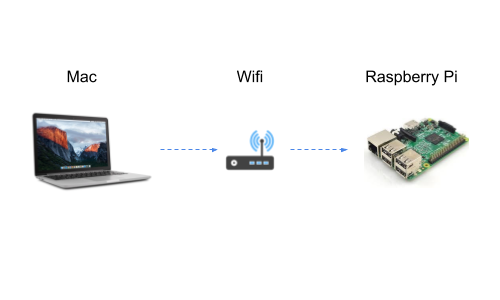
こんなイメージで利用を想定してます。
必要な環境
python 3.4.0以上
使い方
上図のMacとRaspberry Piを前提にしています。
Raspberry Pi
-
IPアドレスを確認します。今回は192.168.11.11。
-
simple-udp-communicatorを
git cloneします。
git clone https://github.com/65usami/simple-udp-communicator.git
-
server.pyを指定の待ち受けポートで起動します。今回は13001。
cd simple-udp-communicator
python server.py 13001
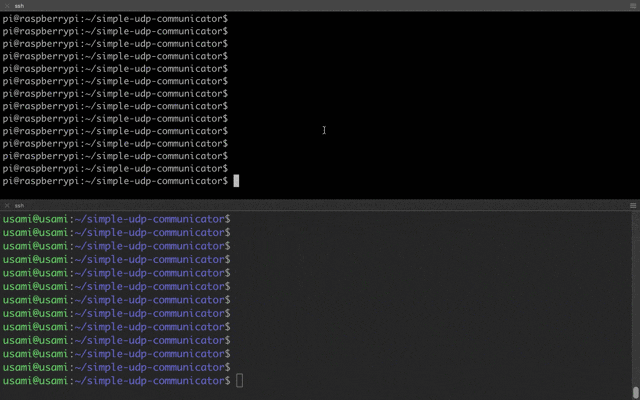
↓のように待機状態になります。
UDP Server
Parameters:
Receive Port : 13001
Mac
- simple-udp-communicatorを
git cloneします。
git clone https://github.com/65usami/simple-udp-communicator.git
-
client.pyに対象IPアドレスとポートを指定して実行します。- IPアドレス:192.168.11.11
- ポート:13001
cd simple-udp-communicator
python client.py '192.168.11.11' 13001
↓のようにRaspberry Pi宛へパケットが配信されます。
UDP Client
Parameters:
IP : 192.168.11.11
Port : 13001
Maximum mbps : 3.0
Duration time(sec) : 5
Actual Packet size : 1436
- Original size : 1500
Results:
datetime sent count sent size(bps)
-------- ---------- --------------
2019-09-07-12:07:04 261 2,998,368
2019-09-07-12:07:05 261 2,998,368
Raspberry Piのパケット受信状況と一緒に見るとこのような結果になります。
補足
最終的なパケット配信サイズ(bytes)はActual Packet sizeになります。
Actual Packet sizeはOriginal sizeからパケットヘッダーサイズを差し引いたサイズになります。Original sizeはオプションで変更できます。