実験を行った際に結構大量にcsvファイルが生成されるが,それらをさっとMatlabでグラフ化するために便利だった方法を記録
####### 参考:複数ファイルを逐次処理する
まずは,計測データ(csvファイル)を保管しているフォルダにパスを通して,その次にcsvファイルを検索する.
% add folder path if needed
addpath('/Users/***/****/folderA')

% Search csv files in folder-A. Type of "files" is structure.
files = dir('/Users/***/****/folder-A/*.csv');
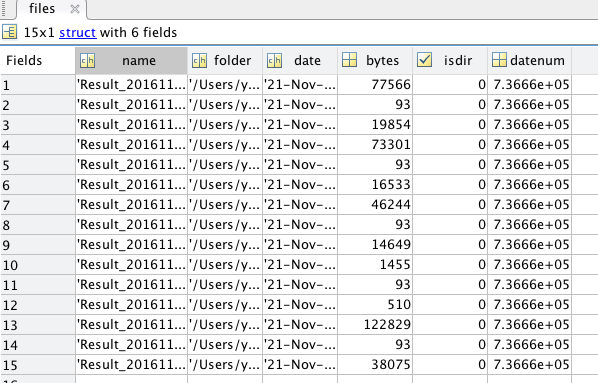
これで"files"に以下のようにname, folder(path), date, bytes, isdir, datenumが格納される.
以下は,例えばというケースです.
前提:Dataをimportするm-file(function)は既に用意している.
目的:csvファイルの特定の項目をplotしていく.
ポイント:csvファイルを「files.(n).name」で指定し逐次処理できる.
%  Display searched csv files on Commnad Window
for n=1:length(files)
   %Split filename in folder path, file name, and extention.
   [path, name, ext] = fileparts(files(n).name);

  %Display filename
   disp(name);
end

% Plot sensor data.
for i=1:1:length(files)

  [A,B,C,D,E]=import(files(i).name);

  subplot(4,5,i)
  plot(A, B)

  ---省略---

end
