はじめに
この記事は、はんなりPythonアドベントカレンダーの7日目の記事です。
海外で有名な数学を紹介するYouTubeチャンネル「3Blue1Brown(YouTube)」に使われているアニメーションツールを見つけました。
名前を、「Manim」(Mathematical Animation Engineの略)といいます。
日本での知名度はまだ低いですが、開発は活発に行われていて、MITライセンスなのでこれから有名になりそうです。
このようなアニメーションをPythonで簡単に作れます。

インストール
今回は、3Blue1Brownに使われているバージョンを含む github.com/3b1b/manim ではなく、メンテナンスが活発なコミュニティーエディション github.com/ManimCommunity/manim をインストールします。
環境構築
ManimはクロスプラットフォームなのでMac、GNU/Linux、Windowsにインストールできます。
インストールの詳細はこちら!↓
Installation
WSL(Ubuntu 18.04)の場合、
まずは、更新。
sudo apt update
sudo apt upgrade
pycairoをインストールします。
pycairoは、2Dのベクターイメージを描画するライブラリcairoのPythonラッパーです。
sudo apt install libcairo2-dev
ffmpegは、動画と音声を記録・変換・再生するライブラリです。
sudo apt install ffmpeg
Latexをインストール
sudo apt install texlive texlive-latex-extra texlive-fonts-extra \
texlive-latex-recommended texlive-science texlive-fonts-extra tipa
python3-pipがない場合、
sudo apt install python3-pip
pip3 install manim
動かしてみる
適当なプロジェクトディレクトリを作り、そのなかで作業します。
mkdir project
cd project
試しにscene.pyというファイルを作って、以下のプログラムを書き込みます。
Manimに含まれるモジュール、関数、および変数についての詳細はこちら↓
Reference
from manim import *

class HelloWorld(Scene):
    def construct(self):
        #######Code#######
        # テキストを定義
        first_text = Text("Hello, World!")

        # テキストを表示
        self.wait(1)
        self.play(Write(first_text))
        self.wait(1)
        # テキスト2つ分アップ
        self.play(ApplyMethod(first_text.shift,2*UP))
        self.wait(1)

        math_text=MathTex(
            "\\frac{d}{dx}f(x)g(x)=","f(x)\\frac{d}{dx}g(x)","+",
            "g(x)\\frac{d}{dx}f(x)"
        )
        # 数式を表示
        self.play(Write(math_text))

        framebox1 = SurroundingRectangle(math_text[1], buff = .1)
        framebox2 = SurroundingRectangle(math_text[3], buff = .1)

        self.play(
            ShowCreation(framebox1),
        )
        self.wait()
        # manim.animation.transform
        self.play(
            ReplacementTransform(framebox1,framebox2),
        )
        self.wait()
scene.pyのHelloWorldクラス名を指定、低品質レンダリング、gif形式で保存します。
manim scene.py HelloWorld -ql -i
[12/15/20 13:21:22] INFO     Text now uses Pango for rendering. In case of          text_mobject.py:719
                             problems, the old implementation is available as
                             CairoText.
[12/15/20 13:21:24] INFO     Animation 0 : Partial movie file written in {'/mn scene_file_writer.py:393
                             t/c/Users/tonoy/Dev/manim/project/media/videos/sc
                             ene/480p15/partial_movie_files/HelloWorld/3070002
                             022_3972803965_223132457.mp4'}
...

コマンドの構成
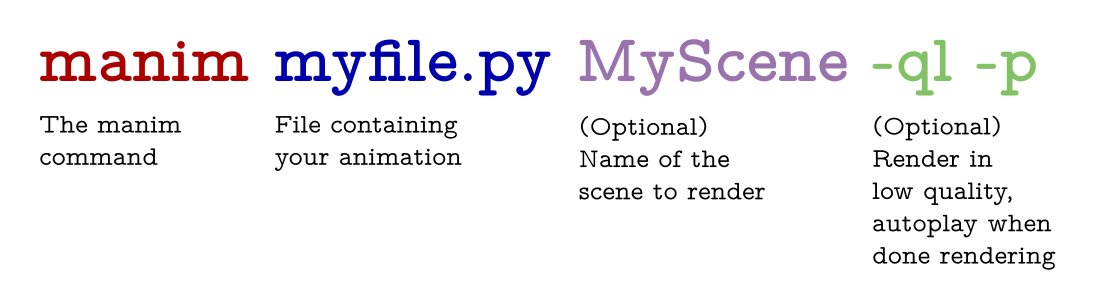
https://github.com/ManimCommunity/manim/#command-line-arguments より引用
コマンドの詳細についてはこちら↓
A list of all CLI flags
-ql:低品質レンダリング、480p 15fps
-qe:高品質レンダリング、1080p 60fps
-qk:4Kレンダリング、4K 60fps
-p:シーンがレンダリングされたら動画を再生するようにmanimに指示する
-s:シーンの最後のフレームを出力する。静止画もとりたい場合に使います。
-i:gif形式で保存
-a:複数の(Scene)をまとめてレンダリングできる。
遊んでみる
2Dグラフ
活性化関数をアニメーションしてみます。
from manim import *
import math

class Graphing(GraphScene):
    CONFIG = {
        "x_min": -4,
        "x_max": 4,
        "y_min": -2,
        "y_max": 2,
        "graph_origin": ORIGIN,
        "function_color": WHITE,
        "axes_color": BLUE
    }

    def construct(self):
        #Make graph
        self.setup_axes(animate=True)
        func_graph = self.get_graph(lambda x: 1 / (1 + np.exp(-x)), color=WHITE)
        graph_title = Tex("sigmoid function")
        graph_title.scale(1.5)
        graph_title.to_corner(UP + LEFT)

        func_graph_2 = self.get_graph(lambda x: np.tanh(x), color=GREEN)
        graph_title_2 = Tex("tanh function")
        graph_title_2.scale(1.5)
        graph_title_2.to_corner(UP + LEFT)

        func_graph_3 = self.get_graph(lambda x: np.maximum(0, x), color=YELLOW)
        graph_title_3 = Tex("ReLU function")
        graph_title_3.scale(1.5)
        graph_title_3.to_corner(UP + LEFT)


        #Display graph
        self.play(ShowCreation(func_graph))
        self.add(graph_title)
        self.wait(1)
        self.play(FadeOut(graph_title))
        self.play(ShowCreation(func_graph_2))
        self.add(graph_title_2)
        self.wait(1)
        self.play(FadeOut(graph_title_2))
        self.play(ShowCreation(func_graph_3))
        self.add(graph_title_3)
        self.wait(2)

3Dグラフ
ニューラルネットワークの学習でよくでる偏微分をグラフにしてみます。
3Dなのでそれなりに時間かかります。
from manim import *

class ThreeDSurface(ParametricSurface):

    def __init__(self, **kwargs):
        kwargs = {
        "u_min": -1.5,
        "u_max": 1.5,
        "v_min": -1.5,
        "v_max": 1.5,
        "checkerboard_colors": [GREEN, BLUE],
        "checkerboard_opacity": 0.5
        }
        ParametricSurface.__init__(self, self.func, **kwargs)

    def func(self, x, y):
        return np.array([x,y,x**2 + y**2])


class Test(ThreeDScene):

    def construct(self):
        self.set_camera_orientation(phi=75 * DEGREES, theta=30 * DEGREES)

        axes = ThreeDAxes()
        self.add(axes)

        surface = ThreeDSurface()
        self.play(ShowCreation(surface))

        d = Dot(np.array([0,0,0]), color = YELLOW)
        self.play(ShowCreation(d))


        self.wait()
        self.move_camera(phi=45 * DEGREES, theta=30 * DEGREES)
        self.begin_ambient_camera_rotation()
        self.wait(9)

最後に
matplotlibでは難しいアニメーションがこんなに簡単にできるとは思いませんでした。これからどんどん使っていこうと思います。