はじめに
どうも!生産技術部で製品の検査工程を担当しているエンジニアです。Advent Calendar 5日目ですね!
Elasticsearch初心者ですが、参加してみました。
脱Excel Elastic Stack(docker-compose)でcsvログを分析・可視化 - Elastic Stackとはの続きになります。
対象読者
この記事では、Elastic Stackをそもそも知らない方、これから試そうと思っている方を対象としています。
この記事の内容
この記事は、[公式ブログ「MetricbeatとLogstashやKafkaを併用してElastic Stackを監視する」]
(https://www.elastic.co/jp/blog/elastic-stack-monitoring-with-metricbeat-via-logstash-or-kafka)を実践して上手く動いたのでまとめました。全て一台のPCで動かしているため、あまり意味はないかもしれないですが、、、

GitLabに設定ファイル一式を置いておきましたので参考にしてください。
リポジトリはこちら -> elastic-stack
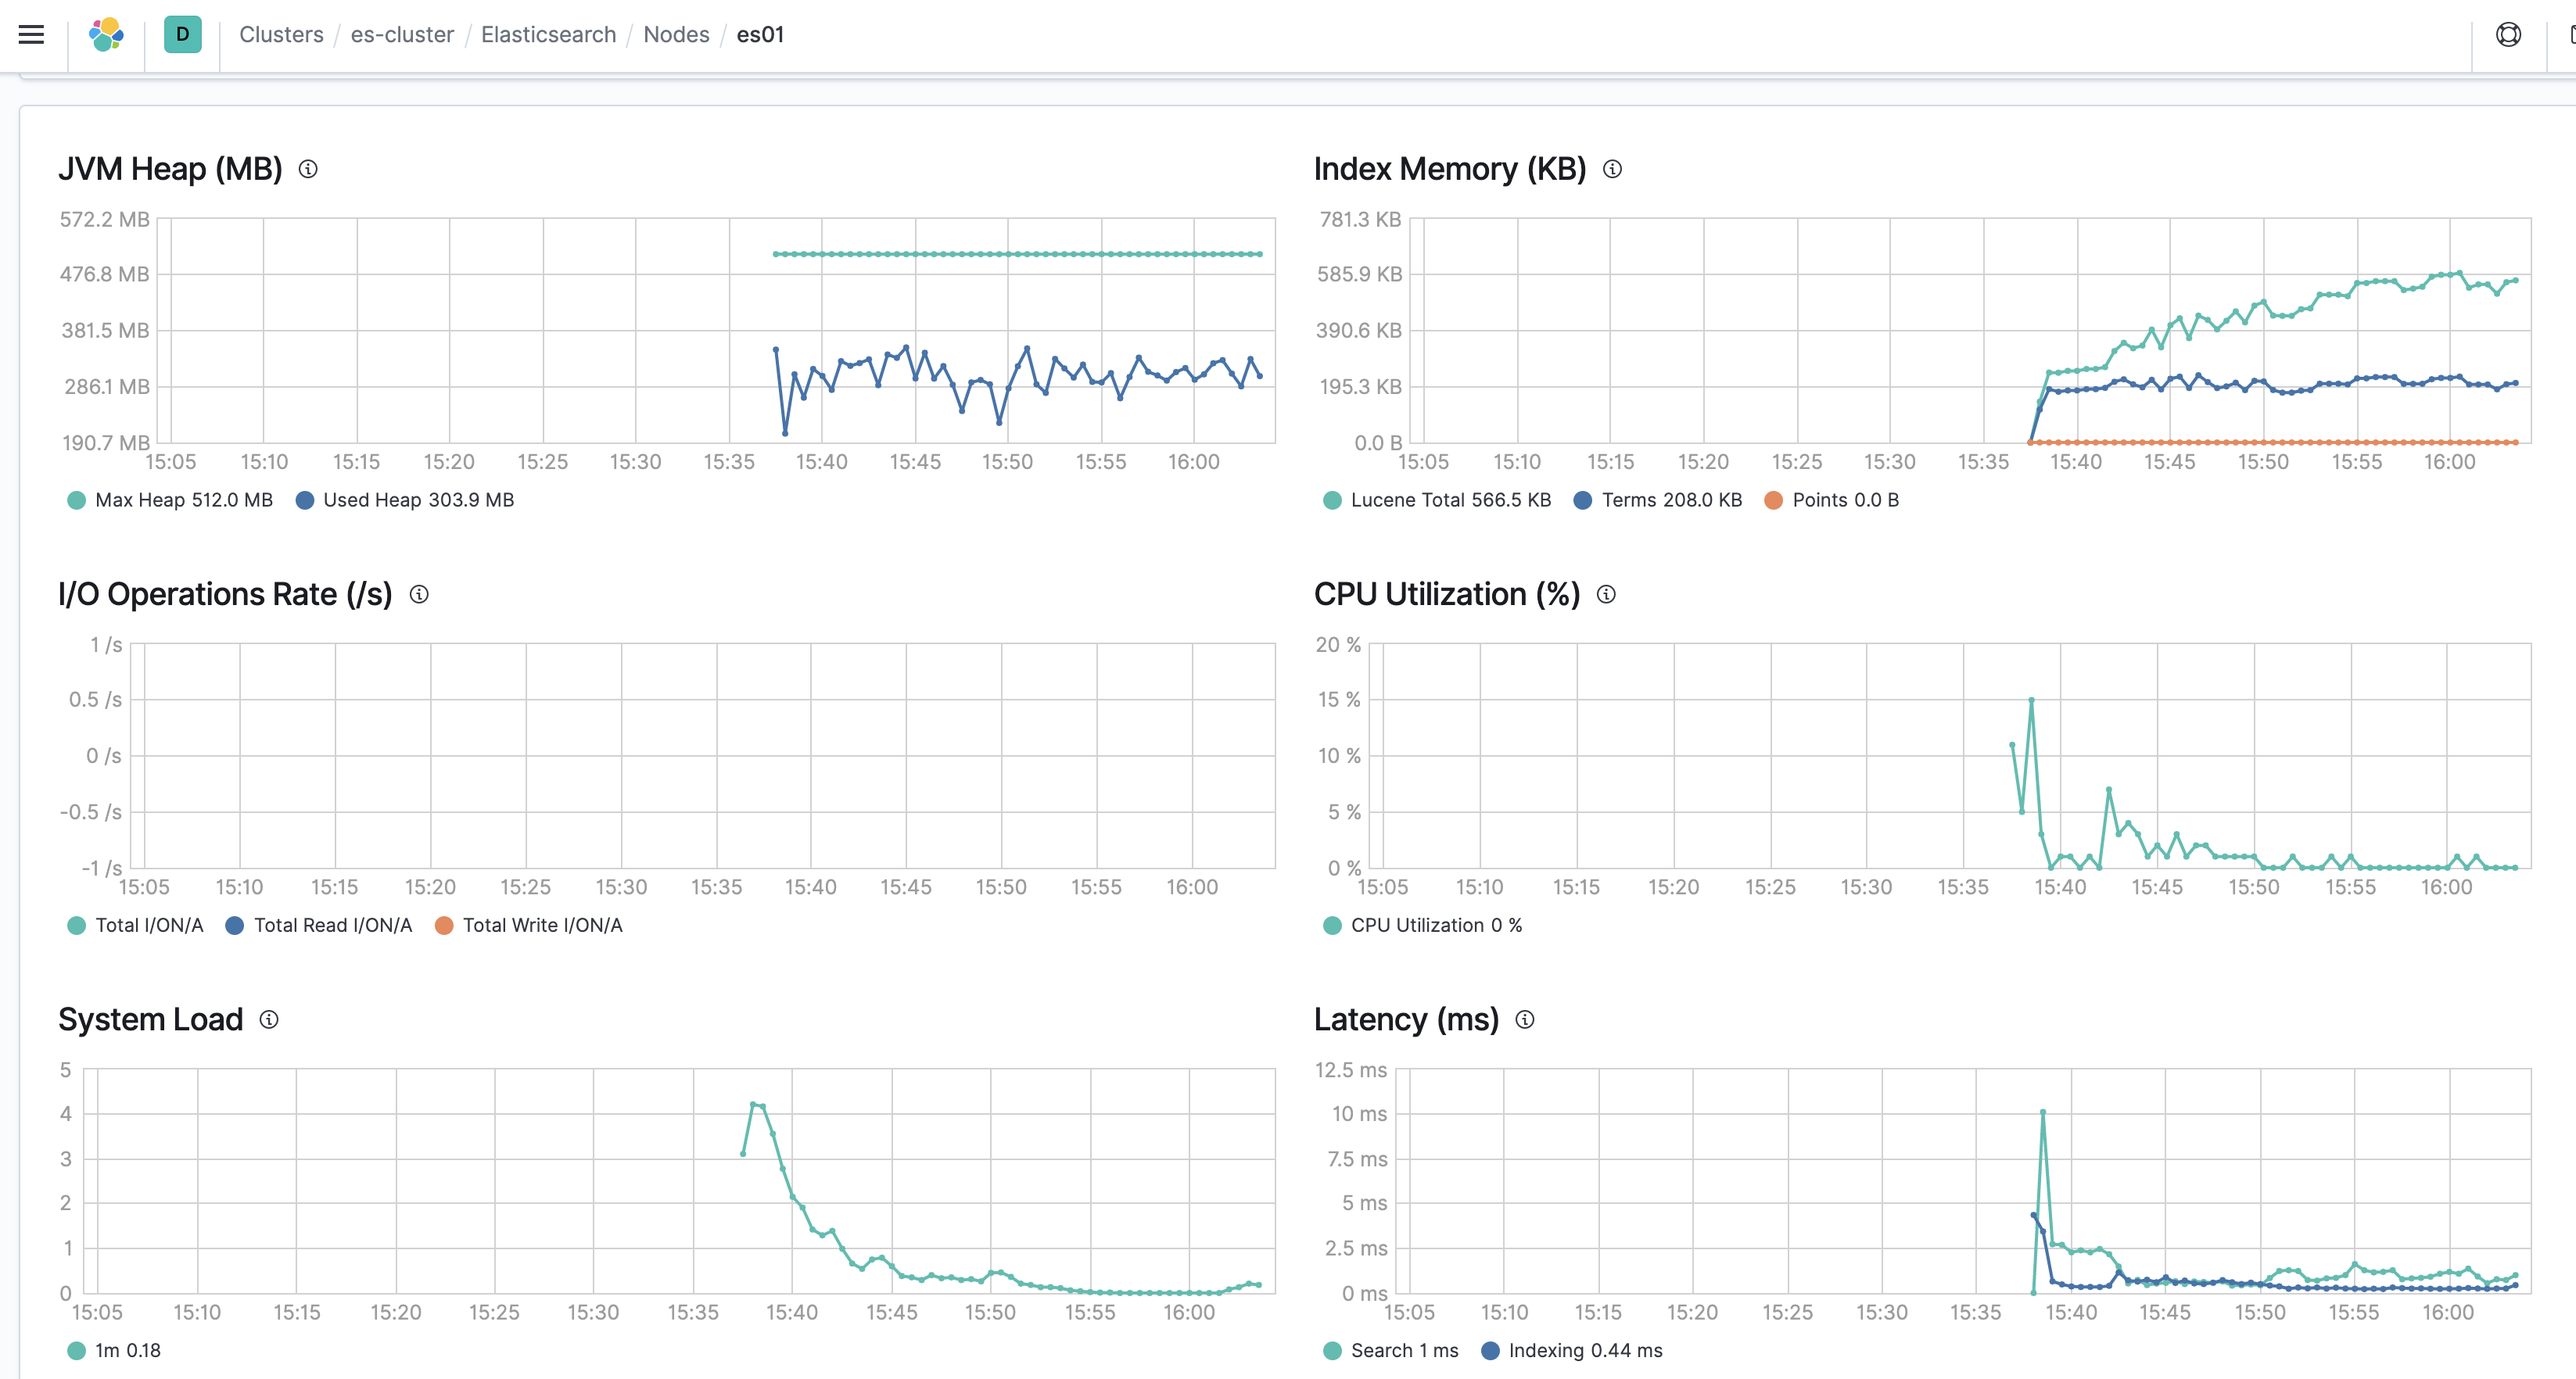
Elasticsearchを監視
Collecting Elasticsearch monitoring data with Metricbeatに従って、elasticsearch.ymlに設定を追記します。
xpack.monitoring.collection.enabled: true
metricbeat.ymlはxpack.enabledをtrueにしておきます。
# ---------------------------- Elasticsearch Module ----------------------------
- module: elasticsearch
  #metricsets:
    #- node
    #- node_stats
    #- index
    #- index_recovery
    #- index_summary
    #- shard
    #- ml_job
  period: 10s
  hosts: [ "elasticsearch:9200" ]
  #username: "elastic"
  #password: "changeme"
  #ssl.certificate_authorities: ["/etc/pki/root/ca.pem"]
  #index_recovery.active_only: true
  xpack.enabled: true
  #scope: node
Kibanaを監視
Collect Kibana monitoring data with Metricbeatに従って進めます。
monitoring.kibana.collection.enabled: false

xpack.monitoring.collection.enabled: true
metricbeat.ymlはxpack.enabledをtrueにしておきます。
# -------------------------------- Kibana Module --------------------------------
- module: kibana
  #metricsets: ["status"]
  period: 10s
  hosts: ["kibana:5601"]
  #basepath: ""
  #enabled: true

  # Set to true to send data collected by module to X-Pack
  # Monitoring instead of metricbeat-* indices.
  xpack.enabled: true
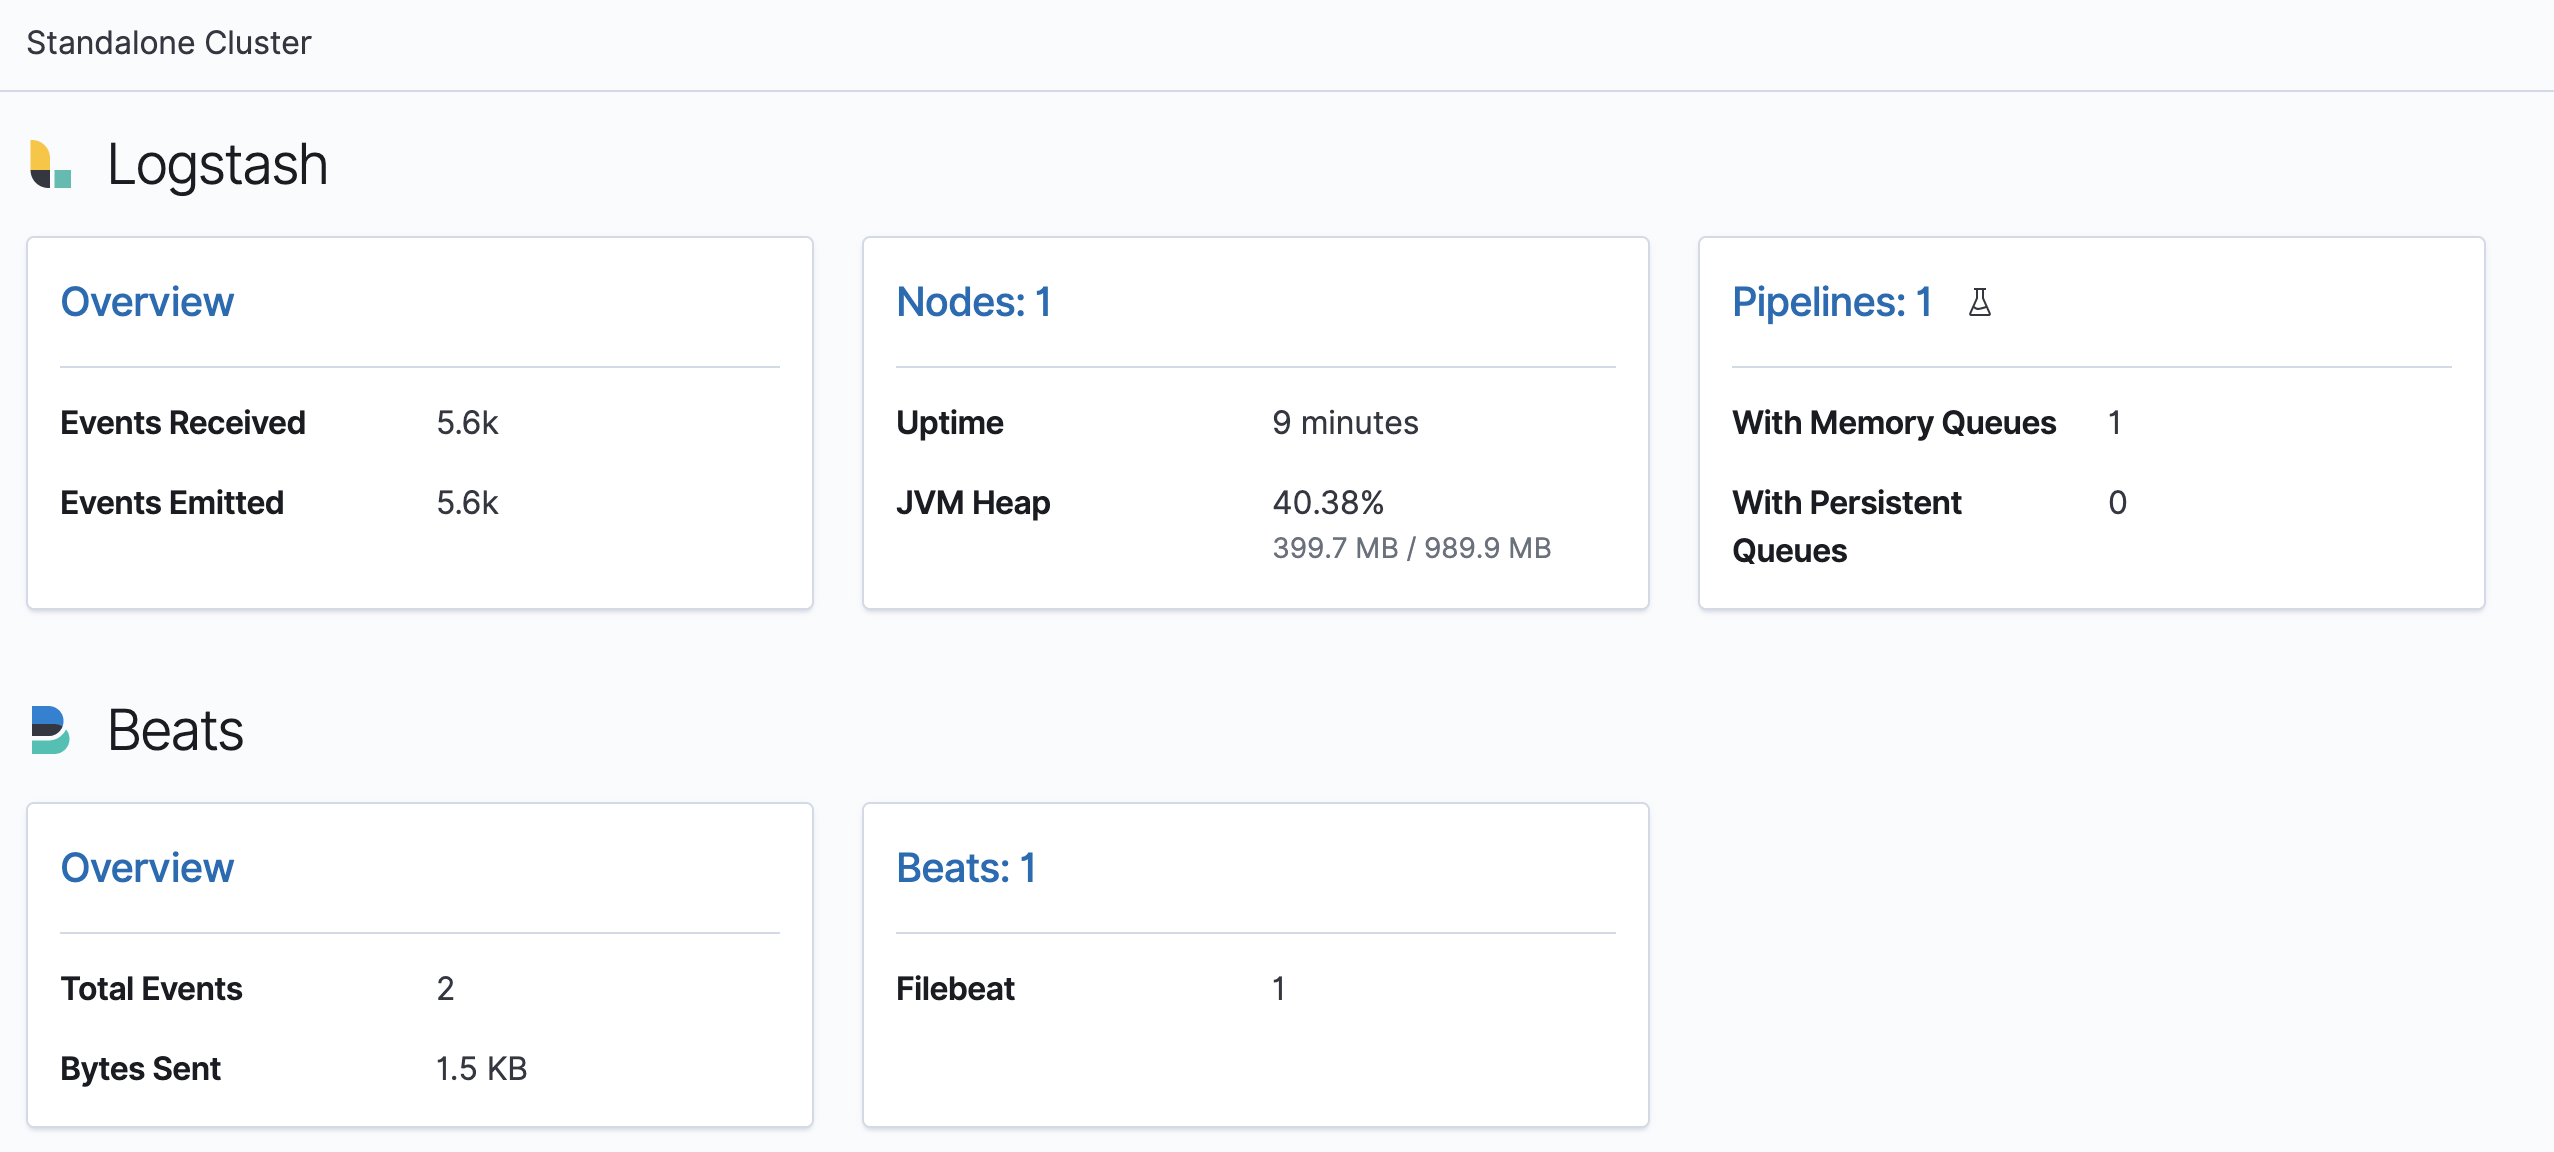
Logstashを監視
Collect Logstash monitoring data with Metricbeatに従って進めます。
# ------------ X-Pack Settings (not applicable for OSS build)--------------
#
# X-Pack Monitoring
# https://www.elastic.co/guide/en/logstash/current/monitoring-logstash.html
monitoring.enabled: false
xpack.monitoring.enabled: true
他と同様にxpack.enabledをtrueにしておきます。
# ------------------------------- Logstash Module -------------------------------
- module: logstash
  #metricsets:
    #- node
    #- node_stats
  period: 10s
  hosts: ["logstash:9600"]
  #username: "user"
  #password: "secret"
  xpack.enabled: true
Filebeatを監視
Use Metricbeat to send monitoring dataを参考に実施しますが、他の設定と異なり、まずhttp.enableを有効にする必要があります。
# =============================== HTTP Endpoint ================================

# Each beat can expose internal metrics through a HTTP endpoint. For security
# reasons the endpoint is disabled by default. This feature is currently experimental.
# Stats can be access through http://localhost:5066/stats . For pretty JSON output
# append ?pretty to the URL.

# Defines if the HTTP endpoint is enabled.
http.enabled: true

# The HTTP endpoint will bind to this hostname, IP address, unix socket or named pipe.
# When using IP addresses, it is recommended to only use localhost.
http.host: "0.0.0.0"

# Port on which the HTTP endpoint will bind. Default is 5066.
http.port: 5066
以下の設定も無効化しておきます。
# ============================= X-Pack Monitoring ==============================
# Filebeat can export internal metrics to a central Elasticsearch monitoring
# cluster.  This requires xpack monitoring to be enabled in Elasticsearch.  The
# reporting is disabled by default.

# Set to true to enable the monitoring reporter.
monitoring.enabled: false
metricbeat.ymlに設定を追記します。
# ------------------------------- Filebeat Module -------------------------------
- module: beat
  #metricsets:
    #- stats
    #- state
  period: 10s
  hosts: ["filebeat:5066"]
  #username: "user"
  #password: "secret"
  xpack.enabled: true
MetricbeatからLogstashへの出力設定
# ------------------------------ Logstash Output -------------------------------
output.logstash:
  # The Logstash hosts
  hosts: [ 'logstash' ]

  index: metricbeat
Logstashのパイプライン設定
マルチパイプラインを使用しているため、sourceフィールドを見て、metricbeatから来たログはmetricbeatlogに送ります。
- pipeline.id: beats-server
  config.string: |
    input { beats { port => 5044 } }
    output {
        if [source] == 'filebeat' {
          pipeline { send_to => filebeatlog }
        } else if [source] == 'metricbeat' {
          pipeline { send_to => metricbeatlog }
        }
    }

- pipeline.id: filebeat-processing
  path.config: "/usr/share/logstash/pipeline/{input/filebeat_in,filter/filebeat_filter,output/filebeat_out}.cfg"
  pipeline.batch.size: 50
  pipeline.batch.delay: 50

- pipeline.id: metricbeat-processing
  path.config: "/usr/share/logstash/pipeline/{input/metricbeat_in,filter/metricbeat_filter,output/metricbeat_out}.cfg"
  pipeline.batch.size: 50
  pipeline.batch.delay: 50
パイプラインの設定は[公式ブログ「MetricbeatとLogstashやKafkaを併用してElastic Stackを監視する」]
(https://www.elastic.co/jp/blog/elastic-stack-monitoring-with-metricbeat-via-logstash-or-kafka)通りに記述しました。
input {
  pipeline {
    address => metricbeatlog
  }
}
filter {
  mutate {
    rename => { "[@metadata][id]" => "[@metadata][_id]" }
  }
}
output {
  if [@metadata][index] =~ /^.monitoring-*/ {
    if [@metadata][_id] {
      elasticsearch {
        index => "%{[@metadata][index]}-%{+YYYY.MM.dd}"
        document_id => "%{[@metadata][_id]}"
        hosts => [ 'elasticsearch' ]
      }
    } else {
      elasticsearch{
        index => "%{[@metadata][index]}-%{+YYYY.MM.dd}"
        hosts => [ 'elasticsearch' ]
      }
    }
  } else {
  }
}
最後に
JVM Heapの状態など、確認できるため重宝しそうです。