NT倍率を使ったペアトレード Pairs Trade
ペアトレード(Pairs Trade)は似通った動きをする2つの株銘柄を使って行うトレード方法としてよく知られている.2つの動きに差が見られたときにその差を埋めるようなポジションをとることにより利益を得ようとする方法で,ヘッジファンドなどでも行っているとのこと.
最近読んだ「現場ですぐ使える時系列データ分析」でもその手法が詳しく説明されていて,理論的には,2つが共和分 cointegrationの関係をとることがペアトレードを成り立たせる前提となるらしいが,まずはBack Testをやって見て利益を出せるのか確認したいと,当初,考えた.日本ではNT倍率がペアトレードの材料として取り上げられるが,ご存知の方もいらっしゃると思うが,Nikkei225とTopixという2つのインデックスの比率のことをNT倍率(=Nikkei225 / Topix)と呼んでいる.インデックス同士の組み合わせは「理論的にどうか」という疑問は生じるが,ポピュラーな手法ということで見てみることにした.
調べていく過程で大きなTrendの変化が見えたので「アベノミクスの始まり調べる」という題目で考えてみた.
Historical ChartとScatter Plot
まず,時系列データの観察である.
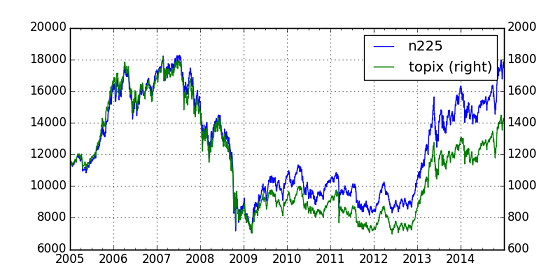
TopixもNikkei225も東証一部の株価から算定される株価指数なので,なるほど動きの相似性は高い.Chartにてy軸の目盛りは異なる(Nikkei225-left, Topix-right)が,2005年から2009年頃まで線はほぼ重なっている.2010年頃からNikkei225がTopixの線から上に離れているTrendも確認できる.
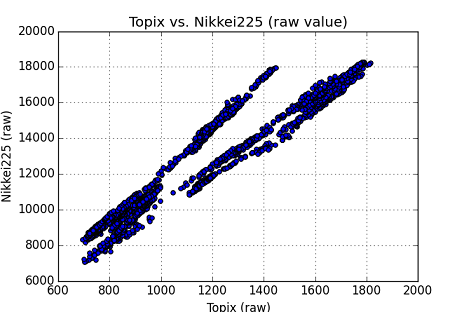
次にScatter Plotをながめてみる.
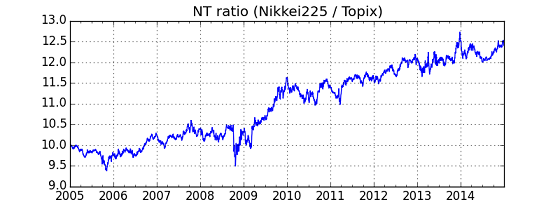
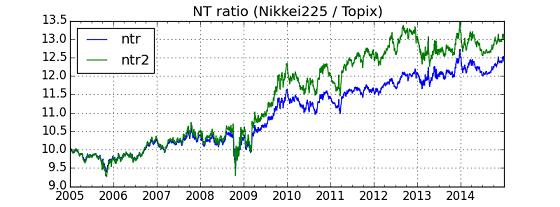
このChartでは,plotが2本の直線の近傍に沿っていることがわかる.これと最初のplot,Historical Chartを合わせて考えると,最初,傾きの小さい方の直線がNTのtrendであったが,時間がたって,傾きが大きいtrendに変わったのではないかと推測できる.この考えに基づいて,次に回帰分析を行った.因みに,NT倍率自体のHistorical Chart は,以下の通りである.
StatsModelsによる回帰分析
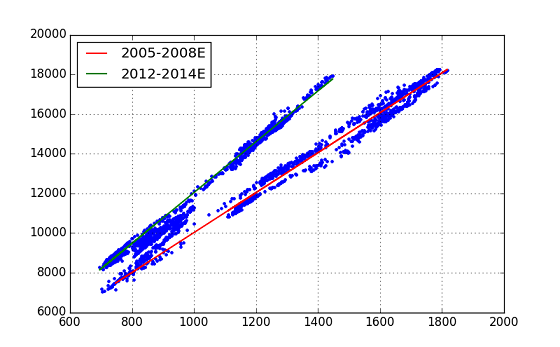
今回は線形回帰分析を行ったが,PythonモジュールはStatsModelsを用いた.(Topix, Nikkei225)の時系列データから,2つの時間区間を設定してデータを抽出し,それぞれに対して回帰を実施した.時間区間は,2005/B~2008/E と 2012/B~2014/Eである.前者は「リーマンショック」が起こるまでにあたり,後者はいわゆる「アベノミクス」の時代である.
import statsmodels.api as sm
# ... pre-process ...

# Regression Analysis
index_s1 = pd.date_range(start='2005/1/1', end='2008/12/31', freq='B')
x1 = pd.DataFrame(index=index_s1); y1 = pd.DataFrame(index=index_s1)

x1['topix'] = mypair['topix']   # 2005 .. 2008/E
y1['n225'] = mypair['n225']

x1 = sm.add_constant(x1)
model1 = sm.OLS(y1[1:], x1[1:])
mytrend1 = model1.fit()
print mytrend1.summary()

index_s2 = pd.date_range(start='2012/1/1', end='2014/12/31', freq='B')
x2 = pd.DataFrame(index=index_s2); y2 = pd.DataFrame(index=index_s2)

x2['topix'] = mypair['topix']   # 2012 .. 2014/E
y2['n225'] = mypair['n225']

x2 = sm.add_constant(x2)
model2 = sm.OLS(y2[1:], x2[1:])
mytrend2 = model2.fit()
print mytrend2.summary()

# Plot fitted line
plt.figure(figsize=(8,5))
plt.plot(mypair['topix'], mypair['n225'], '.')
plt.plot(x1.iloc[1:,1], mytrend1.fittedvalues, 'r-', lw=1.5, label='2005-2008E')
plt.plot(x2.iloc[1:,1], mytrend2.fittedvalues, 'g-', lw=1.5, label='2012-2014E')
plt.grid(True)
plt.legend(loc=0)
pandasでmypair[['topix', 'n225']] というDataFrameオブジェクトに各データをセットした後に,上記リストを実行した.
きれいに2本の直線を fit することができた.回帰分析の評価であるが,期待以上の数字を示している.(2つの回帰計算とも良好な結果だが,その1つの結果を示す.)
>>> print mytrend1.summary()
        OLS Regression Results (Early period, 2005-2008E)
==============================================================================
Dep. Variable:                   n225   R-squared:                       0.981
Model:                            OLS   Adj. R-squared:                  0.981
Method:                 Least Squares   F-statistic:                 5.454e+04
Date:                Sun, 21 Jun 2015   Prob (F-statistic):               0.00
Time:                        17:11:26   Log-Likelihood:                -7586.3
No. Observations:                1042   AIC:                         1.518e+04
Df Residuals:                    1040   BIC:                         1.519e+04
Df Model:                           1
==============================================================================
                 coef    std err          t      P>|t|      [95.0% Conf. Int.]
------------------------------------------------------------------------------
const        -45.0709     62.890     -0.717      0.474      -168.477    78.335
topix         10.0678      0.043    233.545      0.000         9.983    10.152
==============================================================================
Omnibus:                       71.316   Durbin-Watson:                   0.018
Prob(Omnibus):                  0.000   Jarque-Bera (JB):               30.237
Skew:                          -0.189   Prob(JB):                     2.72e-07
Kurtosis:                       2.256   Cond. No.                     8.42e+03
==============================================================================
Warnings:
[1] The condition number is large, 8.42e+03. This might indicate that there are
strong multicollinearity or other numerical problems.
決定係数 R-squiredは 0.981, F-stat 5.454e+04 p-value 0.00 (!) である.上記の通り,プログラムからは conditional numerが大きすぎる,おかしくない?の
Warningが発生している.
(今回は,このWarningについて深く追及していません... 何かアドバイスあればお願いします.)
今回の回帰分析(coef)から得られた2本のTrend Lineの式は,以下の通り.
Period-1(2005-2008) : n225 = topix x 10.06 - ** 45.07 **
Period-2(2012-2014) : n225 = topix x 12.81 - 773.24
NT倍率という指標は,10.06 から 12.81 へのトレンドに変化したということができる.しかしながら,一つ疑問なのが,なぜこの大きな変化がNTのHistorical Chartから見えないかという点である.
Period-1からPeriod-2にかけて切片(intercept)が変わっているのでその影響を排除した'ntr2' (緑色の線)も求めてみたが,階段状にNTがジャンプした(from 10.06 to 12.81)ということでは無いらしい.
これまでの分析からの結論としては,「アベノミクスは,2009年から2012年(初頭)の間に始まった」 ということになる.すっきりした結果ではないが,少なくとも安倍首相が第2期の総理に就任した2012年12月には,すでにこの経済トレンドは始まっていたと考えるのが(今回の結果からは)自然といえる.
(結論がはっきりしないので,scikit-learnを使った分類を次に行いました."2"の記事を参照ください.)
参考文献
- "現場ですぐ使える時系列データ分析"(横内 大介 (著), 青木 義充 (著),技術評論社)http://gihyo.jp/book/2014/978-4-7741-6301-7
- "Python for Finance": (O'reilly Media) http://shop.oreilly.com/product/0636920032441.do
- pandasドキュメント http://pandas.pydata.org/pandas-docs/stable/index.html
- StatsModelsドキュメントhttp://statsmodels.sourceforge.net/stable/
