NT倍率のトレンドが変わった
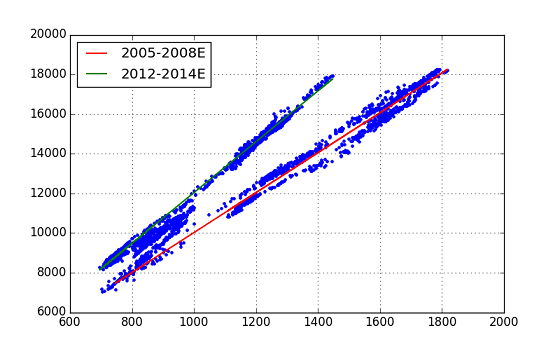
前の記事において,2つの株式指数Topix / Nikkei225 の分析,特に回帰分析からNTのプロットは大きく2つのTrend Lineにのっていること,また時系列的には,勾配が緩やかなTrend-1(NT ratio=10.06) から勾配が急なTrend-2 (NT ratio=12.81) に変わってきたことが分かった.
** 図.前記事の図(Topix vs. Nikkei225) の再掲 **

勾配が急なTrend-2は,「アベノミクス」経済政策と関係があると推測されるが,回帰分析からはその開始時が明確にできなかった.今回は,機械学習の手法を用いて,Trend-1とTrend-2を分類し,Trend-2の始まりがいつであったかを明らかにするTryを行った.
Trial.1 - K-Means Clustering
機械学習のPythonモジュールとして scikit-learn を用いることにしたが,分類するアプローチとしていろいろなものが考えられるが,最初にK-Means法を使ってみた.ラベルなしで行うClusteringの代表格である.
Codeは,以下の通り.
from sklearn.cluster import KMeans
from sklearn.decomposition import PCA

mypair.dropna(inplace=True)
X = np.column_stack([mypair['topix'].values, mypair['n225'].values])

# K-means clustering process

myinit = np.array([[mypair.loc['20050104', 'topix'], mypair.loc['20050104', 'n225']], \
			[mypair.loc['20130104', 'topix'], mypair.loc['20130104', 'n225']]])

k_means = KMeans(init=myinit, n_clusters=2, n_init=10)
k_means.fit(X)           # ... compute k-means clustering

k_means_labels = k_means.labels_
k_means_cluster_centers = k_means.cluster_centers_
k_means_labels_unique = np.unique(k_means_labels)

colors = ['b', 'r']
n_clusters = 2

for k, col in zip(range(n_clusters), colors):
    my_members = k_means_labels == k
    cluster_center = k_means_cluster_centers[k]
    plt.plot(X[my_members, 0], X[my_members, 1], 'w', markerfacecolor=col, marker='.')
    plt.plot(cluster_center[0], cluster_center[1], 'o', markerfacecolor=col, markeredgecolor='k', markersize=6)

plt.title('K-Means')
plt.grid(True)
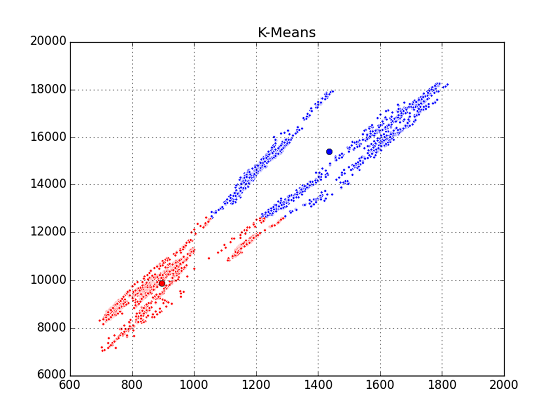
やはりダメだった.K-Means法では,データ間の(抽象的な)距離を測りながら近いものを自分のmemberに集めていく,というやり方らしいのだが,今回のように線に沿って散らばるアスペクト比の大きいものを扱うのには適さないようである.
Trial.2 - Primary Component Anarysis (PCA)
K-meansのプロットを見て,線状に散らばるデータを集めるために,何等かの座標変換を適用して「かたまり状」にした後にClusteringにかけられないか考えた.が,ドキュメント等を調べてみると,主成分分析(Primary Component Anasis=PCA) が適用できそう,ということが分かったのでPCAによる分類を試すことにした.
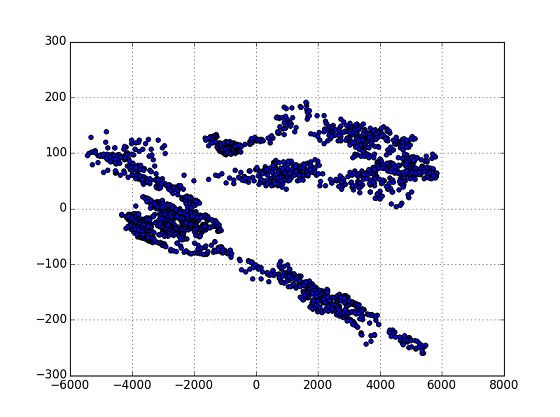
** 図.PCA処理後のPlot **
ここからY=0に境界線をおいて,2つのグループ分類することにした.
# PCA process

pca = PCA(n_components=2)
X_xf = pca.fit(X).transform(X)

plt.scatter(X_xf[:,0], X_xf[:,1])
plt.grid(True)
border_line = np.array([[-6000,0], [6000, 0]])
plt.plot(border_line[:,0], border_line[:,1],'r-', lw=1.6)

col_v = np.zeros(len(X_xf), dtype=int)
for i in range(len(X_xf)):
	col_v[i] = int(X_xf[i,1] / abs(X_xf[i,1])) * (-1)

mypair['color'] = col_v
mypair['color'].plot(figsize=(8,2), grid=True, lw=1.6)    # color historical chart
plt.ylim([-1.2, 1.2])

# plot scatter w/ colors

plt.figure(figsize=(12,5))
plt.subplot(121)
plt.scatter(X_xf[:,0], X_xf[:,1], marker='o', c=col_v)
plt.grid(True)
plt.title('Topix vs. Nikkei225 (PCA processed)')

plt.subplot(122)
plt.scatter(X[:,0], X[:,1], marker='o', c=col_v)
plt.grid(True)
plt.title('Topix vs. Nikkei225 (raw values)')
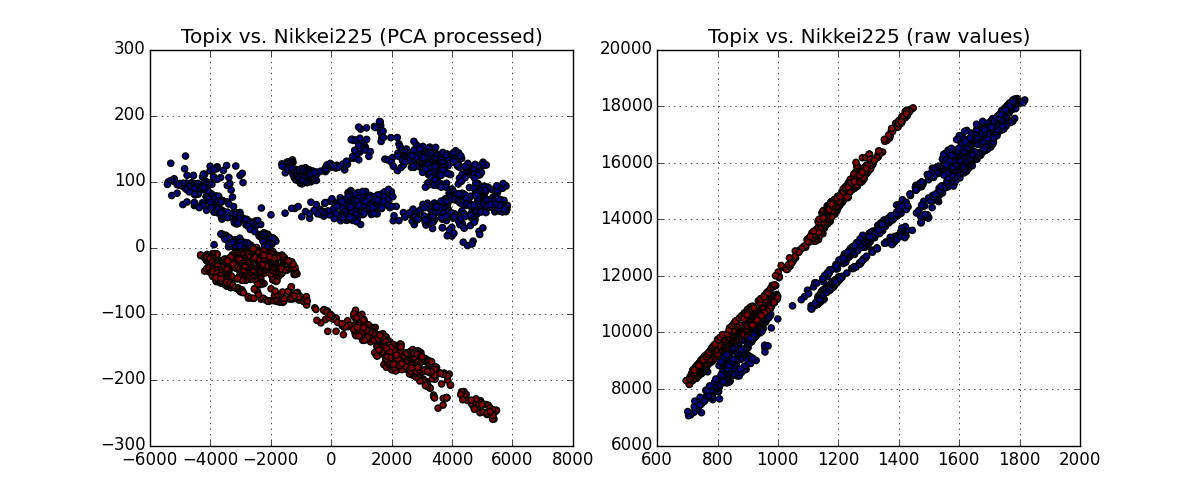
結果は下図の通り.(すみません,”色”が見にくいです.)
左側は,PCAで変換した座標系で色分けしたもの,この色を元の座標系においてplotしたもの.当初の意図の通り,Trendのグループ分けができていることが確認できる.グループの境界線として Y=0 としたことも,"まあ" 妥当といえるようだ.
まとめ
PCAにより,勾配が緩やかな青色plotグループと,勾配が急な赤色plotグループに分類することができた.この色のseries dataをHistorical Chartにしてみる.
**図.Trend(color)の移り変わり (y=-1:Trend-1, y=+1: Trend-2) **

上のチャートから, 2009年の後半まではTrend-1,その後やや遷移的な期間があって,2011年の第2四半期ぐらいからはNT倍率が大きいTrend-2が2014年まで継続していることが分かる.Trend-2 = 「アベノミクス」であるとすると,アベノミクスは2011年前半に始まっていたと推定することができる.(2011年前半というのは,東日本大震災があったのを思い起こさせます.)
他の機械学習手法の適用や,今回のPCA手法の検証などは今後検討したいと思います.またその他の経済データ(例えば化石燃料の輸入量など)が入手できた際には,それとの関係も調べてみたいと思います.
参考文献
- データサイエンティスト養成読本(技術評論社)http://gihyo.jp/book/2013/978-4-7741-5896-9
- "Python for Finance": (O'reilly Media) http://shop.oreilly.com/product/0636920032441.do
- pandasドキュメント http://pandas.pydata.org/pandas-docs/stable/index.html
- Scikit-learnドキュメントhttp://scikit-learn.org/dev/index.html#


