scikit-learnとTensorFlowによる実践機械学習 第6章 決定木
2019年6月からデータサイエンティストの研修に参加している新参者です。
理論やプログラミングを日々学んでは抜けていってるような気がするので、備忘録として投稿します。
参考書などを読みながら理解をしておりますが、誤解している点や大間違いをしている点などございましたらご指摘いただけますと幸いです。
PythonとScikit-learnを使って、決定木を実装する
このページでは、実装して動かすことを目標としています。
理論は数学編で記載したいと考えておりますので、あらかじめご承知おきください。
今回使用したもの
- python 3.7.3
- scikit-learn 0.20.3
- Jupyter Notebook 4.4.0
概要
今回はscikit-learnとTensorFlowによる実践機械学習の第6章の決定木を実装します。
結論
「詳細も気になるけど、とにかくコードが知りたい」方へ、完成したコードは以下の通りです。
# python2,3 に対応するために
from __future__ import division, print_function, unicode_literals

# 必要モジュールのインポート
import numpy as np
import os

# ランダムシードの設定
np.random.seed(42)

# 結果のプロット用
%matplotlib inline
import matplotlib
import matplotlib.pyplot as plt

plt.rcParams["axes.labelsize"] = 14
plt.rcParams["xtick.labelsize"] = 12
plt.rcParams["ytick.labelsize"] = 12

# 保存先のディレクトリの指定
PROJECT_DIR = "C:/Users/The_Noob_man/Desktop/python/scikit-learnとTensorFlowによる実践機械学習/output/"
CHAPTER_ID  = "decision_trees"

# 作り出した図を保存する関数
def image_path(fig_id):
    return os.path.join(PROJECT_DIR, "images", CHAPTER_ID, fig_id)

def save_fig(fig_id, tight_layout = True):
    print("Saving figure", fig_id)
    if tight_layout:
        plt.tight_layout()
    # 画像の保存のオプション指定
    plt.savefig(image_path(fig_id) + ".png", format = "png", dpi=300)
# ==========================================================================
from sklearn.datasets import load_iris
from sklearn.tree import  DecisionTreeClassifier

iris = load_iris()

# irisデータの構造を見てみる
import pandas as pd
df = pd.DataFrame(iris, columns = iris.feature_names)
print(df)

X = iris.data[:, 2:]  # 特徴量で花弁の長さと幅を指定
y = iris.target

tree_clf = DecisionTreeClassifier(max_depth = 2, random_state = 42)
tree_clf.fit(X, y)

# ======================================================================
# 結果の保存
from sklearn.tree import export_graphviz

export_graphviz(tree_clf, out_file = image_path("iris_tree.dot"),
                feature_names = iris.feature_names[2:],
                class_names = iris.target_names, rounded = True,
               filled = True)

# ======================================================================
# 可視化
from matplotlib.colors import ListedColormap

def plot_decision_boundary(clf, X, y, axes=[0, 7.5, 0, 3], iris = True,
                           legend = False, plot_training = True):
    x1s = np.linspace(axes[0], axes[1], 100)
    x2s = np.linspace(axes[2], axes[3], 100)

    x1, x2 = np.meshgrid(x1s, x2s)
    X_new  = np.c_[x1.ravel(), x2.ravel()]
    y_pred = clf.predict(X_new).reshape(x1.shape)

    custom_cmap = ListedColormap(['#fafab0','#9898ff','#a0faa0'])
    plt.contourf(x1, x2, y_pred, alpha = 0.3, cmap = custom_cmap,
                 linewidth = 10)

    # irisが Falseの時とは、どんな時か
    if not iris:
        custom_cmap2 = ListedColormap(['#7d7d58','#4c4c7f','#507d50'])
        plt.contour(x1, x2, y_pred, cmap = custom_cmap2, alpha = 0.8)

    if plot_training:
        plt.plot(X[:, 0][y == 0], X[:, 1][y == 0], "yo", label = "Iris-Setosa")
        plt.plot(X[:, 0][y == 1], X[:, 1][y == 1], "bs", label = "Iris-Versicolor")
        plt.plot(X[:, 0][y == 2], X[:, 1][y == 2], "g^", label = "Iris-Virginica")
        plt.axis(axes)

    if iris:
        plt.xlabel("Petal length", fontsize = 14)
        plt.ylabel("Petal width", fontsize  = 14)
    else:
        plt.xlabel(r"$x_1$", fontsize = 18)
        plt.ylabel(r"$x_2$", fontsize = 18, rotation = 0)

    if legend:
        plt.legend(loc = "lower right", fontsize = 14)

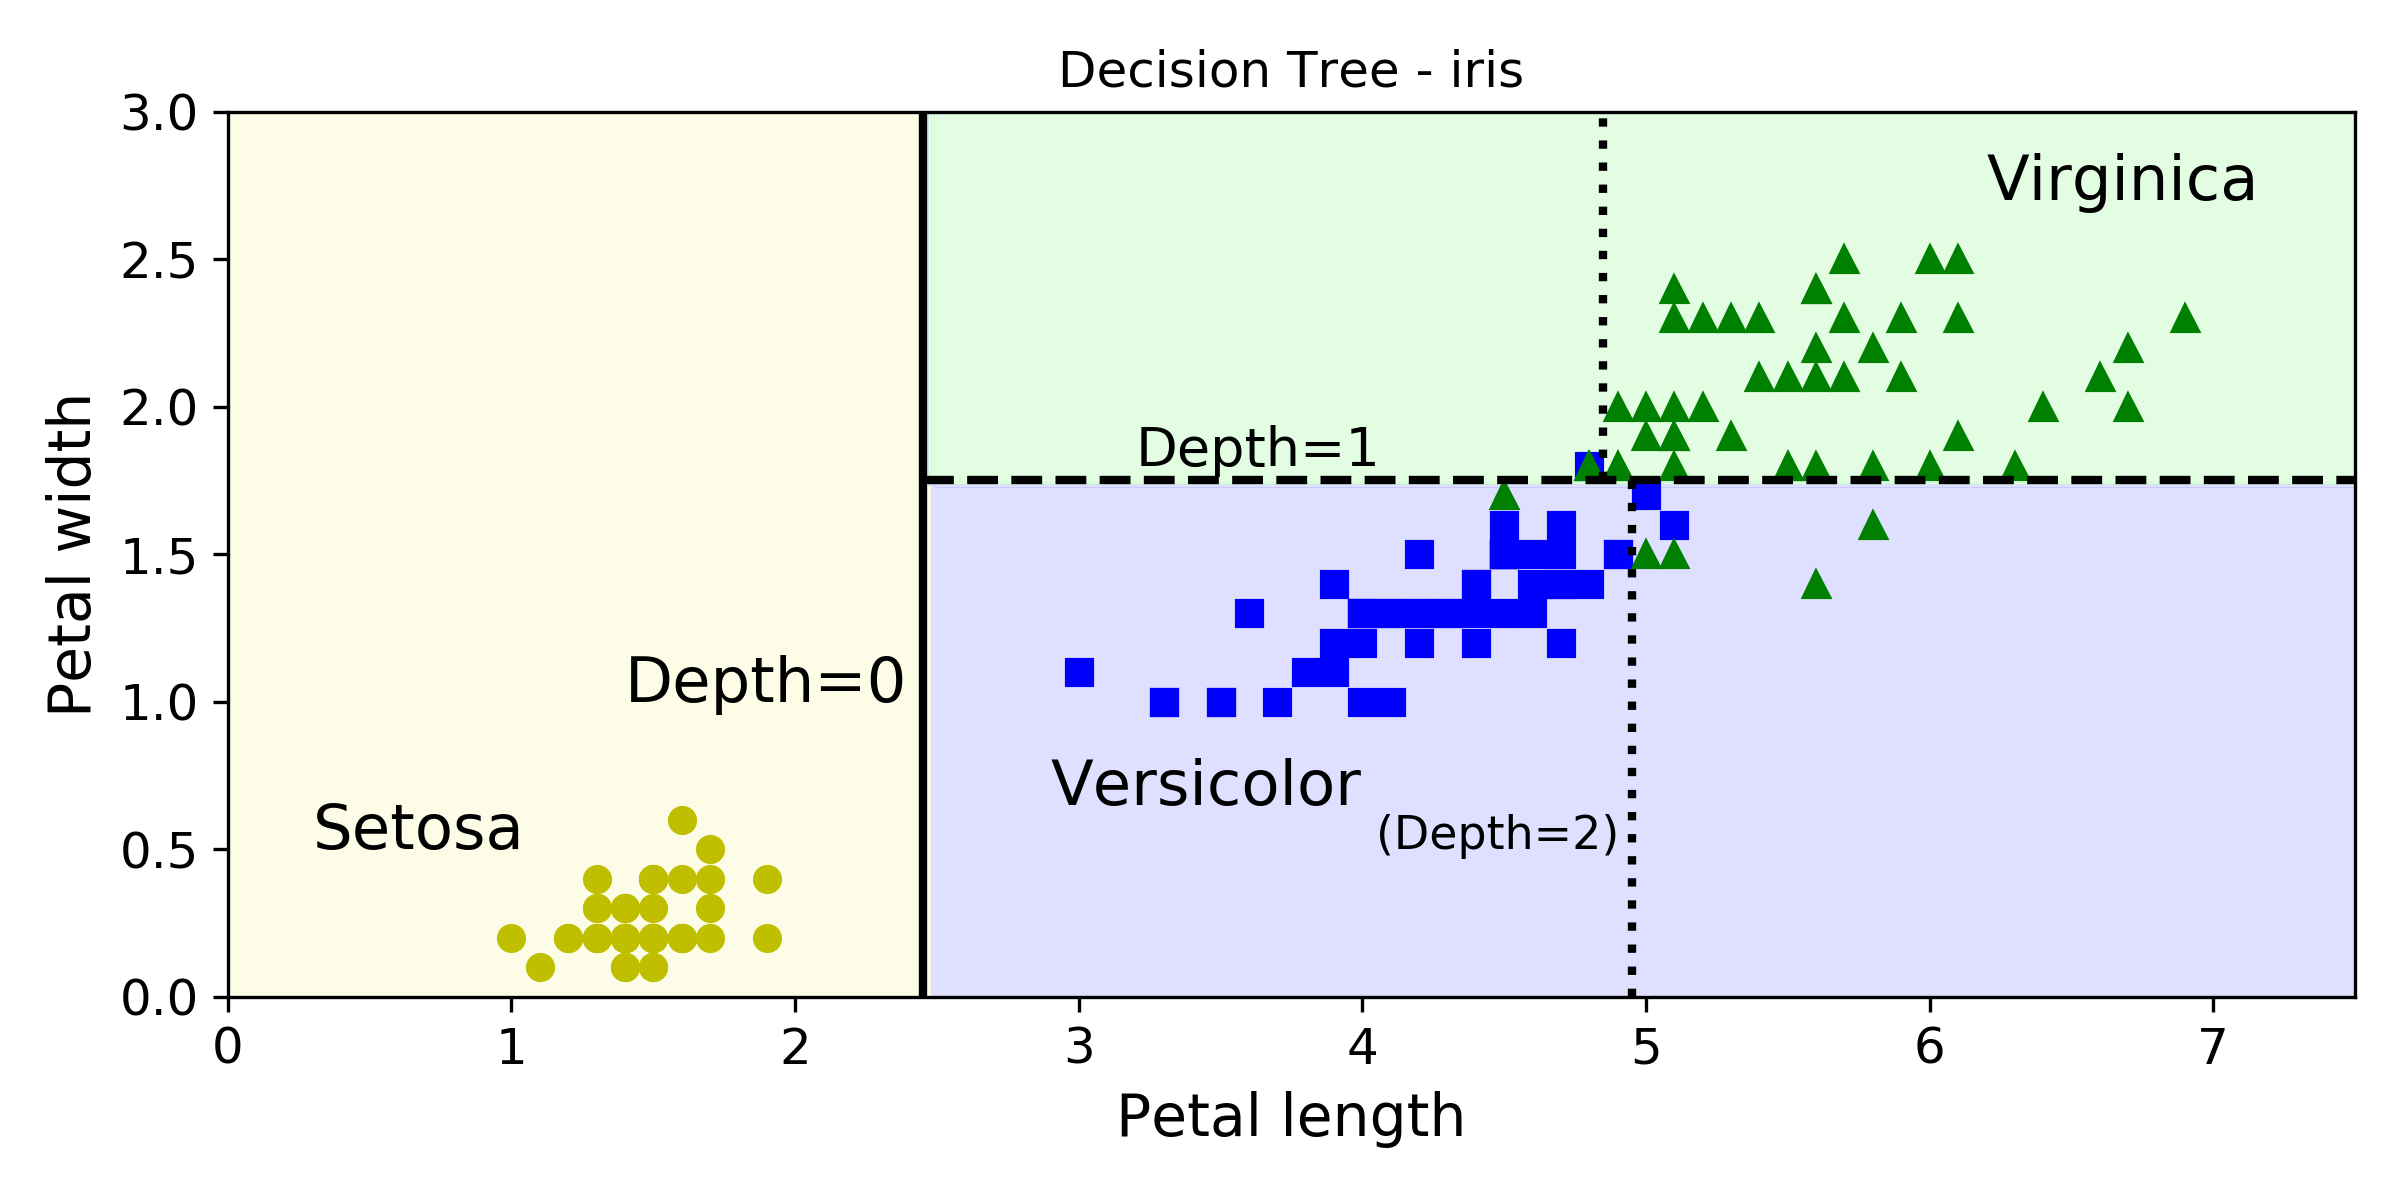
plt.figure(figsize =(8, 4))
plot_decision_boundary(tree_clf, X, y)

plt.plot([2.45, 2.45], [0, 3], "k-", linewidth=2)
plt.plot([2.45, 7.5], [1.75, 1.75], "k--", linewidth=2)
plt.plot([4.95, 4.95], [0, 1.75], "k:", linewidth=2)
plt.plot([4.85, 4.85], [1.75, 3], "k:", linewidth=2)

plt.text(1.40, 1.0, "Depth=0", fontsize=15)
plt.text(0.30, 0.50, "Setosa", fontsize =15)

plt.text(3.2, 1.80, "Depth=1", fontsize=13)
plt.text(6.2, 2.7, "Virginica", fontsize = 15)

plt.text(4.05, 0.5, "(Depth=2)", fontsize=11)
plt.text(2.9, 0.65, "Versicolor", fontsize = 15)

plt.title("Decision Tree - iris")

# 図の保存
save_fig("decision_tree_decision_boundaries_plot")
plt.show()
コードの解説
準備
# python2,3 に対応するために
from __future__ import division, print_function, unicode_literals

# 必要モジュールのインポート
import numpy as np
import os

# ランダムシードの設定
np.random.seed(42)

# 結果のプロット用
%matplotlib inline
import matplotlib
import matplotlib.pyplot as plt

plt.rcParams["axes.labelsize"] = 14
plt.rcParams["xtick.labelsize"] = 12
plt.rcParams["ytick.labelsize"] = 12

# 保存先のディレクトリの指定
# 指定したディレクトリが存在しない場合は自分で作る必要があります
PROJECT_DIR = "保存したい/ディレクトリ先/を指定"
# 今回は決定木なので、decision_treesにします
CHAPTER_ID  = "decision_trees"


# 作り出した図を保存する関数
def image_path(fig_id):
    return os.path.join(PROJECT_DIR, "images", CHAPTER_ID, fig_id)

def save_fig(fig_id, tight_layout = True):
    print("Saving figure", fig_id)
    if tight_layout:
        plt.tight_layout()
    # 画像の保存のオプション指定
    plt.savefig(image_path(fig_id) + ".png", format = "png", dpi=300)
データの準備
# そもそも、scikit-learnという名前のモジュールですが、使うときはsklearnです
from sklearn.datasets import load_iris
from sklearn.tree import  DecisionTreeClassifier

# sklearnが用意しているデータをirisデータを使用
# ほかにも、ボストンの住宅価格のload_bostonなどが存在する
iris = load_iris()

# irisデータを確認
# 特徴量は、Columns: [sepal length (cm), sepal width (cm), petal length (cm), petal width (cm)]が表示されます
import pandas as pd
pd.DataFrame(iris.data, columns = iris.feature_names)

# データに対応する品種の確認
# 0:"setosa", 1:"versicolor", 2:"virginica"
iris.target

X = iris.data[:, 2:]  # 特徴量で花弁の長さ(petal length)と幅(petal width)を指定
y = iris.target
モデル作成
# 今回は深さが最大で2の決定木を作成します
# random_stateは初期値を指定することで、同じ結果を再現できるように指定しています
tree_clf = DecisionTreeClassifier(max_depth = 2, random_state = 42)
tree_clf.fit(X, y)
結果の保存
from sklearn.tree import export_graphviz

# 分類過程を.dotファイルで保存します
export_graphviz(tree_clf, out_file = image_path("iris_tree.dot"),
                feature_names = iris.feature_names[2:],
                class_names = iris.target_names, rounded = True,
               filled = True)
可視化
# 可視化
from matplotlib.colors import ListedColormap

def plot_decision_boundary(clf, X, y, axes=[0, 7.5, 0, 3], iris = True,
                           legend = False, plot_training = True):
    x1s = np.linspace(axes[0], axes[1], 100)
    x2s = np.linspace(axes[2], axes[3], 100)

    x1, x2 = np.meshgrid(x1s, x2s)
    X_new  = np.c_[x1.ravel(), x2.ravel()]
    y_pred = clf.predict(X_new).reshape(x1.shape)

    custom_cmap = ListedColormap(['#fafab0','#9898ff','#a0faa0'])
    plt.contourf(x1, x2, y_pred, alpha = 0.3, cmap = custom_cmap,
                 linewidth = 10)

    if not iris:
        custom_cmap2 = ListedColormap(['#7d7d58','#4c4c7f','#507d50'])
        plt.contour(x1, x2, y_pred, cmap = custom_cmap2, alpha = 0.8)

    if plot_training:
        plt.plot(X[:, 0][y == 0], X[:, 1][y == 0], "yo", label = "Iris-Setosa")
        plt.plot(X[:, 0][y == 1], X[:, 1][y == 1], "bs", label = "Iris-Versicolor")
        plt.plot(X[:, 0][y == 2], X[:, 1][y == 2], "g^", label = "Iris-Virginica")
        plt.axis(axes)

    if iris:
        plt.xlabel("Petal length", fontsize = 14)
        plt.ylabel("Petal width", fontsize  = 14)
    else:
        plt.xlabel(r"$x_1$", fontsize = 18)
        plt.ylabel(r"$x_2$", fontsize = 18, rotation = 0)

    if legend:
        plt.legend(loc = "lower right", fontsize = 14)

plt.figure(figsize =(8, 4))
plot_decision_boundary(tree_clf, X, y)

plt.plot([2.45, 2.45], [0, 3], "k-", linewidth=2)
plt.plot([2.45, 7.5], [1.75, 1.75], "k--", linewidth=2)
plt.plot([4.95, 4.95], [0, 1.75], "k:", linewidth=2)
plt.plot([4.85, 4.85], [1.75, 3], "k:", linewidth=2)

plt.text(1.40, 1.0, "Depth=0", fontsize=15)
plt.text(0.30, 0.50, "Setosa", fontsize =15)

plt.text(3.2, 1.80, "Depth=1", fontsize=13)
plt.text(6.2, 2.7, "Virginica", fontsize = 15)

plt.text(4.05, 0.5, "(Depth=2)", fontsize=11)
plt.text(2.9, 0.65, "Versicolor", fontsize = 15)

plt.title("Decision Tree - iris")

# 図の保存
save_fig("decision_tree_decision_boundaries_plot")
plt.show()
#で指定されいる文字はカラーコードです
お気に入りの色がある方は、調べてみると楽しいかもしれません
結果
次回
次回は決定木の数学編を投稿しようと考えております。
期間が空かないように気を付けます。
