[2019年3月20日にアップデート]
フルフルの英語記事はこちら
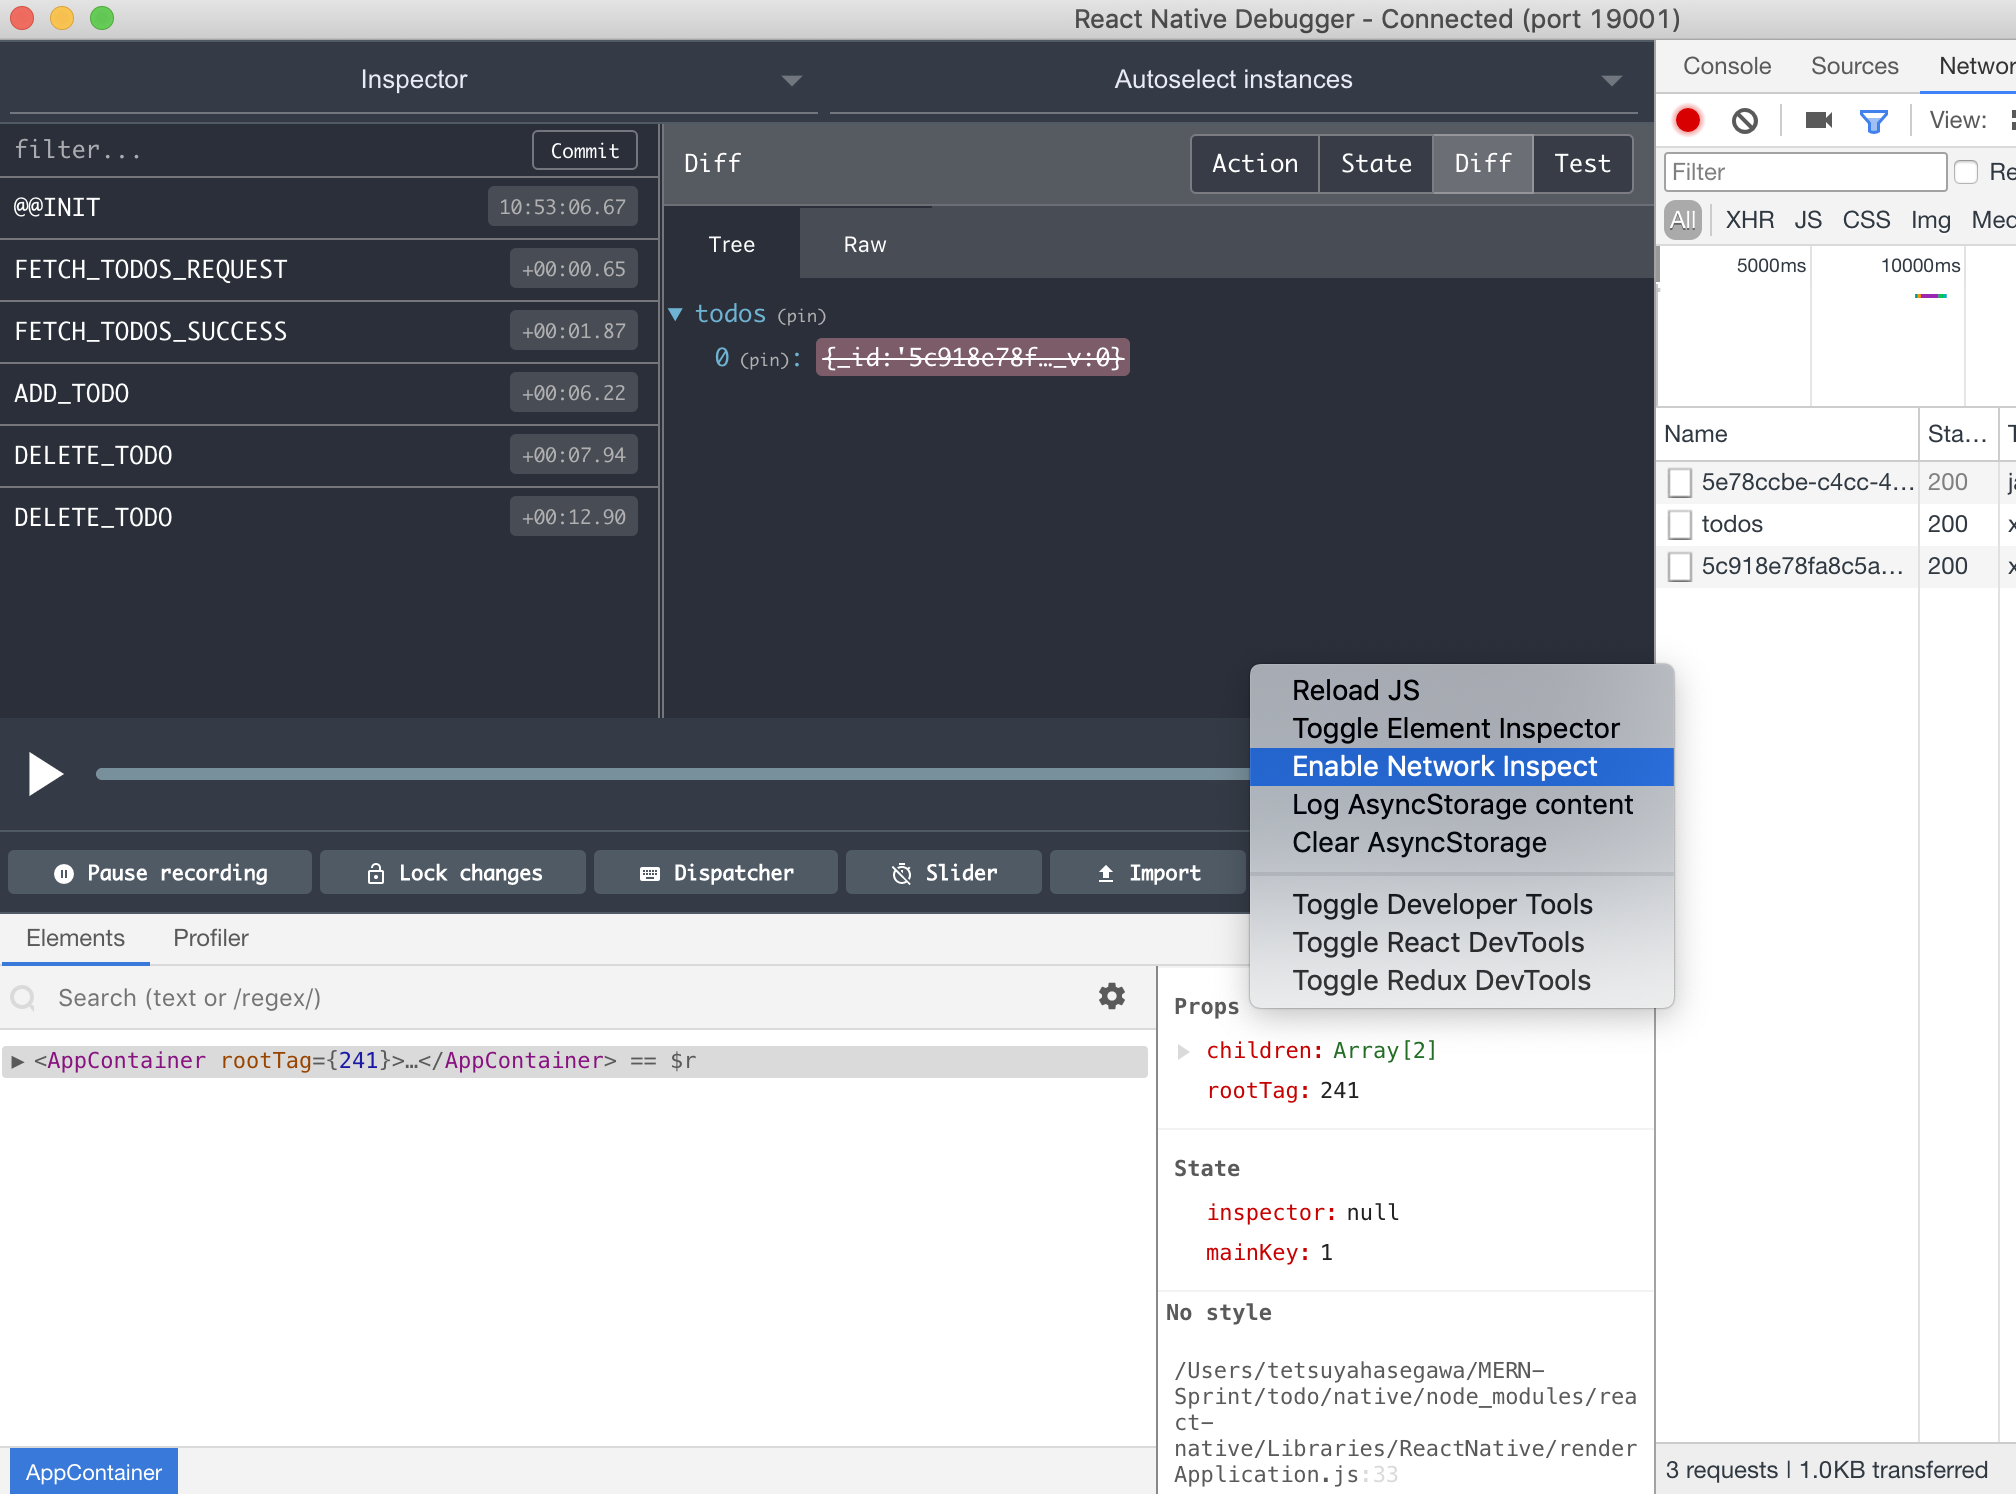
ExpoのアプリでReduxデバッグをしたい時にはReact Native Debuggerがオススメです。React Native DebuggerならChrome Devtools, React Devtools, Redux Devtoolsの三種の神器が一つの画面に集約できます。

1. React Native Debuggerをインストールする。
brew update && brew cask install react-native-debugger
2. React Native Debuggerを開く
open ‘rndebugger://set-debugger-loc?host=localhost&port=19001’
(デフォルトのportは8081ですが、Expoは19001を使っています。)
3. Expoアプリをスタートし、デバッグモードをonにする
npm start
Expo Clientでアプリを開き、フリフリして、Debug Remote JSを選択。
これで、Chrome Devtoolsは繋がっているはずです。
4. React Devtoolsのセットアップ
Docsによれば、実機でアプリを確認する際は、今一歩セットアップが必要な場合があるようです。
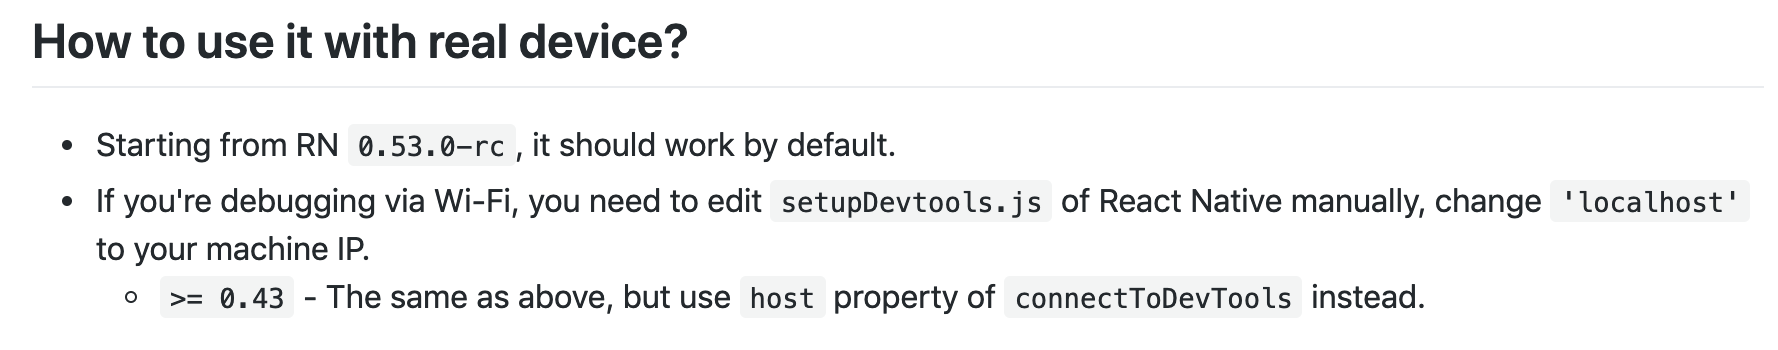
setupDevtools.jsのファイルをnode_modules/react-native/Libraries/Core/Devtools/setupDevtools.jsから開き、connectToDevToolsにパスするobjectのprop、"host"に自分のlocal IPを入れます。
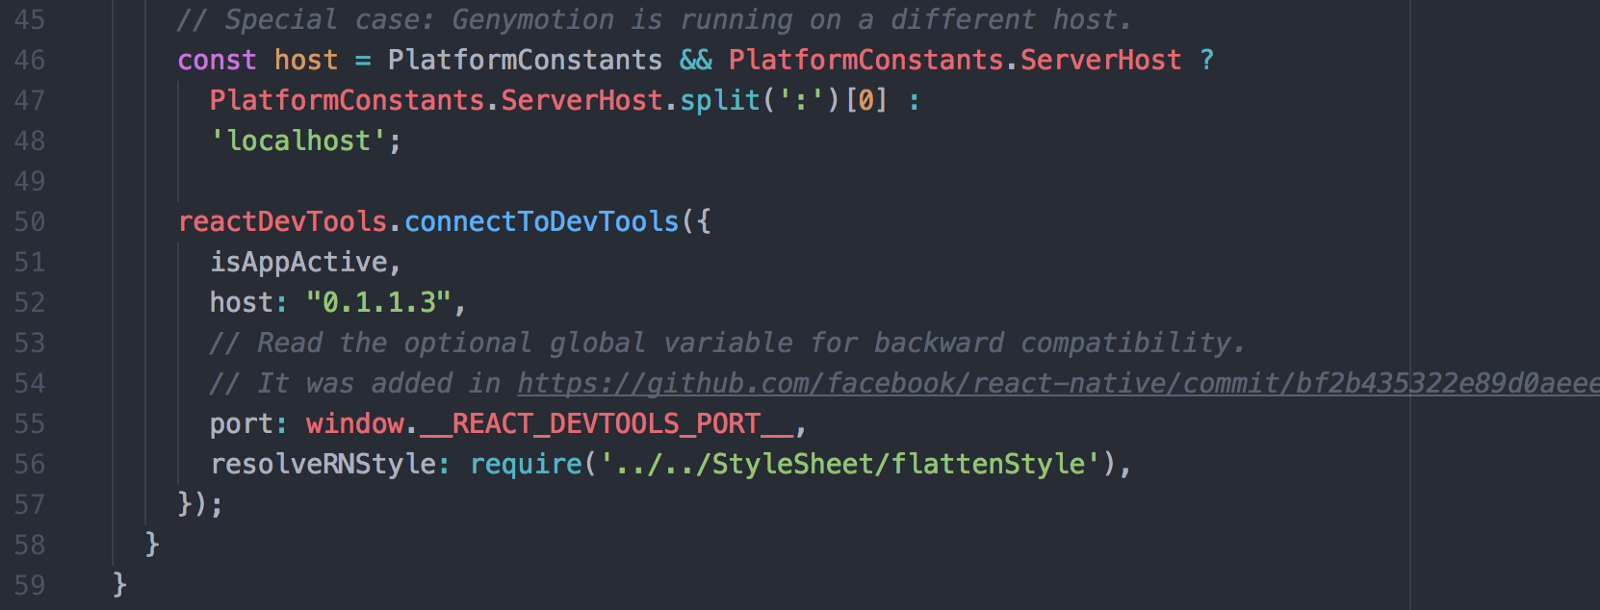
Local IPはこのサイトでチェックできます。
5. Redux Devtoolsのセットアップ
window.REDUX_DEVTOOLS_EXTENSIONはデフォルトで与えられているので、Webの時と同様です。
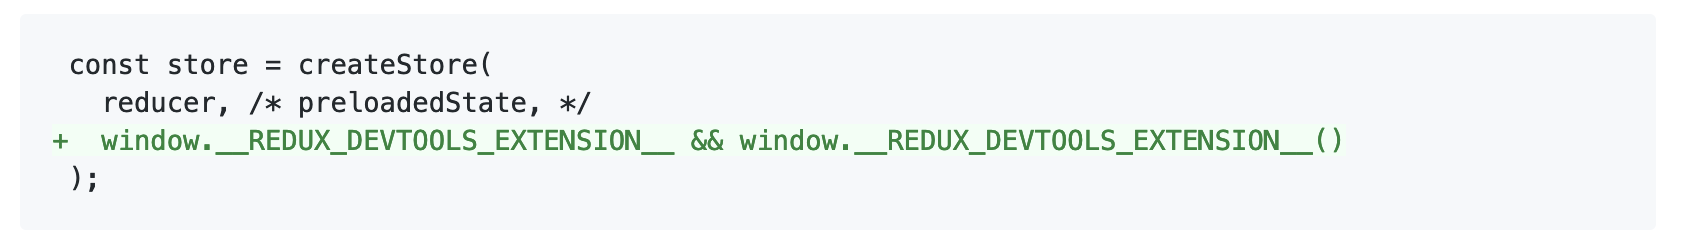
ただし、古いバージョンではデフォルトで与えられていませんでした。その際は、redux-devtools-extensionをnpm iし、以下のようにする。
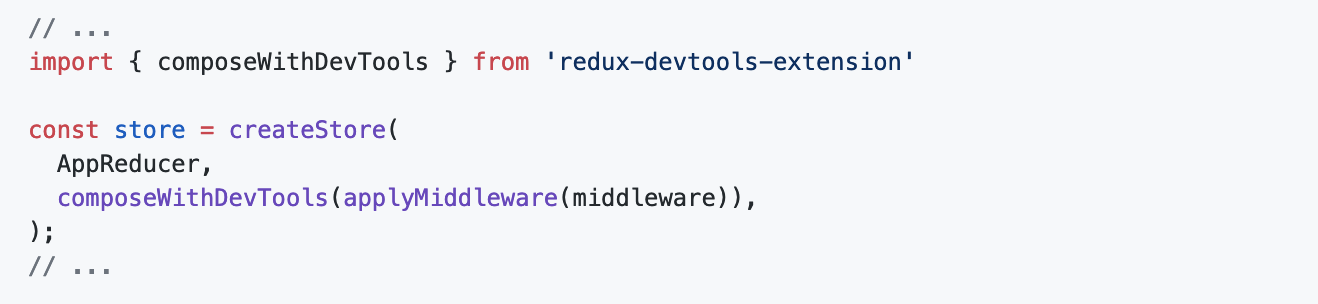
以上で、セットアップ完了です。
P.S.ネットワークリクエストを見る際は、React DevtoolsとRedux Devtools辺りで、右クリックし、Enable Network Inspectを押してください。