Platypus 概要
基本的にドキュメントのGetting Startedを解説.
- Pythonで使える多目的進化アルゴリズムのフレームワーク
- Deap,PyGMO,Scipyと違い多目的に特化している
- NSGA-II, NSGA-III, MOEA/D, IBEA, Epsilon-MOEA, SPEA2, GDE3, OMOPSO, SMPSO, Epsilon-NSGA-IIをサポート
- カモノハシ
多目的な遺伝的アルゴリズムのフレームワークに,自然淘汰されずに生き残ってきたPlatpus(カモノハシ)の名前を付けるあたりセンスを感じる.
インストール
ソースリポジトリから
git clone https://github.com/Project-Platypus/Platypus.git
cd Platypus
python setup.py install
pipなら
pip install platypus-opt
anacondaなら
conda install -c conda-forge platypus-opt
例題1
1変数2目的の多目的最適化
\begin{array}{}
\boldsymbol{argmin}  &\quad
\left.
\begin{array}{}
 f_{1} &= x^2   \\
 f_{2} &= (x-2)^2
\end{array}
\right. \\
\boldsymbol{subject \quad to}  &\quad  -10 \leq x \leq 10
\end{array}
これを実装すると
from platypus import NSGAII, Problem, Real

def schaffer(x):
    return [x[0]**2, (x[0]-2)**2]

problem = Problem(1, 2)
problem.types[:] = Real(-10, 10)
problem.function = schaffer

algorithm = NSGAII(problem)
algorithm.run(10000)
見通しが良い.クラスを作ることがないので初心者受けも良い.
Problemの引数は(変数の数,目的関数の数)で, 変数は-10~10の連続値で定義されている
パレート解はalgorithm.resultの中に保存されている
print("x\t f1\t f2")

for solution in algorithm.result:
    print("%0.3f\t%0.3f\t%0.3f" \
          % tuple(solution.variables + solution.objectives[:]))

例題2
2変数2目的2制約の制約付き最適化問題.
\begin{array}{}
\boldsymbol{argmin}  &\quad
\left\{
\begin{array}{}
 f_{1} &= -2x_1 + x_2   \\
 f_{2} &= 2x_1 + x_2
\end{array}
\right. \\
\boldsymbol{subject \quad to}  &\quad
\left\{
\begin{array}{}
 g_{1} &= -x_1 + x_2 -1  \\
 g_{2} &= x_1 + x_2 -7 \\
& 0 \leq x_1 \leq 5 \\
& 0 \leq x_2 \leq 3
\end{array}
\right.
\end{array}
これも実装すると
from platypus import NSGAII, Problem, Real

def belegundu(vars):
    x1 = vars[0]
    x2 = vars[1]
    return [-2*x1 + x2, 2*x1 + x2], [-x1 + x2 - 1, x1 + x2 - 7]

problem = Problem(2, 2, 2)
problem.types[:] = [Real(0, 5), Real(0, 3)]
problem.constraints[:] = "<=0"
problem.function = belegundu

algorithm = NSGAII(problem)
algorithm.run(10000)
変数を引数に,目的関数の値のリストと制約条件関数の値のリストを返すbelegunduという関数を定義し,
Problemで変数の数,目的関数の数,制約関数の数を定義している.
パレート解をDataFrameに取り出す
import pandas as pd

df = pd.DataFrame(columns = ("x1","x2","c1","c2","f1","f2"))
for i in range(len(algorithm.result)):
  df.loc[i] = algorithm.result[i].variables[:] + \
    algorithm.result[i].constraints[:] \
    +algorithm.result[i].objectives[:]

df.to_csv("platypus_exp2.csv")
分散共分散行列を表示する
import seaborn as sns
sns.pairplot(df)

最適解の選択をしたい場合はParaViewが便利.
ParaViewを開いて下記のように画面分割する.

選択したものが、赤で表示される
アルゴリズムの比較
前述した通りplatypusには多くのアルゴリズムが実装されている.
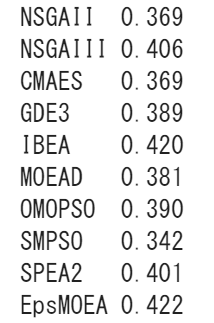
ベンチマーク関数DTLZ2を使った比較を行う.
from platypus.algorithms import *
from platypus.problems import DTLZ2
from platypus.indicators import  Hypervolume

problem = DTLZ2(3)

# setup the comparison
algorithms = [NSGAII(problem),
              NSGAIII(problem, divisions_outer=12),
              CMAES(problem, epsilons=[0.05]),
              GDE3(problem),
              IBEA(problem),
              MOEAD(problem),
              OMOPSO(problem, epsilons=[0.05]),
              SMPSO(problem),
              SPEA2(problem),
              EpsMOEA(problem, epsilons=[0.05])]

# run each algorithm for 10,000 function evaluations
for a in algorithms:
  a.run(10000)


# compute and print the hypervolume
hyp = Hypervolume(minimum=[0,0,0], maximum=[1,1,1])

for algorithm in algorithms:
    print("%s\t%0.3f" % (algorithm.__class__.__name__, hyp(algorithm.result)))

ハイパーボリュームはパレート解の支配率?を表示している?
可視化すると
from mpl_toolkits.mplot3d import axes3d
# increase figure size# incre
import matplotlib.pyplot as plt
pylab.rcParams['figure.figsize'] = (16.0, 6.0)

# generate the plot
fig = plt.figure()

for i in range(len(algorithms)):
    s = algorithms[i].result
    ax = fig.add_subplot(2, 5, i+1, projection='3d')
    ax.scatter([s.objectives[0] for s in algorithms[i].result],
               [s.objectives[1] for s in algorithms[i].result],
               [s.objectives[2] for s in algorithms[i].result])
    ax.set_xlim([0, 1.1])
    ax.set_ylim([0, 1.1])
    ax.set_zlim([0, 1.1])
    ax.view_init(elev=30.0, azim=15)
    ax.set_title(algorithms[i].__class__.__name__)

plt.show()

感想
- Pythonで多目的最適化をするならplatypusが使いやすい
- 新しそうなアルゴリズムが実装されている?
- 大きなプロジェクトでなさそうなので今後の開発が気になる
