In this article, I generate time series data of sales and visualize sales by month and day of the week.
※If you have a data, you don't have to read contents1,2
Contents
1. Creation of simuration data 1
2. Creation of simuration data 2
3. Data combination
4. Organize time series data
5. Total sales by day of the week and month
6. Data visualization
1. Creation of simulation data 1
> time <- seq(as.Date("2020/03/01"), as.Date("2020/03/30"), "day")
> sales <- rpois(length(time), lambda=10)
> Data1 <- data.frame(matrix(NA, ncol=2,nrow=length(time)))
> names(Data1) <- c("time", "sales")
> Data1$time <- time
> Data1$sales <- sales
> head(Data1)
        time sales
1 2020-03-01    10
2 2020-03-02    10
3 2020-03-03    10
4 2020-03-04     6
5 2020-03-05    14
6 2020-03-06    12
2. Creation of simulation data 2
> time <- seq(as.Date("2020/04/01"), as.Date("2020/04/30"), "day")
> sales <- rpois(length(time), lambda=10)
> Data2 <- data.frame(matrix(NA, ncol=2,nrow=length(time)))
> names(Data2) <- c("time", "sales")
> Data2$time <- time
> Data2$sales <- sales
> head(Data2)
        time sales
1 2020-04-01    15
2 2020-04-02    12
3 2020-04-03    13
4 2020-04-04     7
5 2020-04-05    11
6 2020-04-06    11
3. Data combination
> nrow(Data1)
[1] 30
> nrow(Data2)
[1] 30
> Data <- rbind(Data1, Data2)
> nrow(Data)
[1] 60
4. Organize time series data
> library(lubridate)
> Data$year <- year(Data$time)
> Data$month <- month(Data$time)
> Data$week1 <- wday(Data$time)
> Data$week2 <- weekdays(Data$time)
> Data$time <- as.POSIXlt(Data$time)
> Data$date <- Data$time$mday
> head(Data,8)
        time sales year month week1  week2 date
1 2020-03-01    10 2020     3     1 日曜日    1
2 2020-03-02    10 2020     3     2 月曜日    2
3 2020-03-03    10 2020     3     3 火曜日    3
4 2020-03-04     6 2020     3     4 水曜日    4
5 2020-03-05    14 2020     3     5 木曜日    5
6 2020-03-06    12 2020     3     6 金曜日    6
7 2020-03-07    11 2020     3     7 土曜日    7
8 2020-03-08     9 2020     3     1 日曜日    8
5. Total sales by day of the week and month
> weekly_sales <- aggregate(Data$sales, list(Data$week1), sum)
> weekly_sales$Group.1 <- c("日", "月", "火", "水", "木", "金", "土")
> weekly_sales
  Group.1   x
1      日  90
2      月 118
3      火  76
4      水  95
5      木  83
6      金  96
7      土  76
> monthly_sales <- aggregate(Data$sales, list(Data$month), sum)
> monthly_sales$Group.1 <- c("3月", "4月")
> monthly_sales
  Group.1   x
1     3月 331
2     4月 303
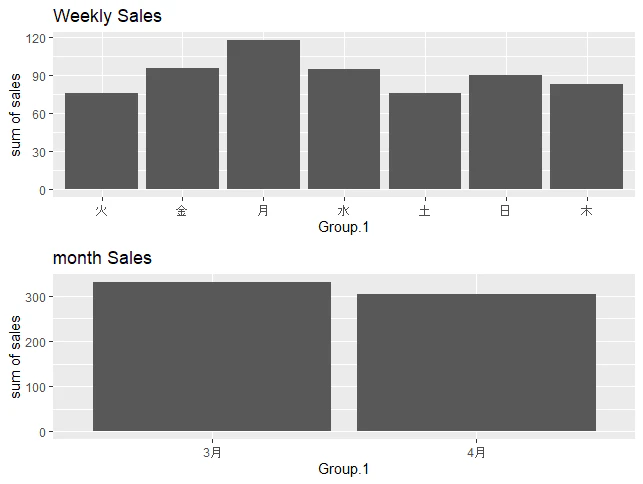
6. Data visualization
> library(ggplot2)
> p1 <- ggplot(data=weekly_sales, aes(x=Group.1))+
+   geom_bar(aes(y=x), size=1.8, stat="identity" )+
+   labs(title="Sales")+
+   ylab("Weekly sales")
>
> p2 <- ggplot(data=monthly_sales, aes(x=Group.1))+
+   geom_bar(aes(y=x), size=1.8, stat="identity" )+
+   labs(title="Sales")+
+   ylab("month sales")
>
> gridExtra::grid.arrange(p1, p2)