記事の目的
Rを使用して、インド料理ビュッフェ過程を実装します。
参考: ノンパラメトリックベイズ 点過程と統計的機械学習の数理
目次
| No. | 目次
| 1 |
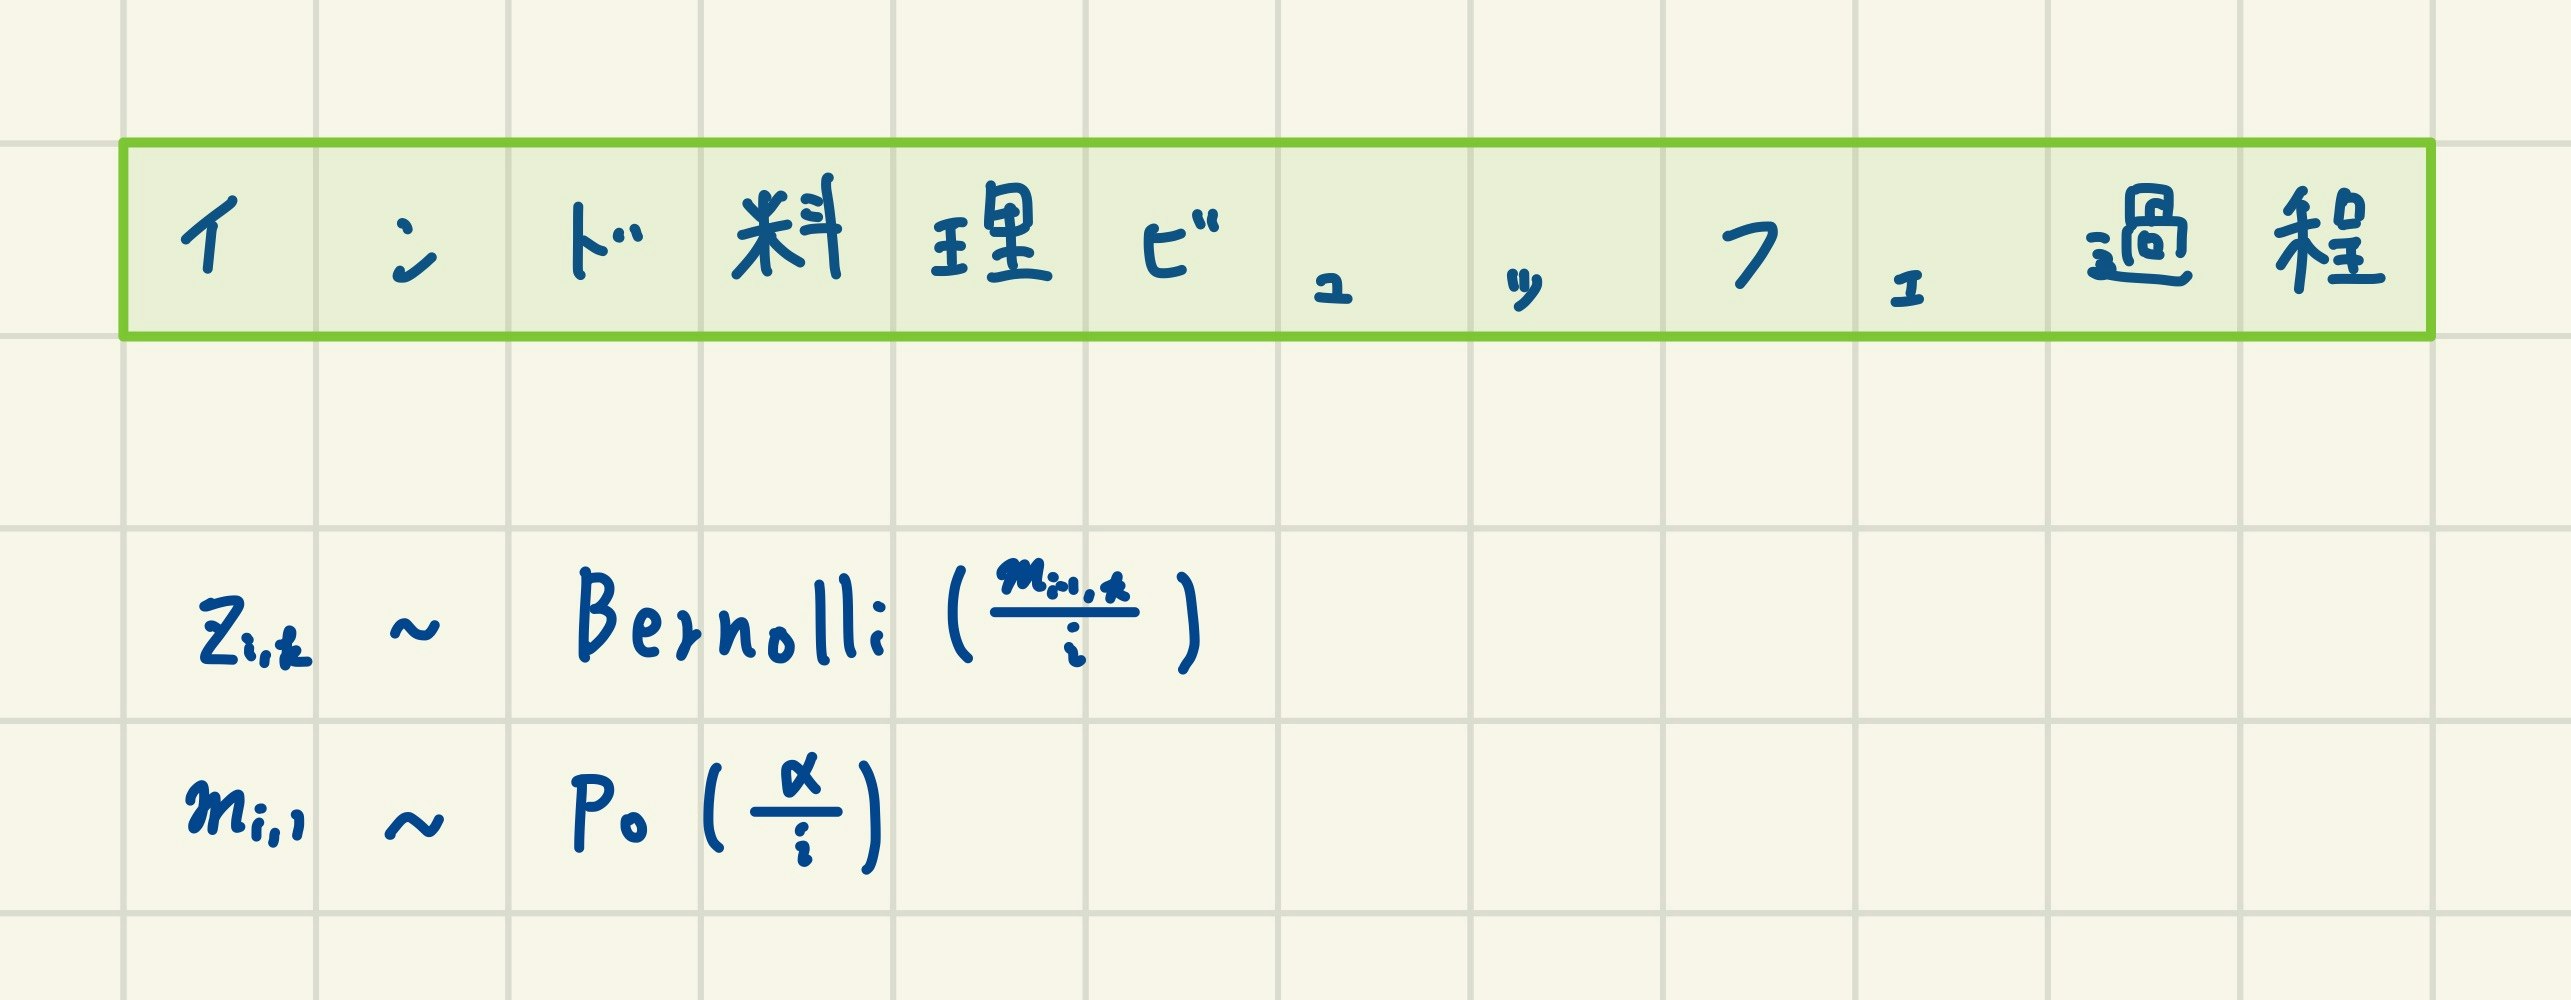
インド料理ビュッフェ過程の数式
|
2 |
実装
|
3 |
可視化
|
|
1. インド料理ビュッフェ過程の数式
2. 実装
n <- 30
alpha <- 5
set.seed(100)
for(i in 1:n){
  #mの計算
  if(i==1){
    m <- rep(1, rpois(1,alpha/1))
  }else{
    m <- apply(m.data, 2, sum)
  }
  #次の行のデータ作成
  z <- rbinom(length(m/(i+1)), 1, m/(i+1))
  m.next <- append(z, rep(1, rpois(1,alpha/(i+1))))
  #i行目までのデータを整理して、データ結合
  if(i==1){
    m.new <- append(m, rep(0, length(m.next)-length(m)))
    m.data <- rbind(m.new, m.next)
  }else{
    m.new.data <- t(apply(m.data, 1, function(x)
      append(x, rep(0, length(m.next)-length(m)))))
    m.data <- rbind(m.new.data, m.next)
  }
}
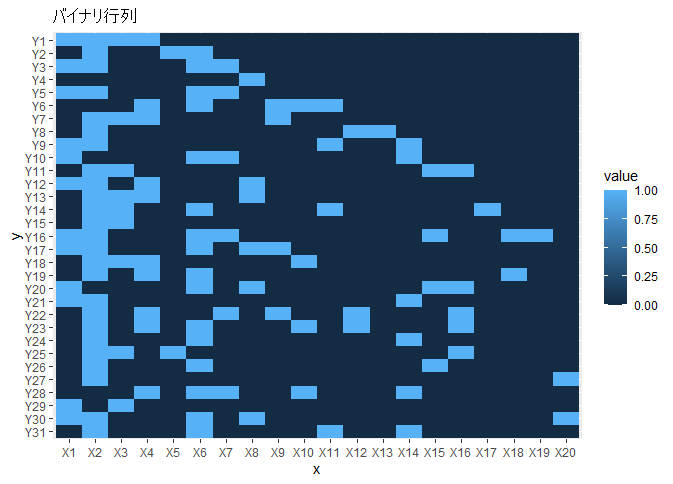
3. 可視化
library(ggplot2)
library(reshape2)
m.data <- data.frame(m.data)
m.data$row <- as.factor(paste0("Y", 1:nrow(m.data)))
m.data <- transform(m.data, row= factor(row, levels = paste0("Y", nrow(m.data):1)))
data <- melt(m.data)
ggplot(data, aes(variable, row)) +
  geom_tile(aes(fill=value))+
  labs(x="x",y="y",title="バイナリ行列")
◯SNS
・youtube
https://youtube.com/channel/UCFDyXEywtNhdtwqC3GAkYuA
・Twitter
https://twitter.com/Dken_ta