デモ
| 方法① | 方法② |
|---|---|
 |
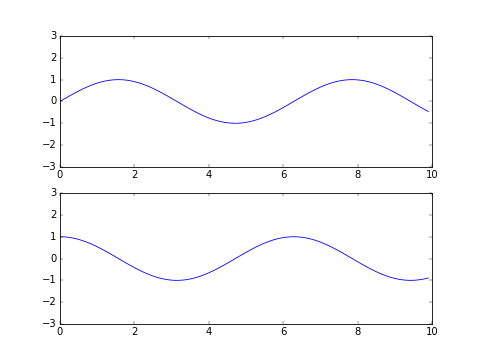 |
方法① インタラクティブな方法
1つのグラフを表示するときと同様にmatplotlib.pyplotモジュールを使ってグラフを描画する。
demo.py
import numpy as np
import matplotlib.pyplot as plt

x = np.arange(0., 10., 0.1)
s = np.sin(x)
c = np.cos(x)

plt.subplot(211)
plt.plot(x, s)
plt.ylim(-3, 3)

plt.subplot(212)
plt.plot(x, c)
plt.ylim(-3, 3)

plt.show()
方法② オブジェクト指向な方法
Axesオブジェクト(ax1, ax2)を生成し、Axesオブジェクトを使ってグラフを描画する。
demo2.py
import numpy as np
import matplotlib.pyplot as plt

x = np.arange(0., 10., 0.1)
s = np.sin(x)
c = np.cos(x)

fig = plt.figure()

ax1 = fig.add_subplot(211)
ax1.plot(x, s)
ax1.set_ylim(-3, 3)

ax2 = fig.add_subplot(212)
ax2.plot(x, c)
ax2.set_ylim(-3, 3)

plt.show()
両者の相違点
前者は記述量がやや少なく手軽な方法だが、自分が今どのグラフの作業をしているかが明示的でない。一方、後者はグラフごとにAxesオブジェクトが割り当てられるため、どのグラフを操作しているかが明示的である。
最近のmatplotlib関連の書籍では後者のオブジェクト指向な方法がよく採用されている(『Pythonによるデータ分析入門――NumPy、pandasを使ったデータ処理』など)。
参考
Pyplot tutorial — Matplotlib 1.5.1 documentation
http://matplotlib.org/users/pyplot_tutorial.html
matplotlib入門 - りんごがでている
http://bicycle1885.hatenablog.com/entry/2014/02/14/023734